4775
Preliminary feasibility study of MR Q-space trajectory imaging (QTI) for assessment of tissue microstructure in prostate cancer1Brigham and Women’s Hospital, Department of Radiology, Boston, MA, United States, 2Harvard Medical School, Boston, MA, United States, 3Universitätsklink Magdeburg, Magdeburg, Germany, 4Clinical Sciences Lund, Lund University, Lund, Sweden, 5Brigham and Women’s Hospital, Division of Urology, Boston, MA, United States
Synopsis
Q-space trajectory imaging (QTI) has shown promise for characterisation of tissue microstructure. This study seeks to determine if QTI is feasible in assessment of prostate cancer (PCa) and to prefrom a preliminary evaluation of its role to help identify clinically significant prostate cancer (Gleason Grade group ≥2 lesions). QTI was performed in 40 men, 16 of which had biopsy-proven PCa and a PIRADS v.2.1 score ≥3. Preliminary data suggest that quantification of QTI values may indeed be helpful in men with clinically significant disease.
Introduction
Multiparametric magnetic resonance imaging (mpMRI) is an increasingly important tool and reliable prognostic indicator in diagnosis and localization of clinically significant Prostate cancer (PCa)1, but can miss up to 26% of clinically important tumors2 . There is also a critical need to improve MR techniques for tumor localization for focal (sub-total gland) therapy, as more accurate tumor identification and tumor boundary definition is required. In this study we investigate if tensor-valued diffusion encoding and q-space trajectory imaging (QTI)3 analysis can improve on current qualitative assessment used in PI-RADS v2.1. We hypothesize that QTI has potential to provide unique quantifiable assessment of PCa which could be additive to PI-RADS qualitative score. We performed a feasibility study of tensor-valued diffusion encoding sequence and QTI for PCa assessment.Methods and Material
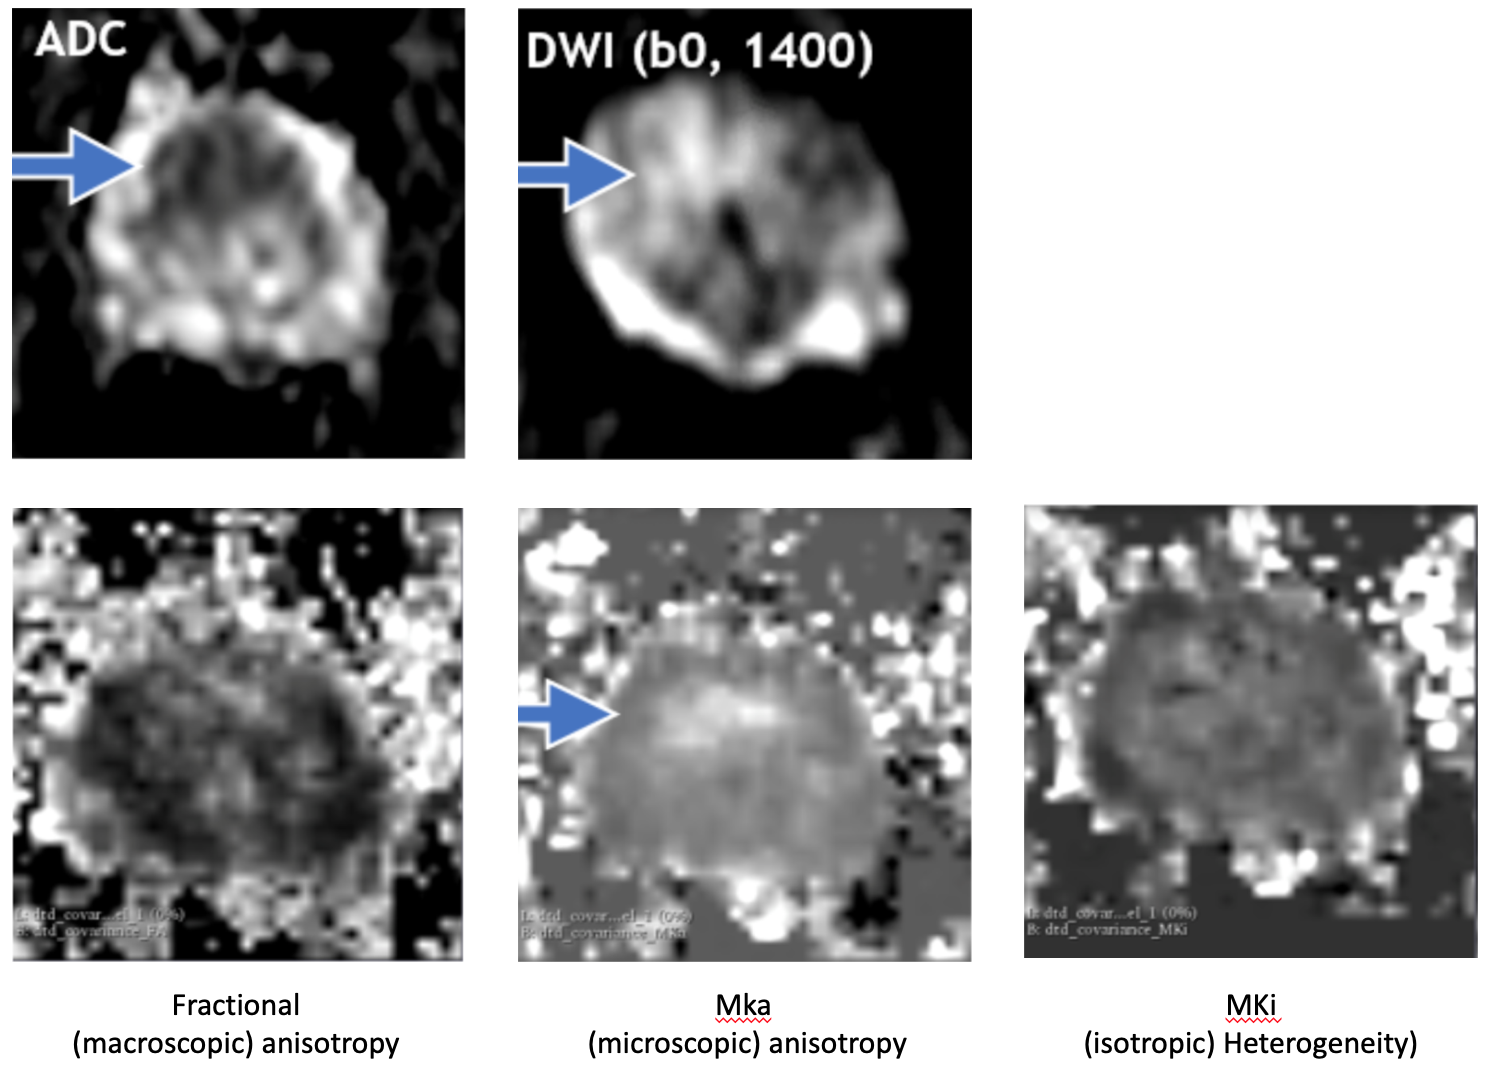
This prospective study was approved by the institutional review board, and consent was obtained from 71 men referred for clinically indicated prostate MR exams. All underwent a standard of care prostate MR imaging protocol at 3T (Prisma, Siemens Healthcare, Erlangen, Germany), supplemented with a whole gland, tensor-valued diffusion MRI with a prototype spin-echo sequence4 with TE=75ms, TR=2400ms, resolution of 2×2×4mm, b-values up to 1.4ms/µm2 (linear tensor encoding) and 1.1ms/µm2 (spherical tensor encoding). Total additional scan time was approximately 3:20 minutes. From QTI5, we obtained the fractional anisotropy (FA), mean diffusivity (MD), microscopic anisotropy (MKa), isotropic heterogeneity (MKi), and total mean kurtosis (MKt). Correlative pathological data extraction: The electronic medical records database was utilized to collect patient age and serum prostate-specific antigen (PSA) and all available pathology (form biopsy and/or prostatectomy). Image analysis: Image exclusion criteria included poor quality data and protocol deviations. Tumor Regions of Interest (TROIs) and Normal Regions of Interest (NROIs) were contoured using 3D Slicer (www.slicer.org) to obtain a 3D tumor map for mean ADC and mean QTI parameter extraction (FA, MD, MKa, MKi, MKt). TROIs were confirmed on all mpMRI maps, and contoured separately by a radiologist with more than 15 years of experience with prostate MR imaging on ADC (B0, 1400) and MD maps. NROIs were also delineated based upon all mpMRI maps, on the same or closest adjacent axial image to the TROI.Results
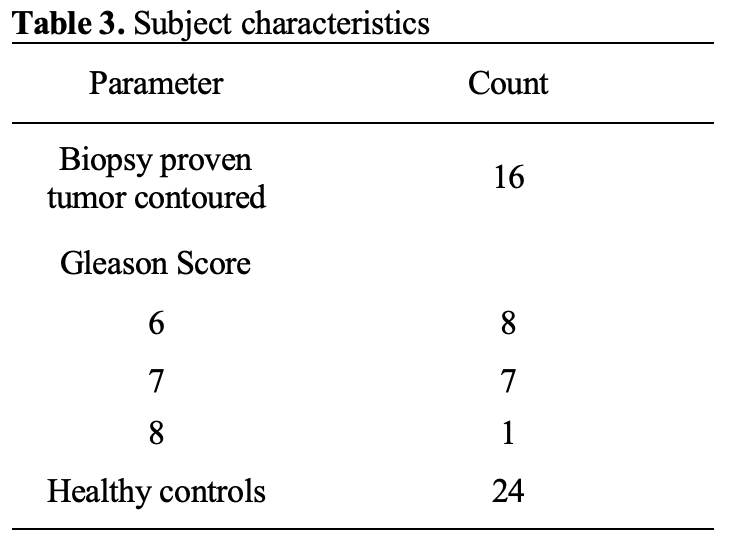
71 men consented to this study (mean age 67 ± 7 years; mean PSA 7 ± 5 ng/ml). 31 cases were excluded: 20 due to corrupt/poor quality data; 6 had prior treatment, 4 protocol failures and one exam was aborted due to claustrophobia. Thus a total of 40 cases were available for QTI analysis. 16 of the 40 cases included in this study had a positive PCa diagnosis (Gleason Score ≥ 3+3=6 and at least one lesion PI-RADS ≥ 3) using the standard clinical MRI protocol. NROI was contoured on all 40 cases. Descriptive statistics are provided in Table 1. Out of the 16 TROIs, 8 had Gleason pattern 6 and 8 cases had Gleason pattern 7. There was a significant difference bewteen all parameters (QTI and standard ADC) between PCa and NROI on a group level. A two-tailed t-test revealed a significant difference between NROI and both Gleason pattern 6 and Gleason pattern 7 lesions (see Table 1), and also between pattern 6 lesions and Gleason pattern 7 lesions. (see Table 2).Discussion and conclusions
In this pilot study, tensor-valued diffusion encoding and QTI analysis was feasible for evaluation of prostate in vivo. This non-invasive, in-depth analysis demonstrates significant differentiation between normal and tumor tissue in the prostate, suggesting that QTI may be helpful in assessment of microscopic anisotropy. In addition, FA, Mka, Mki and Mkt parameter maps of clinical insignificant cancer (Gleason Score 3+3=6) differed to that of clinically significant cancer (Gleason Score > 3+4=7). Future studies to improve patient motion correction and to investigate the impact of time-dependent diffusion are necessary6. In conclusion, QTI is a novel, promising technique for PCa and tissue microstructure assessment. However, this novel imaging strategy requires technical improvemens and in-depth pathological correlation to realize its true potential.Source of Funding: NIH EB 015 898
Acknowledgements
References
1. Turkbey, Baris, Andrew B. Rosenkrantz, Masoom A. Haider, Anwar R. Padhani, Geert Villeirs, Katarzyna J. Macura, Clare M. Tempany, et al. 2019. “Prostate Imaging Reporting and Data System Version 2.1: 2019 Update of Prostate Imaging Reporting and Data System Version 2.” European Urology, March. https://doi.org/10.1016/j.eururo.2019.02.033.
2. Borofsky, Samuel. 2018. “What Are We Missing? False- Negative Cancers at Multiparametric MR Imaging of the Prostate1.” Radiology 286 (1)
3. Westin, Carl-Fredrik, Hans Knutsson, Ofer Pasternak, Filip Szczepankiewicz, Evren Özarslan, Danielle van Westen, Cecilia Mattisson, et al. 2016. “Q-Space Trajectory Imaging for Multidimensional Diffusion MRI of the Human Brain.” NeuroImage 135 (July): 345–62.
4. Szczepankiewicz, Filip, Jens Sjölund, Freddy Ståhlberg, Jimmy Lätt, and Markus Nilsson. 2019. “Tensor-Valued Diffusion Encoding for Diffusional Variance Decomposition (DIVIDE): Technical Feasibility in Clinical MRI Systems.” PloS One 14 (3): e0214238.
5. Markus Nilsson, Filip Szczepankiewicz, Björn Lampinen, André Ahlgren, João P. de Almeida Martins, Samo Lasic, Carl-Fredrik Westin, and Daniel Topgaard. An open-source framework for analysis of multidimensional diffusion MRI data implemented in MATLAB. Proc. Intl. Soc. Mag. Reson. Med. (26), Paris, France, 2018. http://archive.ismrm.org/2018/5355.html
6. Lemberskiy, Gregory, Els Fieremans, Jelle Veraart, Fang-Ming Deng, Andrew B. Rosenkrantz, and Dmitry S. Novikov. 2018. “Characterization of Prostate Microstructure Using Water Diffusion and NMR Relaxation.” Frontiers of Physics 6 (September). https://doi.org/10.3389/fphy.2018.00091.
Figures
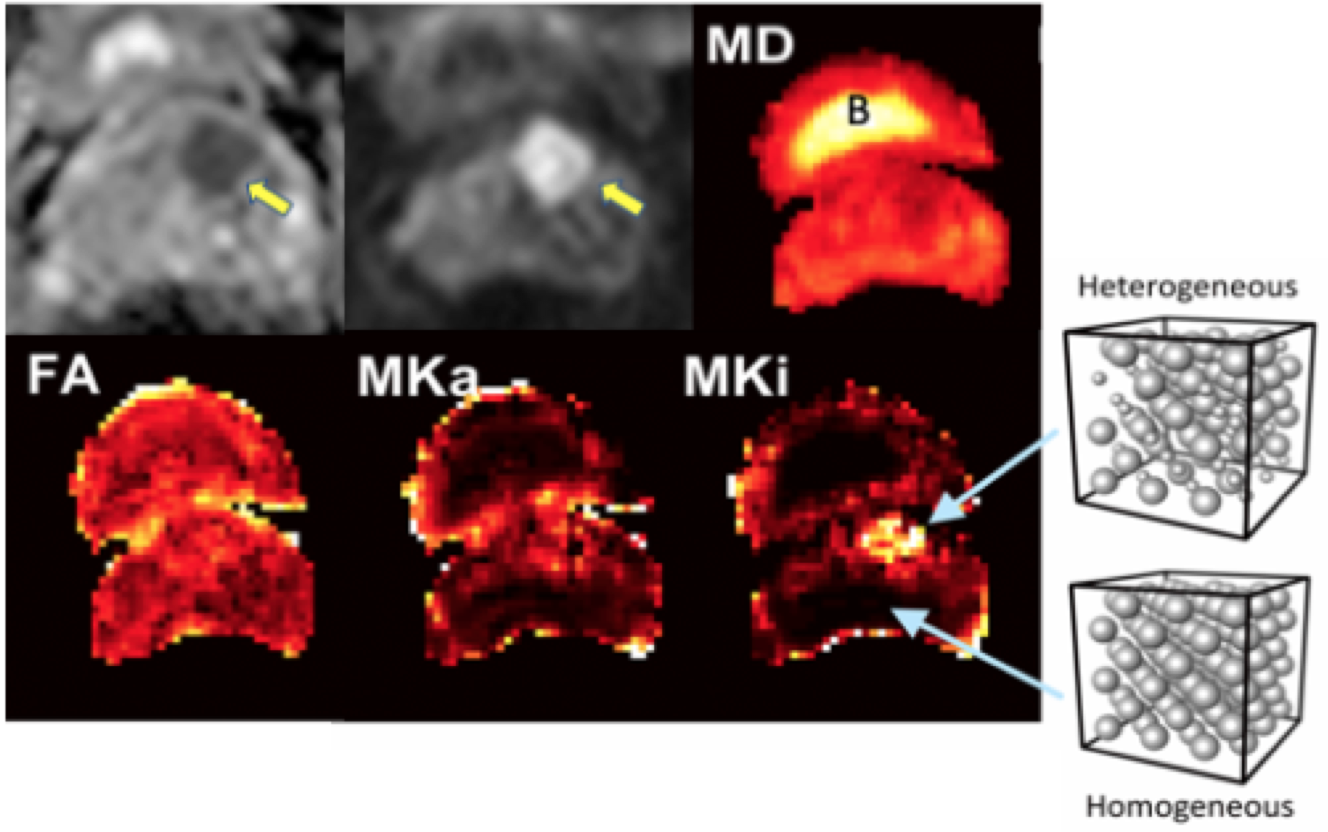
Axial parameter maps in bladder (see ‘B’ above) and prostate. Man, 66 years of age, abnormal PSA, GS 3+3 on TRUS BX. Top, from left to right, standard mpMRI: ADC, DWI, and Mean Diffusivity (MD). These maps show a well-defined mass suspicious for csPCa.These images demonstrate:
- Increased in tissue heterogeneity (Mki) and, to a lesser degree, an increase in microscopic anisotropy (Mka).
- QTI can disentangle microscopic anisotropy, orientation dispersion, and sub-voxel heterogeneity.
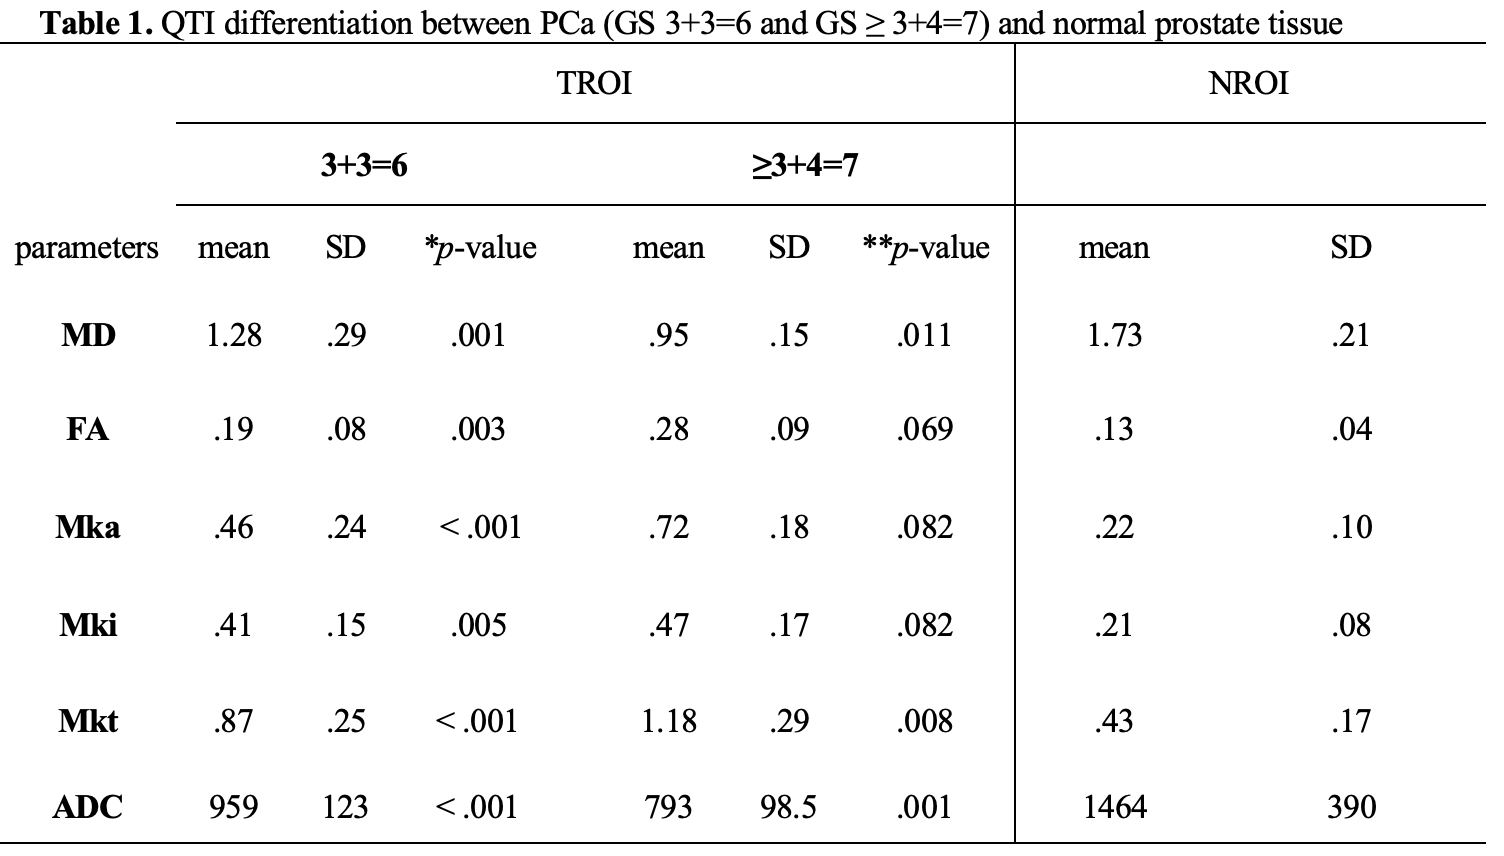
* p-value: two-tailed t-test between Gleason score 3+3=6 and NROI
**p-value: two-tailed t-test between Gleason score ≥ 3+4=7 and NROI
TROI: tumor regions of interest; NROI: normal regions of interest; MD: value in µm2/ms; ADC value in mm2/s

MD value in µm2/ms, ADC value in mm2/s