4773
Novel glioblastoma infiltration biomarker validation by histopathologic assessment of the relation between ADC and tumor cellularity1Centre for Clinical Brain Sciences, University of Edinburgh, Edinburgh, United Kingdom, 2Glasgow Experimental MRI Centre, Institute of Neuroscience and Psychology, University of Glasgow, Glasgow, United Kingdom, 3Wolfson Wohl Translational Cancer Research Center, Institute of Cancer Sciences, University of Glasgow, Glasgow, United Kingdom
Synopsis
This work quantitatively and qualitatively assesses the relation between tumor related cellularity variation and ADC values. We show that the ADC slope along linear profiles perpendicular to the boundary voxels of the ADC region of interest is a a biomarker of tumor infiltration beyond the contrast enhancing regions. We demonstrate the existence of a strong relation between ADC and tumor cellularity and show that a vectorial profile analysis of ADC maps could provide with a robust biomarker of glioblastoma cell infiltration.
Introduction
Glioblastoma (GBM) is the most common and aggressive primary brain tumor. Survival in patients receiving the current standard of care is less than a year after diagnosis. A major factor contributing to treatment failure is the ability of tumor cells to infiltrate normal brain regions[1], extending several centimeters from the tumor bulk edge. Infiltration compromises the ability to achieve complete surgical resection of the tumor, thereby contributing to high recurrence rates, and limitations in the ability to accurately image infiltration reduce the accuracy of target volume delineation for radiotherapy and hyper-resection planning. It is crucial to develop imaging modalities that enable better tumor delineation; particularly when considering marginal regions with low tumor cell density. Two recent meta-analysis studies identified a significant negative correlation between ADC and cellularity in a range of tumors[2, 3]. However, the in vivo complexity of biological tissues makes the quantitative assessment of the relationship between ADC and cellularity very challenging. Infiltrative realistic mouse models could allow to address this gap. We recently proposed a novel method aiming at quantitative histopathologic assessment of MRI methods with stacked in plane histology maps (SIH)[8].This approach taking into account both MRI slice orientation in the cutting and using multiple slices stacked to account for MRI slice thickess could provide with means to assess the relations between ADC and infiltration.This study aims to quantitatively and qualitatively analyze the correlation between ADC MRI and tumor cell density at the tumour margins, to assess whether local ADC could provide a useful biomarker of glioblastoma cell infiltration in and beyond the peritumoral edema region. This assessment is carried using in two distinctive methods. First a voxelwise analysis is used aiming at quantitatively assessing the overall relation between ADC and tumor cellularity. The use of SIH maps allowing each voxel to be considered as an individual sample, this approach boosts significantly the significance of the outcomes compared to biopsy studies allowing for robust, conclusive results to be prduced. Finally, the spatial correlation between ADC and tumor cellularity is evaluated in order to assess the clinical relevance of ADC as a potential biomarker for tumor cell density.
Materials and Methods
G7 GBM orthotopic xenografts were implanted into nude mice. T2W, and DTI data were acquired at 7T. Voxelwise comparison between MRI and histology was allowed by producing Stacked In-plane Histology maps (SIH) using a recently described method[8]: Brains were extracted and fresh-frozen to minimise fixation artefacts and preserve morphology. Cryosections were stained with human leucocyte antigen (HLA) marker specific for human-derived GBM cells. Confocal HLA photomicrographs (10x) and high resolution T2w MRI were linearly co-registered and resampled to match DWI. Macroscopic tumour margin was visually delineated using the low ADC/high-T2w-signal region. Linear profiles perpendicular to these boundary voxels produced serial, centrifugal, spatially-congruent measurements of ADC and HLA across the infiltrating edge over 0.7mm. Spearman’s rho was calculated in each subject for every profile.Results
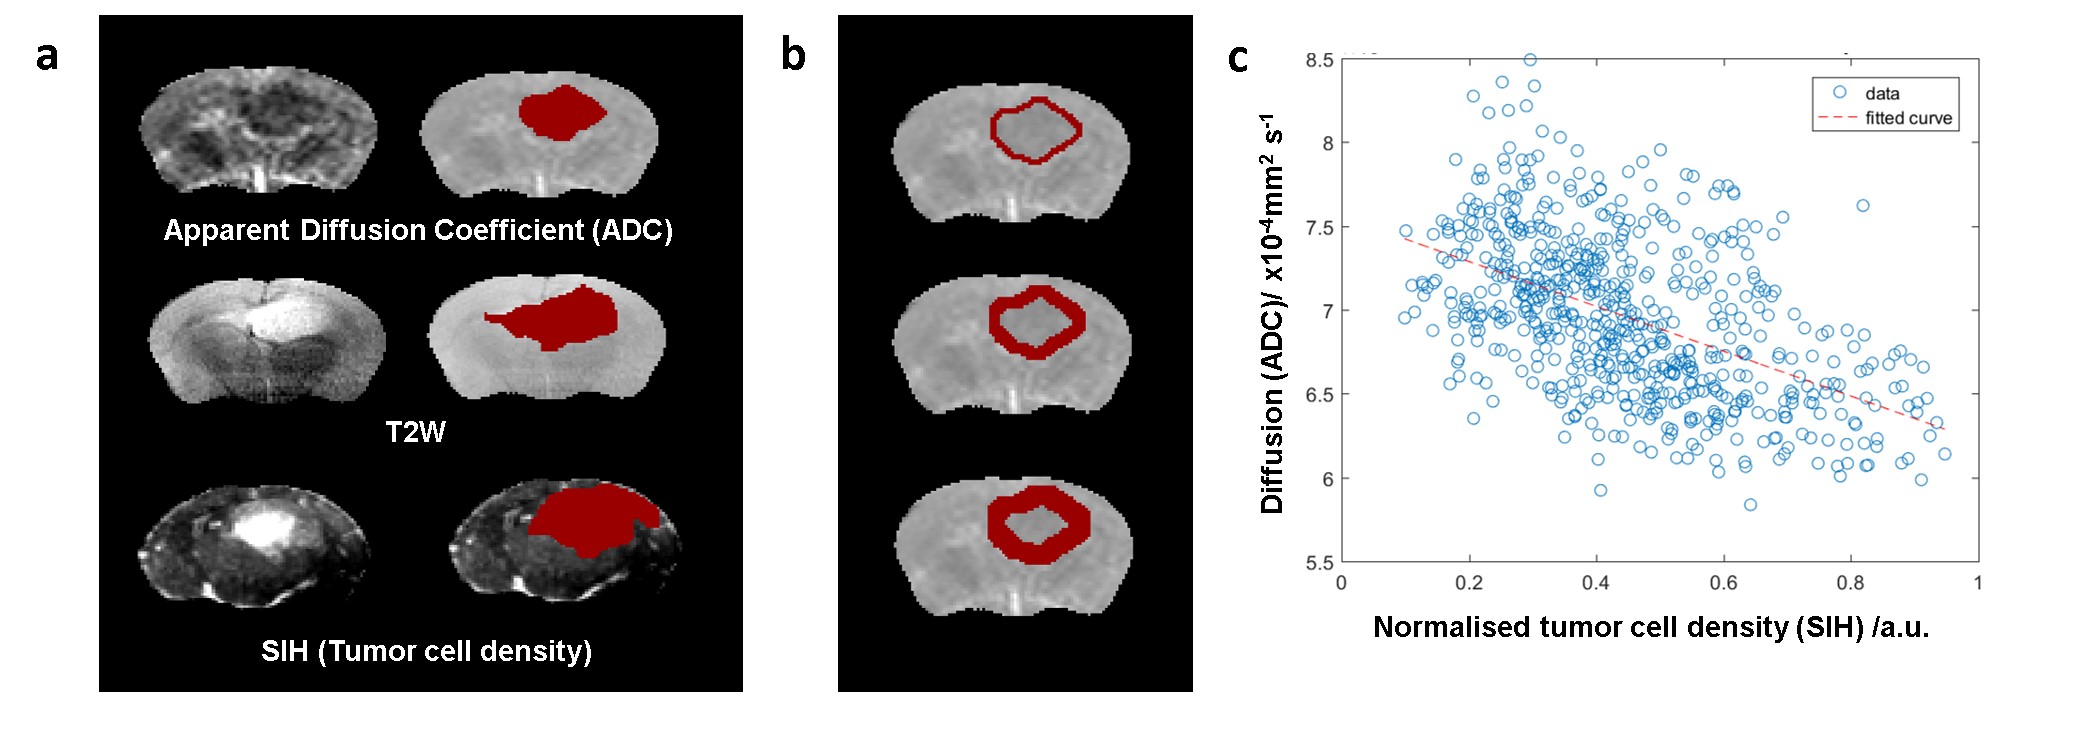
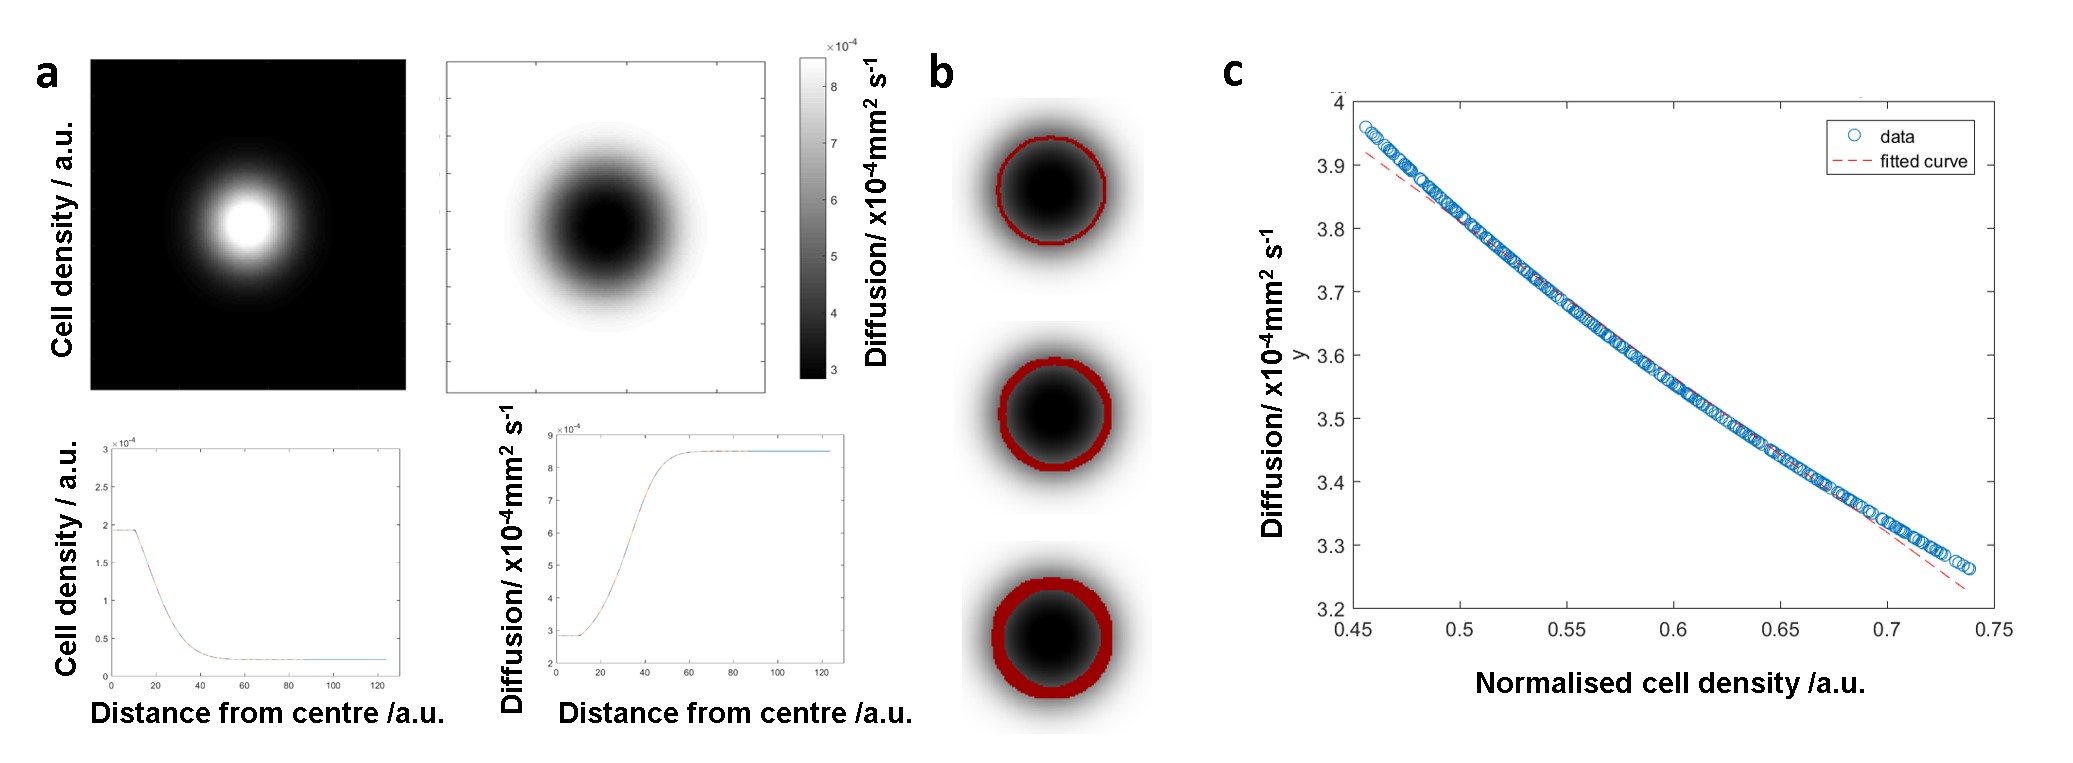
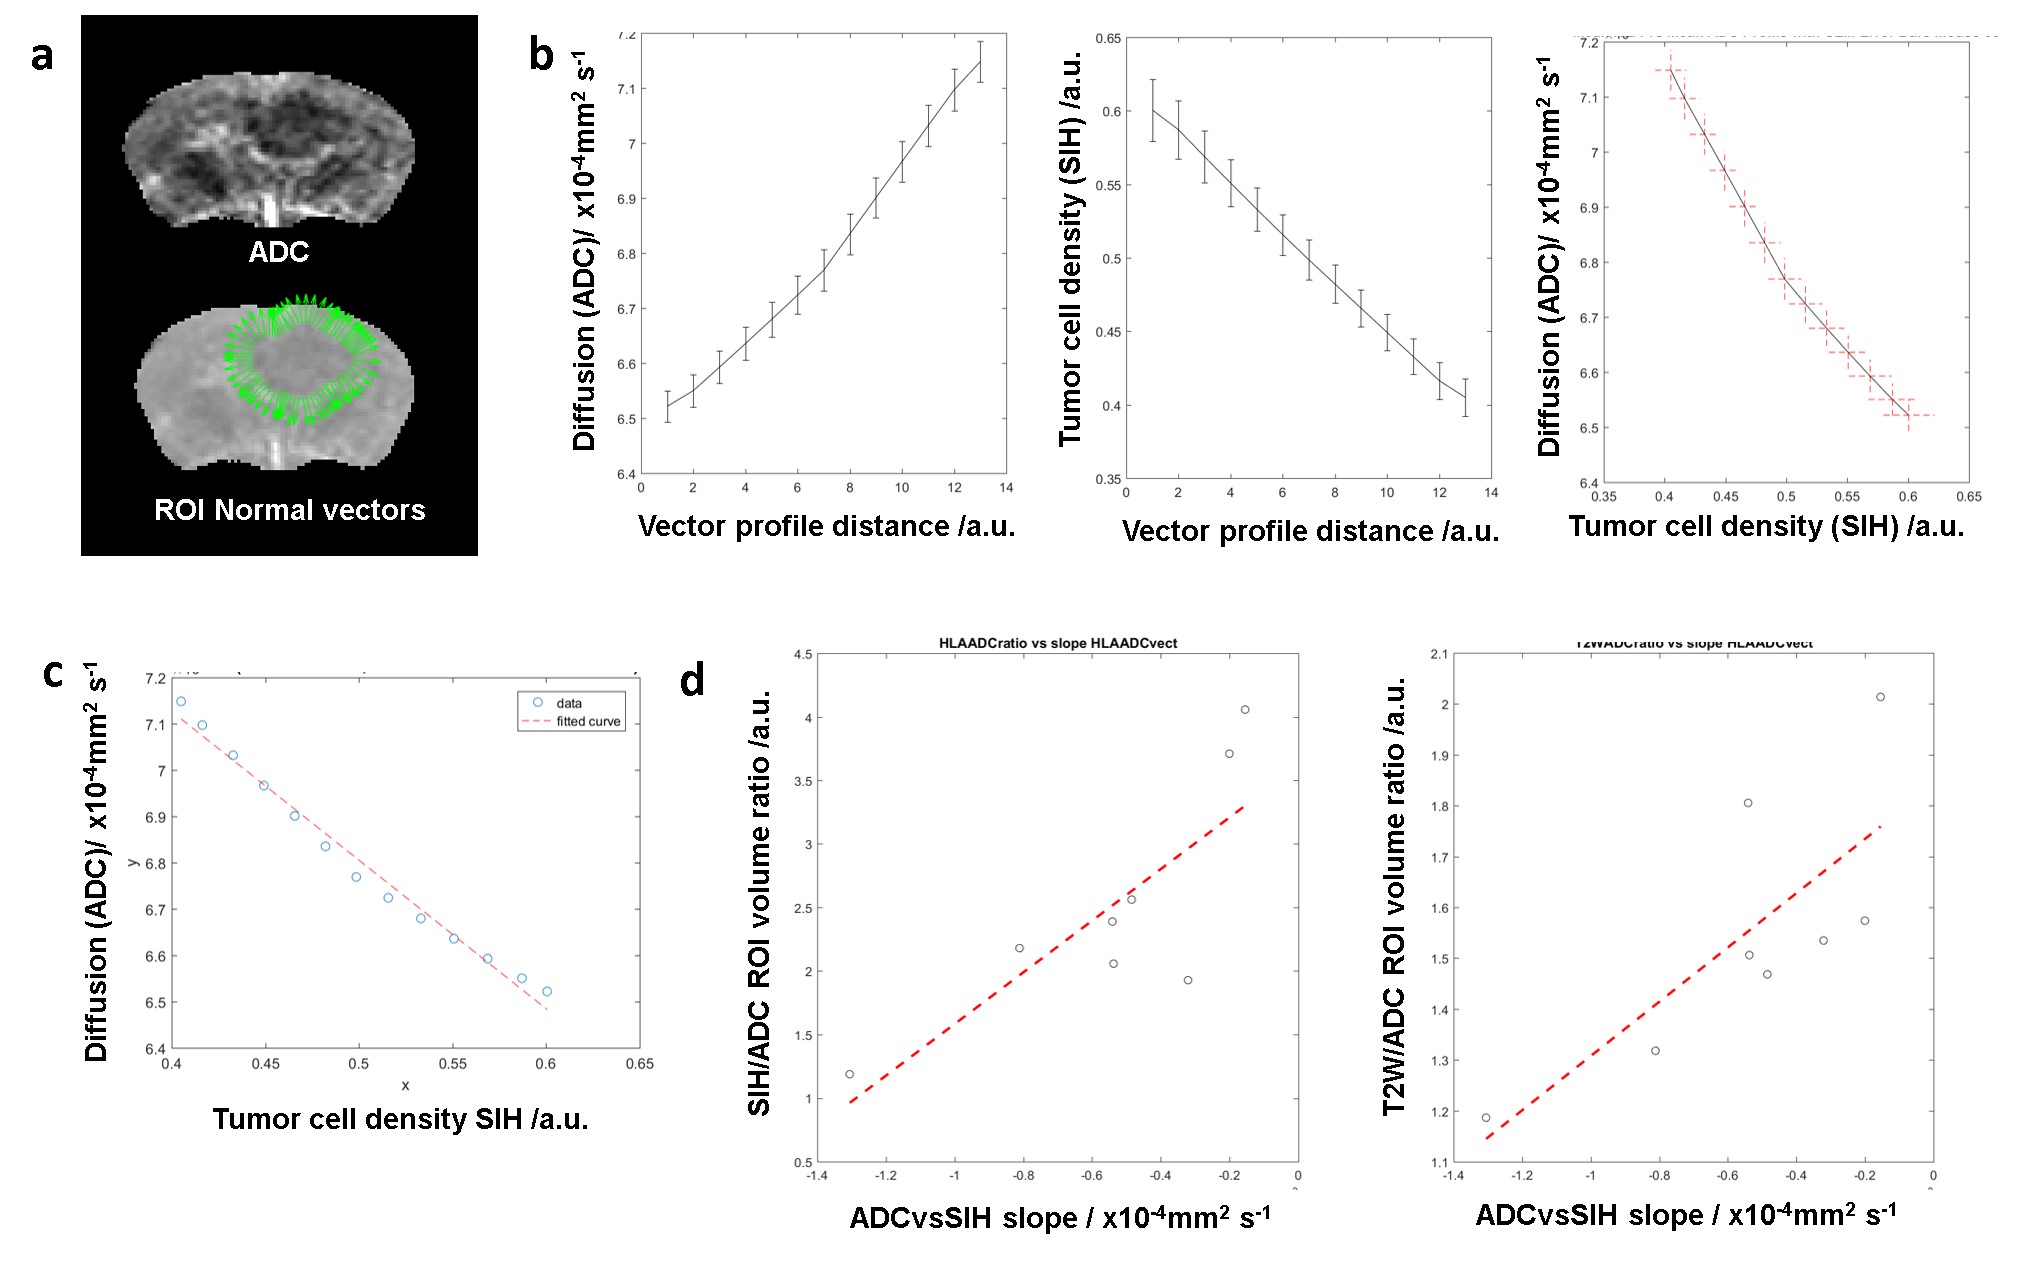
Voxelwise analysis of diffusion against cellularity in the peritumoral regions: Figure 1a shows ADC, T2W and SIH data (~Tumour cell density) and their manually selected regions of interest (ROIs). For different thickness ROIs around the ADC ROI (Fig.1b) a voxelwise comparison between ADC coefficient and tumour cell density was performed. A model based on a gaussian tumor cell density allowed to produce diffusion maps using Grahams diffusion equation (Fig.2a). Similarly to in vivo data, increased thickness ROIs were produced along the edges of the ADC ROI (Fig.2b). The plot of diffusion against cell density (Fig.2b) reproduced the decay observed in the in vivo data (Fig.2c).Spatial correlation between ADC and glioblastoma cell infiltration: Vectorial analysis of the relation between diffusion and tumor cellularity was performed for increasing cellular infiltration by increasing the Gaussian model standard deviation (Fig.3a). The results suggested a linear correlation between the diffusion slope and the cell infiltration ratio (Fig.3b-c).
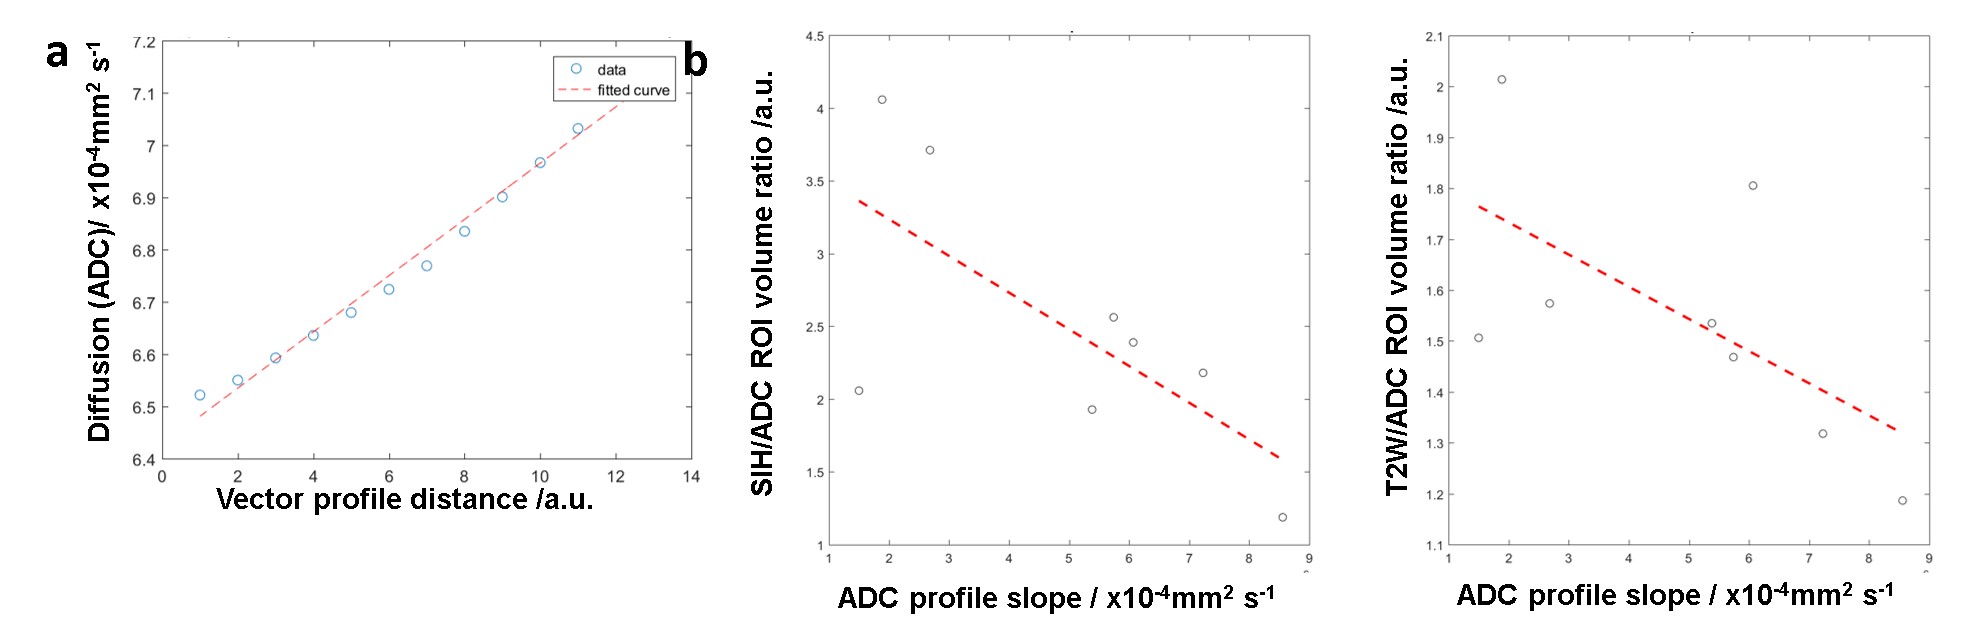
Marginal ADC slope as a novel biomarker of glioblastoma cell infiltration: Vectorial analysis was also performed on the mice data (Fig.4a-c) and showed the same correlation between tumor infiltration ratios measured as SIH/ADC or SIH/T2W ROI size ratios (Fig.4d). Here, a stronger negative slope corresponds to a less infiltrative tumour margin. Finally, to evaluate the ability of this method to provide with a robust infiltration biomarker, ADC slope alone analysis was performed showing the same significant correlation with tumour cell infiltration (Fig.5). An increasing ADC slope corresponds to a less infiltrative margin.
Discussion
This work demonstrated a strong voxelwise relationship between tumor cell infiltration and ADC and showed how a vectorial profile analysis of ADC maps could provide with a robust and clinically relevant biomarker of glioblastoma cell infiltration into the peritumoral region. Further work will focus on the production of probabilistic tumor infiltration maps using the ADC slope obtained on individual profiles.Acknowledgements
No acknowledgement found.References
[1] S.J. Price, J.H. Gillard, Imaging biomarkers of brain tumour margin and tumour invasion, Brit J Radiol, 84 (2011) S159-S167. [2] L.H. Chen, M. Liu, J. Bao, Y.B. Xia, J.Q. Zhang, L. Zhang, X.Q. Huang, J. Wang, The Correlation between Apparent Diffusion Coefficient and Tumor Cellularity in Patients: A Meta-Analysis, Plos One, 8 (2013). [3] A. Surov, H.J. Meyer, A. Wienke, Correlation between apparent diffusion coefficient (ADC) and cellularity is different in several tumors: a meta-analysis, Oncotarget, 8 (2017) 59492-59499. [4] H.F.I. Al-Mubarak, A. Vallatos, L. Galllagher, J.L. Birch, L. Gilmour, J. Foster, A.J. Chalmers, W.M. Holmes, Stacked in-plane histology for quantitative validation of imaging biomarkers: Application to an infiltrative brain tumour model, J Neurosci Methods, 326 (2019).
Figures