4772
Reducing scan time of routine prostate diffusion-weighted imaging using random matrix theory reconstruction1Radiology, New York University School of Medicine, New York, NY, United States, 2Microstructure Imaging INC, New York, NY, United States, 3Department of Medical Physics, Memorial Sloan Kettering Cancer Center, New York, NY, United States, 4Radiology, Memorial Sloan Kettering Cancer Center, New York, NY, United States
Synopsis
We propose Random Matrix Theory (RMT) reconstruction to reduce the scan time of prostate diffusion (DWI) by using fewer averages and still maintain image quality. RMT leverages the joint redundancy across receiver coils, voxels, and measurements to identify and remove the universal noise-only Marchenko-Pastur distribution. We find that RMT can dramatically increase the SNR of the prostate protocol, where the coefficient of variation of the RMT reconstruction for 1 average is lower than the conventional reconstruction of 14 averages. Thereby, RMT allows to reduce scan time by over 5-fold with comparable image quality.
Introduction
The American Cancer Society estimates that 1 in 9 men will be diagnosed with prostate cancer in their lifetime1; however the five-year relative survival rate1 is 98%, indicating the indolent nature of most cases. Hence, non-invasive MRI-based characterization of prostate lesions to guide decisions regarding surveillance and suspicion/progression through active surveillance2,3,4 have become widely used. However, the prostate diffusion weighted imaging (DWI) acquisition, a critical sequence in clinical prostate MRI assessment, is notoriously noisy, so much so that extreme measures such as excessive data in-line averaging (≥10 averages for b=1000 s/mm2) are common practice. With the increasing demand of active surveillance and prostate imaging, it is necessary to maximize the efficiency of the prostate DWI acquisition.Here we perform random matrix theory (RMT) reconstruction5 to increase SNR (Fig.1,2). RMT is a recently developed approach that leverages the joint redundancy across receiver coils and measurements, to remove noise from all images at once with high accuracy5. We evaluate the efficacy of the RMT in 7 prostate cancer patients, and show that approximately 5-times shorter exams (with fewer in-line averages) can be used, while preserving or even enhancing image quality of clinical prostate DWI.
Methods
7 Patients with PI-RADS 4-5 lesions underwent multi-parametric prostate MRI on a 3T scanner (GE Healthcare DiscoveryTM MR750, Waukesha, WI) with an 8-channel pelvic surface array coil. EPI-based DWI was acquired in 3 non-collinear gradient directions for b=50 s/mm2 and b=1000 s/mm2, with 2 and 12-14 averages, respectively. Other imaging parameters include TR=8s, TE=53.9 ms, bandwidth=1953.12 Hz/pixel, voxel size=1.375x1.375x4 mm3, FOV=220x110x108 mm3, partial Fourier=5/8 filled with POCS. Coil images were combined via adaptive combination6. In-line data averaging for both standard and RMT images was performed after PCA-based phase estimation5,7.The acquisition was subsampled during the reconstruction to study DWI image quality of shorter acquisitions, by removing averages of b=1000 s/mm2 from 14 down to 1. As RMT performs better with more data due to redundancy, for a fair quality assessment we used RMT only on the averages that were actually included each time.
RMT starts from a rank-3 measurement matrix $$$\cal{X}_{cmx}$$$ that includes all coils, measurements (diffusion directions and b-values), and voxels in a local patch, such that its size is $$$N_c\times N_m\times N_x$$$. Here, $$$N_x$$$ is given by a local 3x3x3 spatial patch, $$$N_c=8$$$ coils, while $$$N_m$$$ depends on the number of averages, ranging between 9 and 48. We then reshape$$$\,\cal{X}\,$$$into a rank-2$$$\,M\times N\,$$$matrix$$$\,X\,$$$in a way that makes it approximately square, $$$M\lesssim N$$$. Next, we form the covariance matrix $$$C=XX'/N$$$ and identify5 the pure-noise distribution in the histogram of its eigenvalues. We then nullify the pure-noise eigenvalues of$$$\,X\,$$$, reshape it back to $$$\cal{X}$$$ and proceed with regular MRI reconstruction steps.
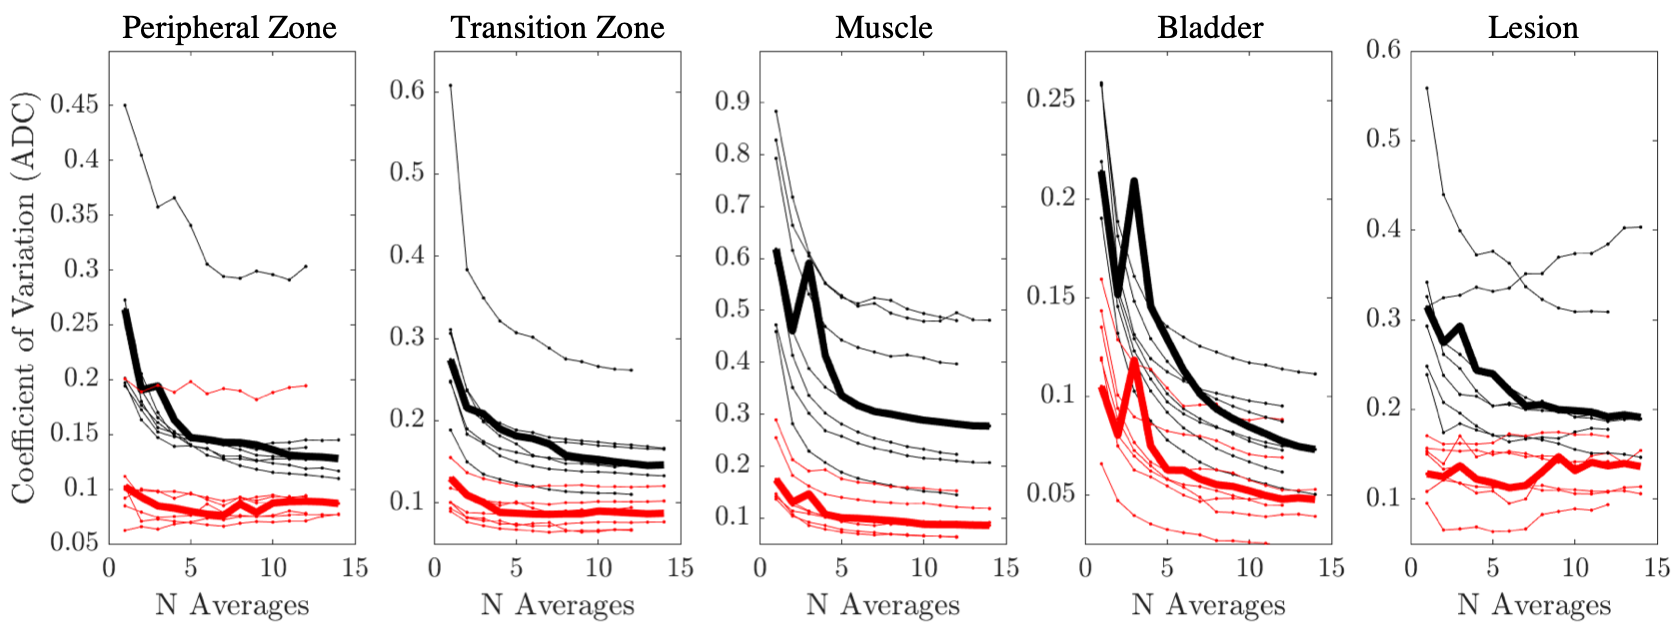
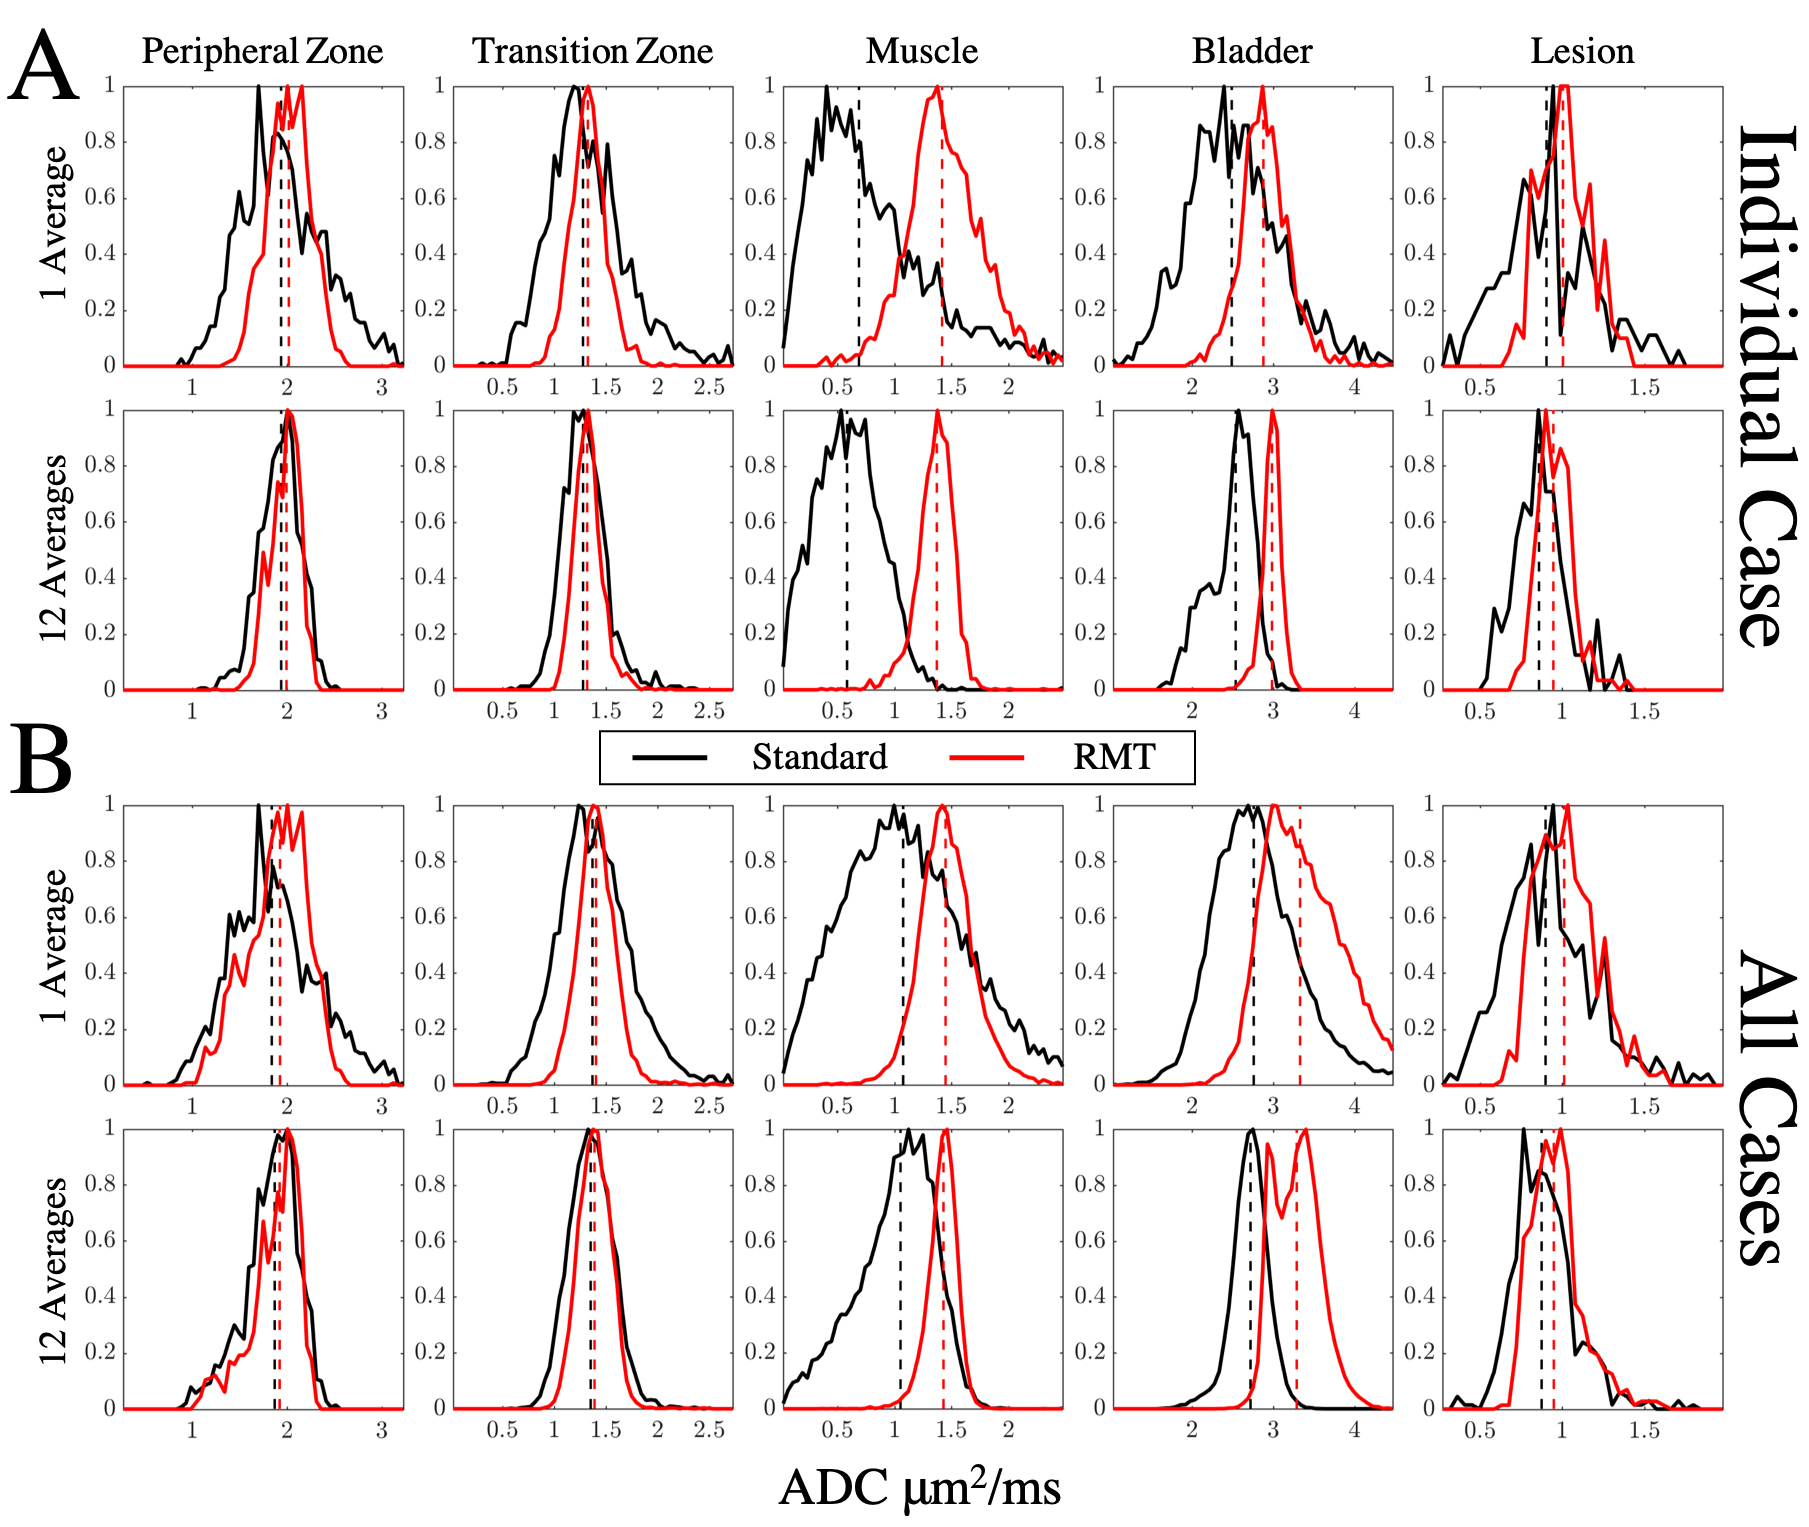
Following standard and RMT reconstructions with different degrees of in-line averaging, ADC was calculated from 6 images [3 b = 50 and 3 b = 1000 s/mm2] via weighted linear least-squares8. DWI trace images and calculated high b-values9 were processed for b=50,1000,1500, and 2500s/mm2[Fig 1]. ROIs were drawn for benign peripheral zone, transition zone, muscle, bladder, and PI-RADS≥4 lesions. The measurement precision was then evaluated via the coefficient of variation (CoV=standard deviation/mean over ROI) [Fig. 3], and histogram analysis [Fig 4].
Results & Discussion
Our main outcome is that the application of RMT reconstruction to prostate imaging can dramatically increase the SNR of clinical prostate examinations, by removing noise without removing prostate anatomy [Fig 1,2]. There was a consistent decrease in CoV, following RMT for all cases [Fig.3].We found that the state-of-the-art DWI protocol was well optimized for prostate anatomy, as peripheral zone, transition zone, and lesion ROIs CoV approaches a plateau around 14 averages (indicating that variance was largely due to biological variability) [Fig 3]. However, RMT consistently lowered the CoV for all ROIs and lowered the Rician noise bias at b=1000 s/mm2. The effect of Rician noise bias at b=1000 s/mm2 is further illustrated in Fig.4, as ADC distributions shift towards larger values with RMT (and the bladder shifts towards 3.0, consistent with water at body temperature).
Our image quality assessment, as well as CoV and histogram analysis overall show that using just 1 average with RMT reconstruction, instead of 14 inline averages at b=1000 s/mm2 with standard reconstruction, preserves or even enhances the image quality and ADC precision. This implies a 48/9=5.3x scan time reduction for comparable image quality, and the same or higher precision as quantified by CoV, due to RMT reconstruction.
With the higher SNR, RMT enables to (1) dramatically reduce scan time of the prostate DWI acquisitions, (2) spend the increased SNR to explore the parameter space (higher resolution, high b-value, high TE), and potentially offer prostate imaging at lower field strengths. A limitation of our acquisition was the large slice thickness (4 mm), which reduced the spatial redundancy of RMT reconstruction; as well as through-plane motion, cf. the outlier with high CoV [Fig.3].
Conclusion
- RMT offers the benefits of in-line data averaging for prostate imaging without the added scan time; total scan time reduction is over 5x.
- The saved time can be used to include additional b-values, echo times, and diffusion
times to enable prostate modeling10-13 approaches in a
clinical setting.
Acknowledgements
This work was supported by R01 EB027075 (NIBIB) and by the Center of Advanced Imaging Innovation and Research (CAI2R, www.cai2r.net), a NIBIB Biomedical Technology Resource Center: P41 EB07183.References
1. Cancer Facts & Figures. American Cancer Society 2018;https://www.cancer.org/cancer/prostate-cancer/about/key-statistics.html.
2. Klotz L. Active surveillance for prostate cancer: a review. Curr Urol Rep 2010;11:165-71.
3. Klotz L, Zhang L, Lam A, Nam R, Mamedov A, Loblaw A. Clinical results of long-term follow-up of a large, active surveillance cohort with localized prostate cancer. J Clin Oncol 2010;28:126-31.
4. Weinreb JC, Barentsz JO, Choyke PL, et al. PI-RADS Prostate Imaging – Reporting and Data System: 2015, Version 2. European Urology 2016;69:16-40.
5. Lemberskiy G, Baete S, Veraart J, Shepherd TM, Fieremans E, Novikov DS. Achieving sub-mm clinical diffusion MRI resolution by removing noise during reconstruction using random matrix theory. In Proceedings of the 27th Scientific Meeting of ISMRM, p.770, Montreal, Canada, 2019.
6. Walsh DO, Gmitro AF, Marcellin MW. Adaptive reconstruction of phased array MR imagery. Magn Reson Med 2000;43:682-90.
7. Kordbacheh H, Seethamraju RT, Weiland E, et al. Image quality and diagnostic accuracy of complex-averaged high b value images in diffusion-weighted MRI of prostate cancer. Abdominal Radiology 2019;44:2244-53.
8. Veraart J, Sijbers J, Sunaert S, Leemans A, Jeurissen B. Weighted linear least squares estimation of diffusion MRI parameters: strengths, limitations, and pitfalls. Neuroimage 2013;81:335-46.
9. Grant KB, Agarwal HK, Shih JH, et al. Comparison of calculated and acquired high b value diffusion-weighted imaging in prostate cancer. Abdominal Imaging 2015;40:578-86.
10. Panagiotaki E, Chan RW, Dikaios N, et al. Microstructural characterization of normal and malignant human prostate tissue with vascular, extracellular, and restricted diffusion for cytometry in tumours magnetic resonance imaging. Invest Radiol 2015;50:218-27.
11. Chatterjee A, Bourne RM, Wang S, et al. Diagnosis of Prostate Cancer with Noninvasive Estimation of Prostate Tissue Composition by Using Hybrid Multidimensional MR Imaging: A Feasibility Study. Radiology 2018;287:864-73.
12. Brunsing RL, Schenker-Ahmed NM, White NS, et al. Restriction spectrum imaging: An evolving imaging biomarker in prostate MRI. J Magn Reson Imaging 2017;45:323-36.
13. Lemberskiy G, Fieremans E, Veraart J, Deng F-M, Rosenkrantz AB, Novikov DS. Characterization of Prostate Microstructure Using Water Diffusion and NMR Relaxation. Frontiers in Physics 2018;6:91.
Figures
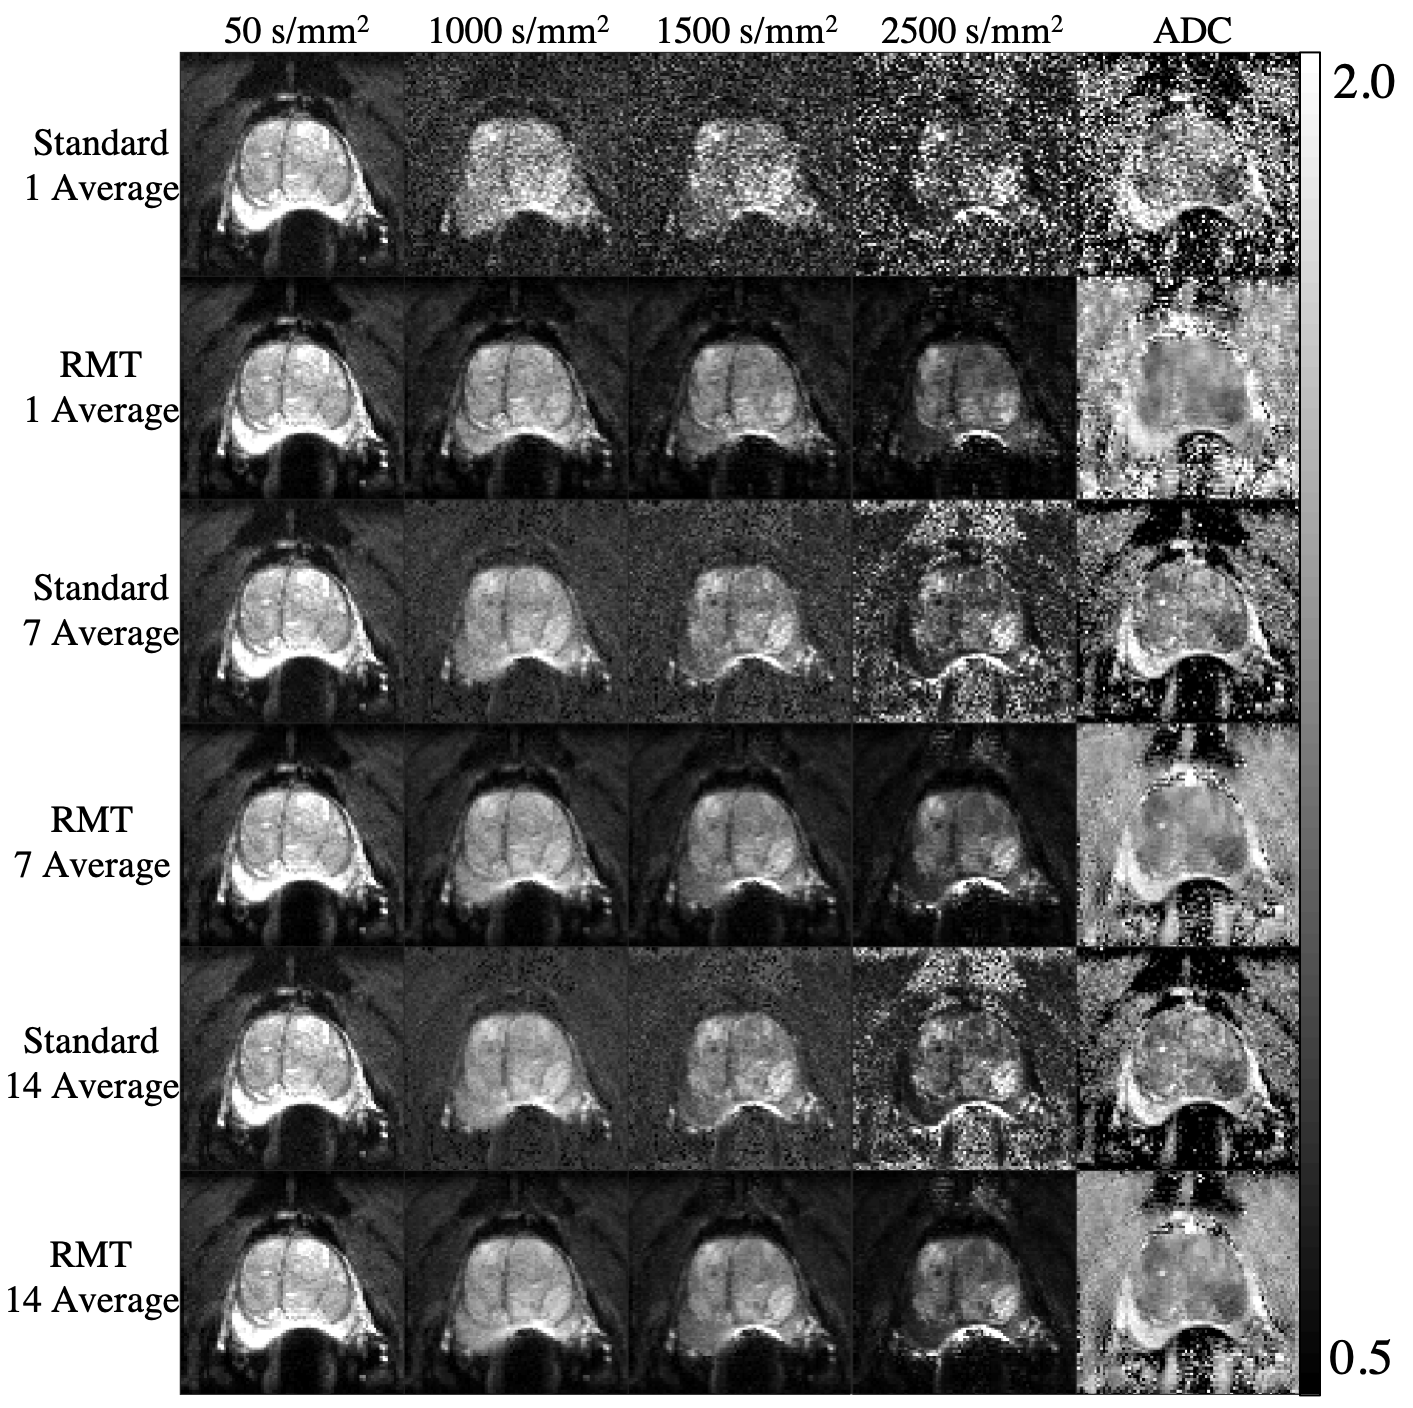
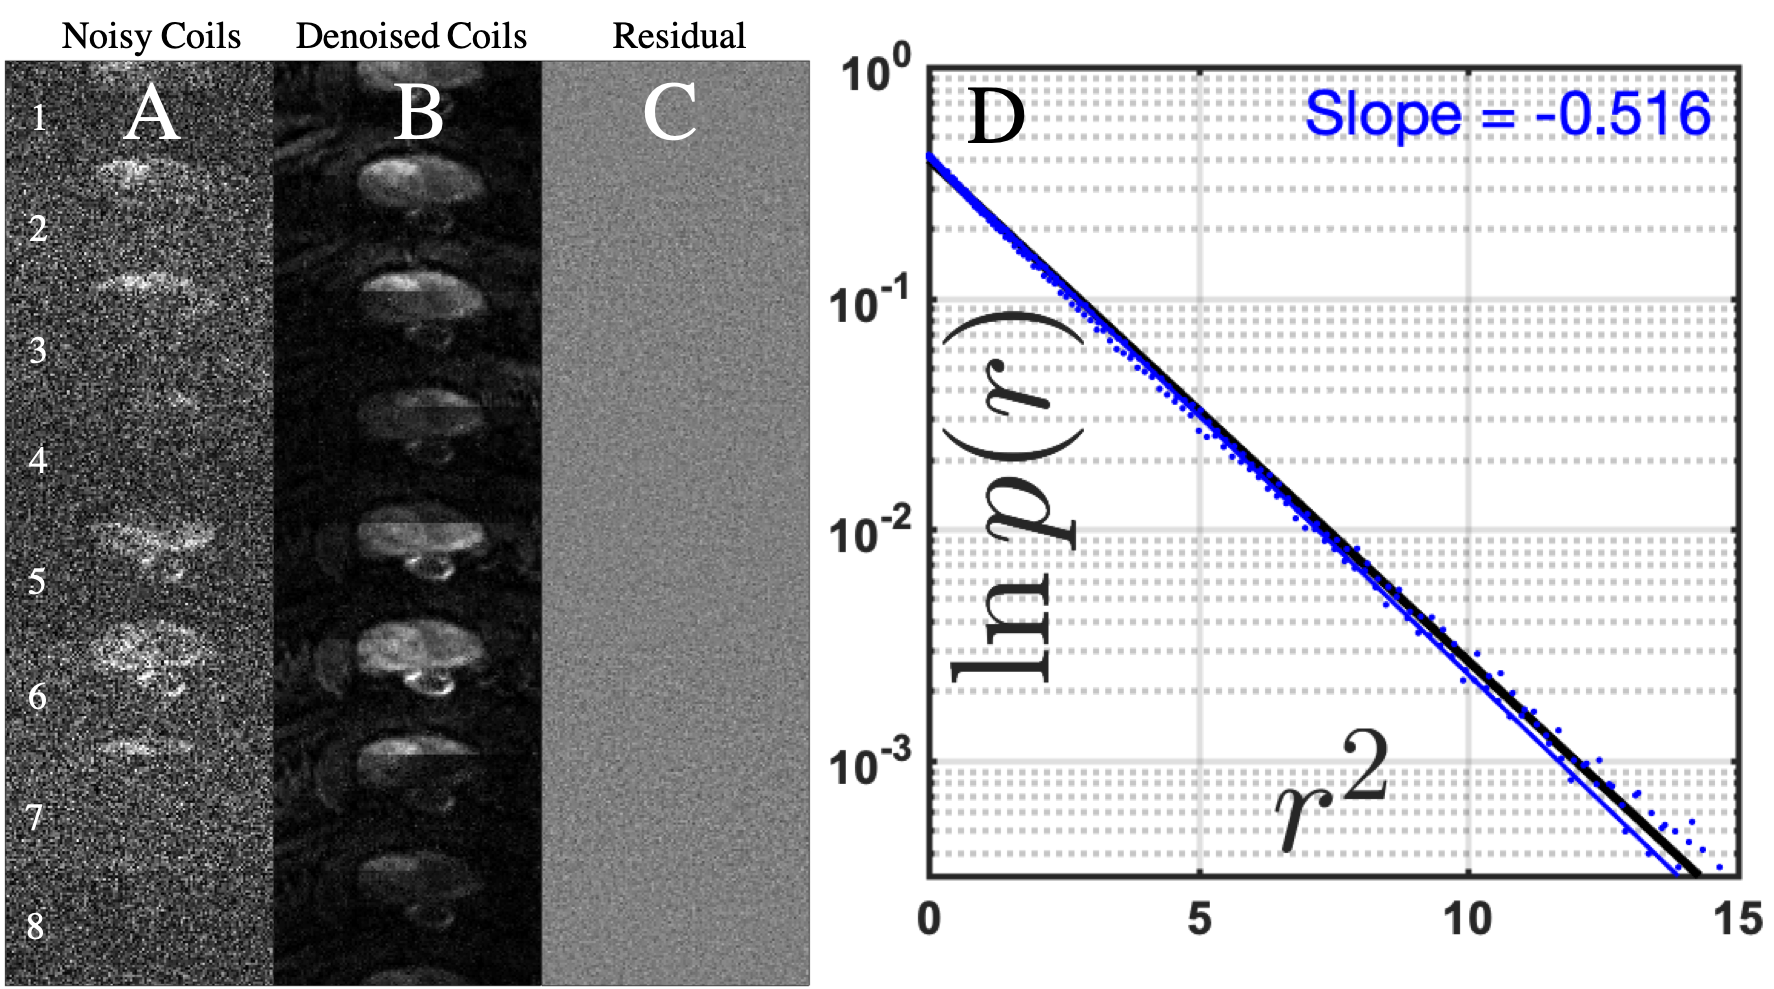
Figure 2: Residuals after RMT denoising/reconstruction. 8 coil images at b = 1000 (note the hypointense PIRADS 5 lesion) are shown (A) before and (B) after the RMT denoising step. The maps of (C) the normalized residuals show pure noise, i.e., no anatomy has been removed. (D) The histogram of normalized residuals with blue dots, perfectly agrees with the unit-Gaussian distribution, $$$p(r)\sim e^{-r^2/2}$$$ (black line, note the semi-log scale vs $$$r^2$$$), down to ~4 standard deviations in the tail of the Gaussian --- again demonstrating that no anatomy has been removed.