4771
Verifying the feasibility of automatic no-reference image quality metrics in evaluation the image quality of abdominal iSim at 3T1National Cancer Center/Cancer Hospital, Chinese Academy of Medical Science and Peking Union Medical College, BeiJing, China, 2MR Scientfic marketing Siemens Healthcare, BeiJing, China, 3MR Application Siemens Healthcare, BeiJing, China, 4HC DI MR DL ONCO,Siemens Healthcare GmbH, BeiJing, China
Synopsis
This experiment proposed an automatic image quality evaluation method using no-reference image quality metrics of structural similarity index (SSIM), blind/referenceless image spatial quality evaluator (BRISQUE), perception based Image quality evaluator (PIQE) , SNR Wavelet and Contrast. The SNR Wavelet was calculated by the quotient of the image before wavelet filtering and the difference between the image before wavelet filtering and the image after wavelet filtering. The contrast was calculated using the average signal difference of three to five gray bars in the middle position. This study showed the automatic no-reference image quality metrics have potential in future in evaluation the image quality of abdominal DWI at 3T with a higher efficiency.
Introduction
Diffusion-weighted imaging (DWI) is a well-established magnetic resonance imaging (MRI) method in oncological examinations, especially for early diagnosis of hepatocellular carcinoma (HCC). However, the image of abdominal DWI is prone to motion artifacts, respiration interference and poor shimming of magnetic fields. Image quality is closely related to the acquisition techniques, and different acquisition mode and fat saturation techniques have different abilities of inhibiting fat artifacts, motion artifacts, imaging blurring et al. All these artifacts limit its diagnostic value, especially in differential diagnosis and therapeutic effect evaluation of HCC. It is very important to evaluate image quality accurately and objectively, but in clinical situations evaluation of image quality often depends on manual measurement, which is very time-consuming, so how to evaluate image quality automatically through objective and comparable indicators is very important. The purpose of this study was to verify the feasibility of automatic no-reference image quality metrics in evaluation the image quality of abdominal DWI at 3T through a comparison among iShim sequence at respiratory triggering mode with and without CFS, iShim at a free-breathing mode, and the ss-EPI sequence.Methods
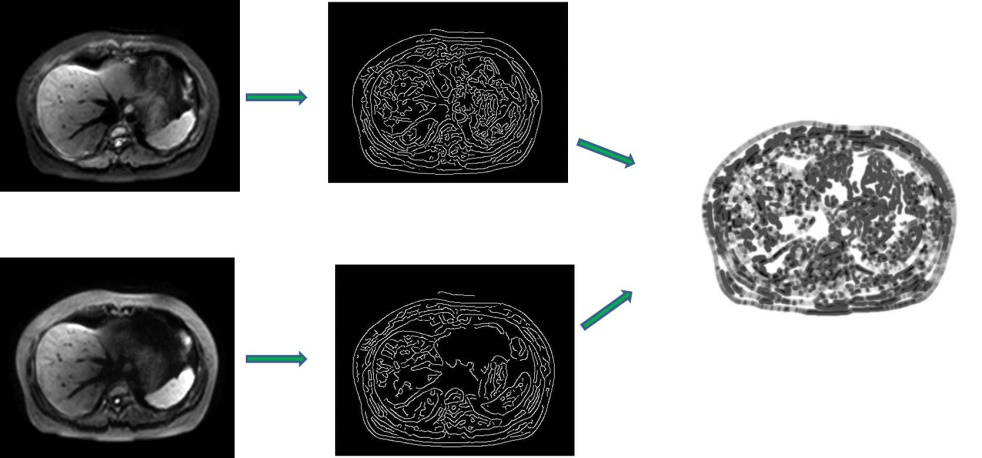
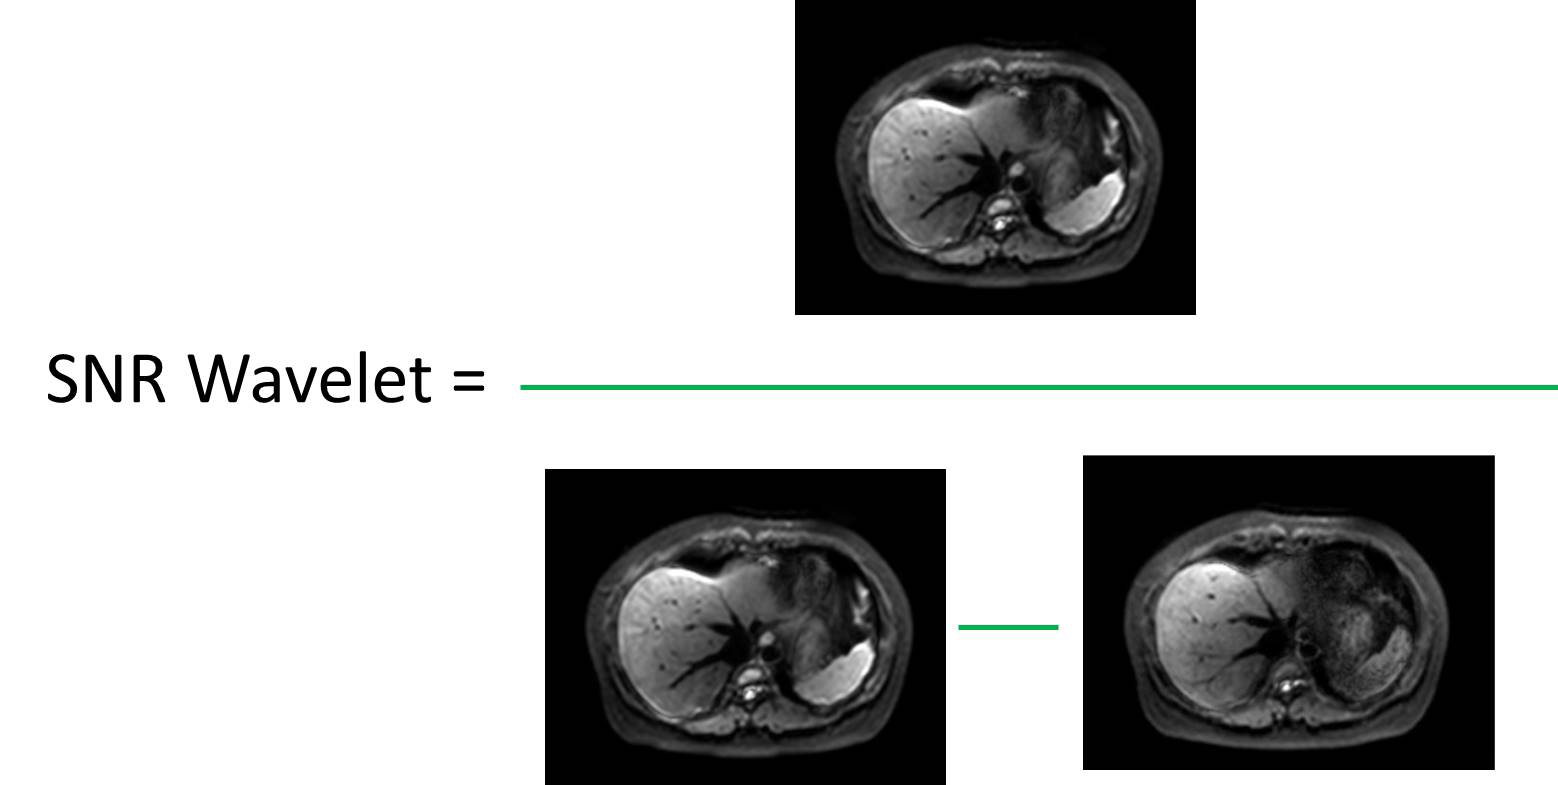
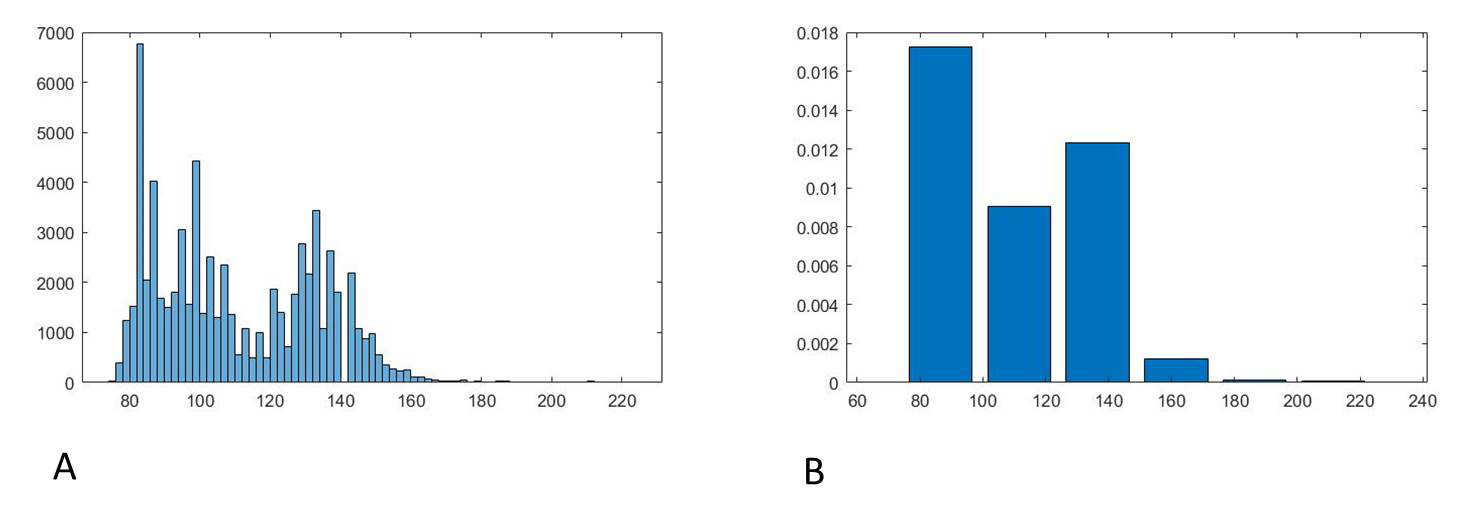
This study was approved by the institutional ethics committee and written informed consent was obtained from all patients (4 female,7 male; mean age, 56.8 years), who suspected hepatocellular carcinoma (HCC), were enrolled in this study. All patients underwent the T2W imaging and DWI examining using a single shot echo planar imaging (ss-EPI) sequence and a prototype iShim sequence at respiratory triggering mode with and without continuous fat suppression (CFS) technique and a free-breathing mode on a 3T MR scanner (MAGNETOM Prisma, Siemens Healthcare, Erlangen, Germany). First, the whole image quality was evaluated by automatic no-reference image quality metrics of structural similarity index (SSIM) [1], blind/referenceless image spatial quality evaluator (BRISQUE) [2], perception based Image quality evaluator (PIQE) no-reference image quality score [3]. The SNR Wavelet was calculated by the quotient of the image before wavelet filtering and the difference between the image before wavelet filtering and the image after wavelet filtering (Figure 2). To calculate Contrast, the gray histogram distribution of the image is calculated, and then the histogram is discretized. The Contrast was calculated using the average signal difference of three to five gray bars in the middle position. All these processes were done by using an in-house developed software program using MATLAB (Mathworks, Natick, Mass). After that the images of b-value at 1000 s/mm² and the acquired ADC maps were evaluated. The subjective image quality of HCC was rated based on a 5-point scale by two radiologists with more than 10 years’ experience: 5 = excellent (Anatomical details were clear, no artifacts were noticed in the image and lesions were clear showed); 4 = good (the image suffered from only a small amount of magnetic sensitivity or motion artifacts but were clear anatomical details shown; 3 = moderate (the image was less blur or magnetic sensitive artifacts;2=poor(the image was more artifacts); 1 = very poor(the image was not able to show lesions and diagnose). To decrease measuring errors, in objective quantitative analysis of image quality, different regions of interest (ROIs) were manually drawn on the slice of T2W images with a maximum diameter of lesions, and then all ROIs were copied on the same slice in DW images. The signal intensity of left, right liver lobes and the lesions were measured and the standard deviation (SD) of spleen was recorded as the noise of the images. The objective quantitative parameters of signal-to-noise (SNR),contrast-to-noise(CNR)were calculated and the ADC of left、right liver lobe and lesion were measured and analyzed. The subjective evaluation scores were compared using Friedman test. Univariate analysis of variance or Friedman test was applied for analyzing CNR, SNR and ADC values. P<0.05 was considered as statistically significant.Results
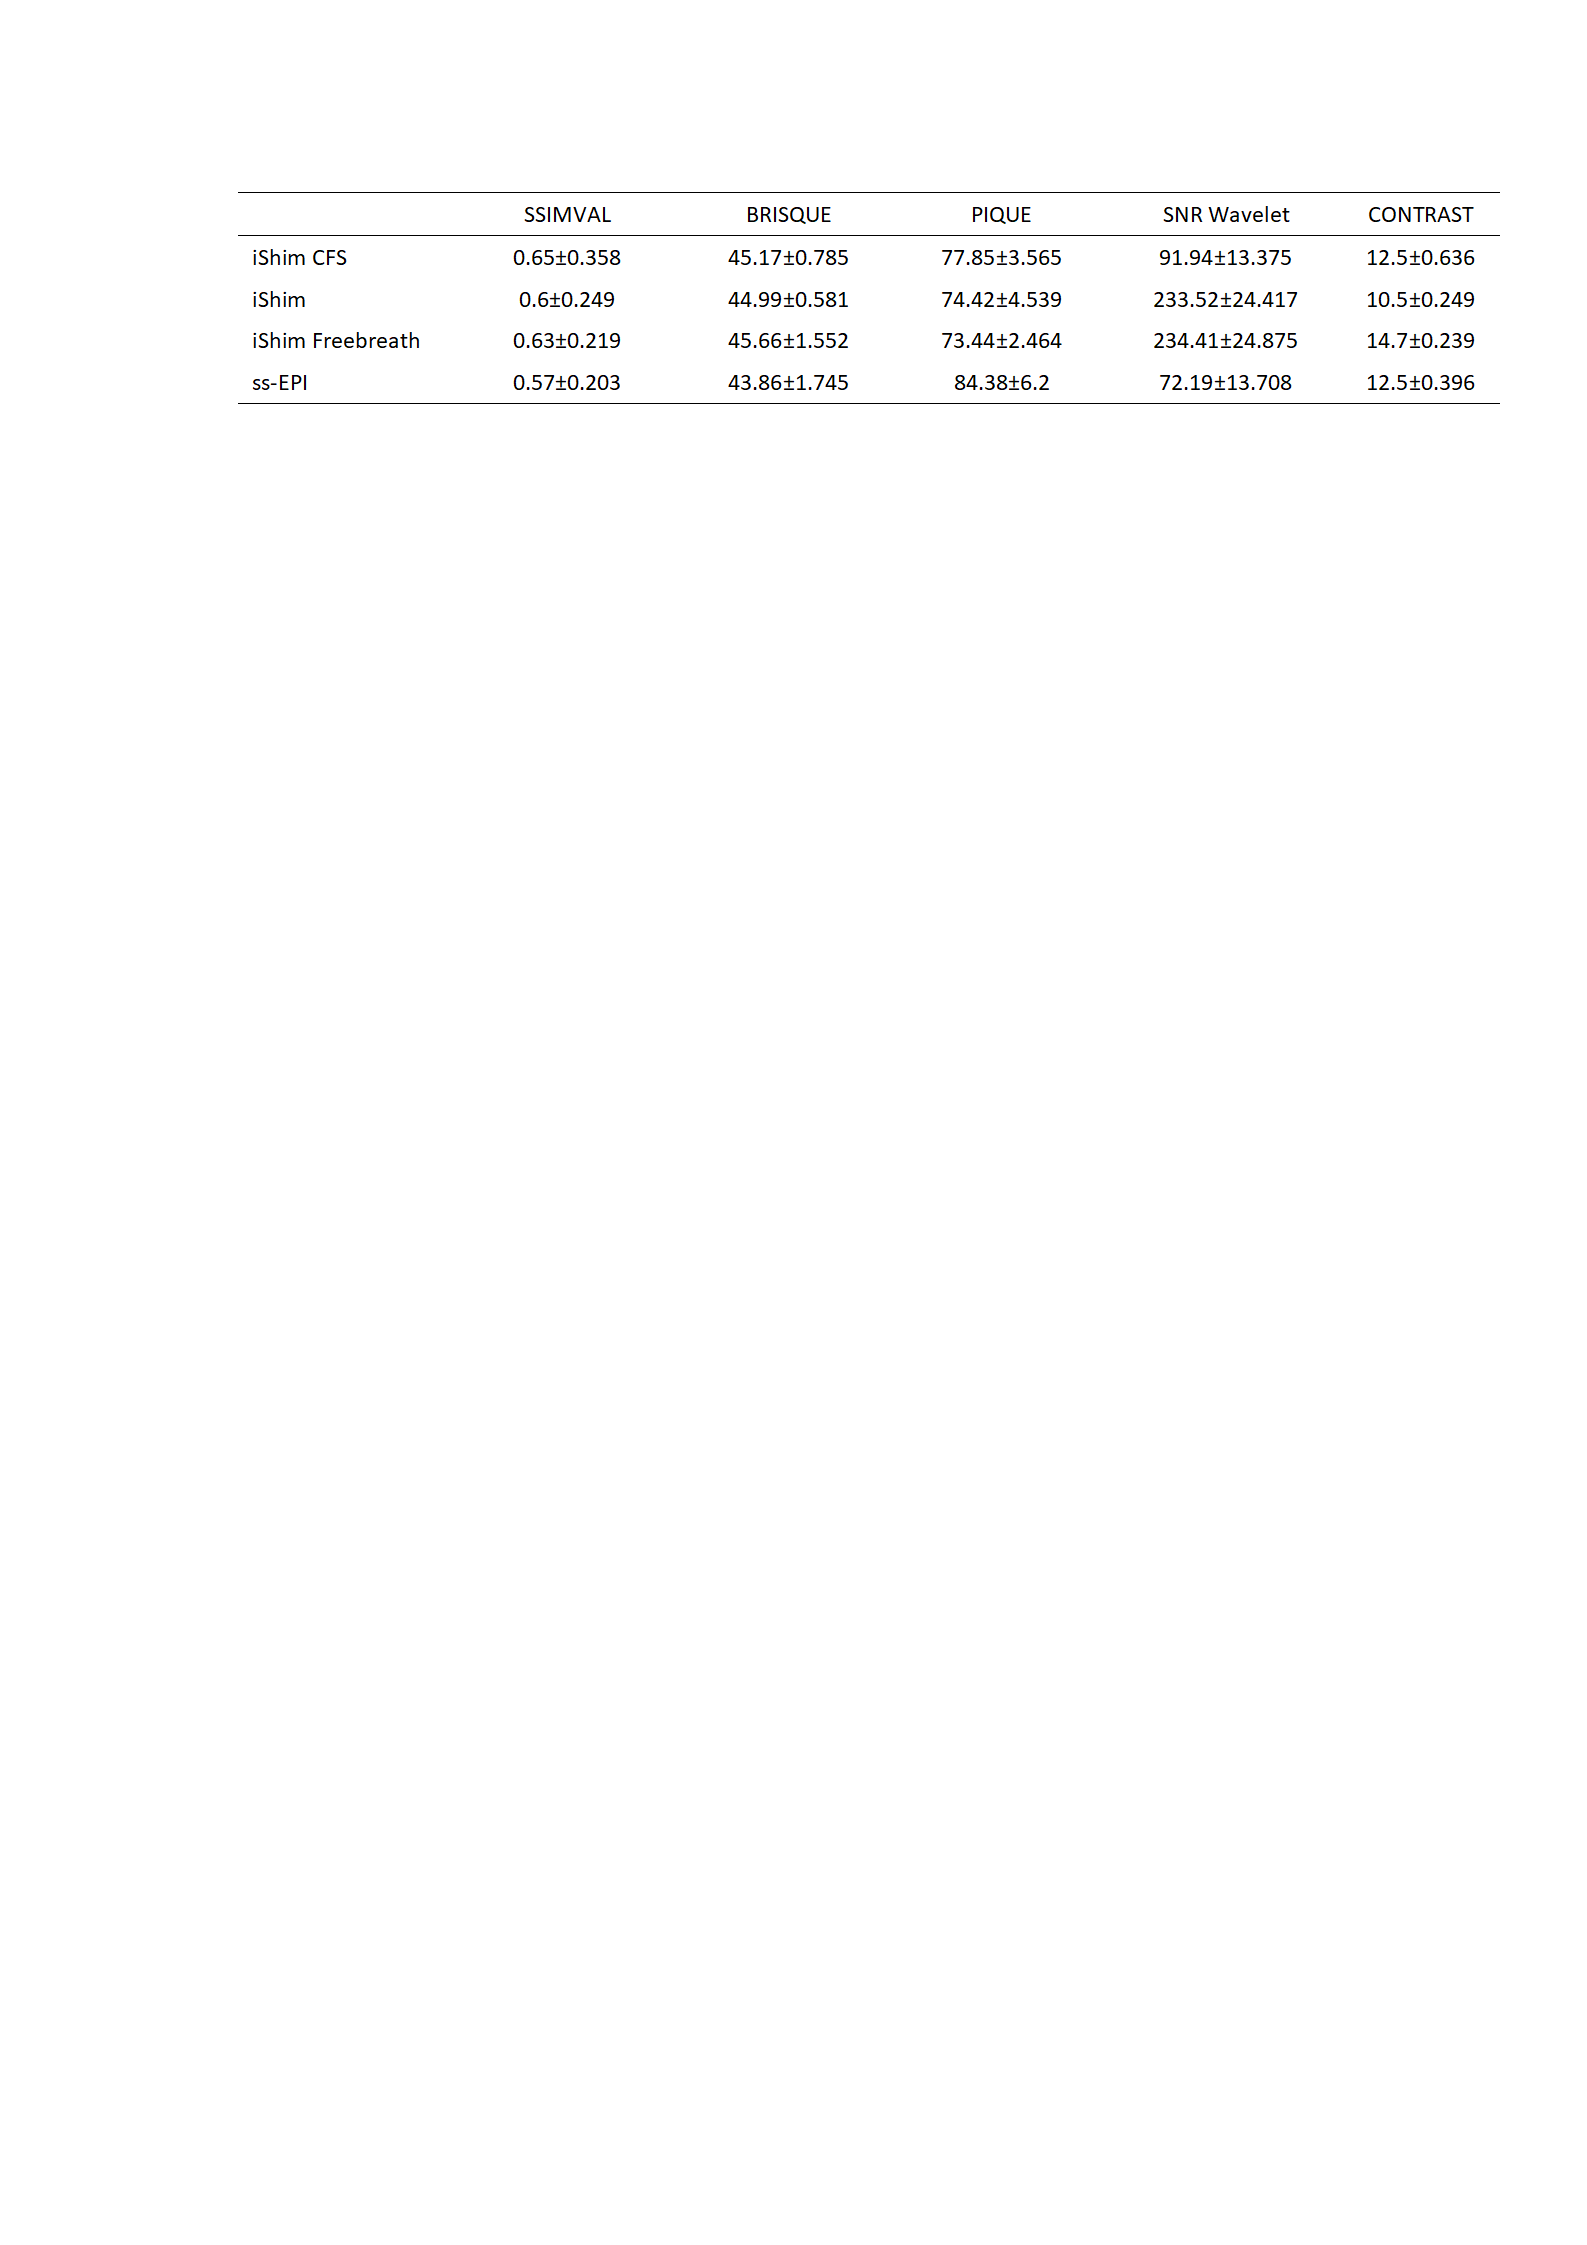
The SSIMVAL value is higher in the iShim sequence at respiratory triggering mode with CFS technique than at other conditions and also higher than the ss-EPI sequence, followed by this sequence at respiratory triggering mode without CFS technique, which may means the sequence in that conditions has a lower distortion and a higher whole image quality. For the whole perception image quality, the PIQUE values got lower scores in the iShim sequence at respiratory triggering mode both with and without CFS techniques, and this sequence at a free-breathing mode got the lowest score, which is very close to subjective quality scores that the iShim sequence gained a higher subjective quality scores than the ss-EPI sequence. Both at respiratory triggering mode without CFS technique and at a free-breathing mode, the SNR Wavelet got higher values in the iShim sequence, which is similar to the manual measured results.Discussion and conclusion
Structural Similarity Index (SSIM) for measuring image quality of hue, brightness, saturation and distortion, when we change the image into a binary image, the correlation between this value and distortion is enhanced. The BRISQUE score compare image to a default model computed from images of natural scenes with similar image quality. A smaller score indicates better perceptual quality. In this experiment, we didn’t find significant difference among four groups. The reason maybe attributed that BRISQUE value is affected by the preset model, so in order improve the consistency between this value and subjective evaluation scores, it is also an important work of the optimization of the model. The PIQE score is the no-reference image quality score and it is inversely correlated to the perceptual quality of an image. A low score value indicates high perceptual quality and high score value indicates low perceptual quality. In this study, we found the PIQUE values got a similar effect to subjective quality scores which may means the potential value of this matric in evaluation the whole image quality. After wavelet filtering, the image noise can be removed, so we can regard the difference between the original image and the filtered image as the noise. In contrast calculation, several gray scales in the middle of gray histogram are usually the represents the tissues we are interested in, so we use it to calculate the contrast of image. In this study, we didn’t found significant difference among groups as manual measured values, which may be due to manual sketching can focus on more precise target areas, while histogram analysis focuses on the overall contrast of the image, and how to evaluate the contrast of the image more pertinently should be noticed during histogram analysis. In conclusion, this study showed the automatic no-reference image quality metrics have potential in future in evaluation the image quality of abdominal DWI at 3T with a higher efficiency.Acknowledgements
No acknowledgement found.References
[1] Zhou, W., A. C. Bovik, H. R. Sheikh, and E. P. Simoncelli. "Image Qualifty Assessment: From Error Visibility to Structural Similarity." IEEE Transactions on Image Processing. Vol. 13, Issue 4, April 2004, pp. 600–612.[2] Mittal, A., A. K. Moorthy, and A. C. Bovik. "No-Reference Image Quality Assessment in the Spatial Domain." IEEE Transactions on Image Processing. Vol. 21, Number 12, December 2012, pp. 4695–4708.[3] N. Venkatanath, D. Praneeth, Bh. M. Chandrasekhar, S. S. Channappayya, and S. S. Medasani. "Blind Image Quality Evaluation Using Perception Based Features", In Proceedings of the 21st National Conference on Communications (NCC). Piscataway, NJ: IEEE, 2015. (PIQUE)Figures
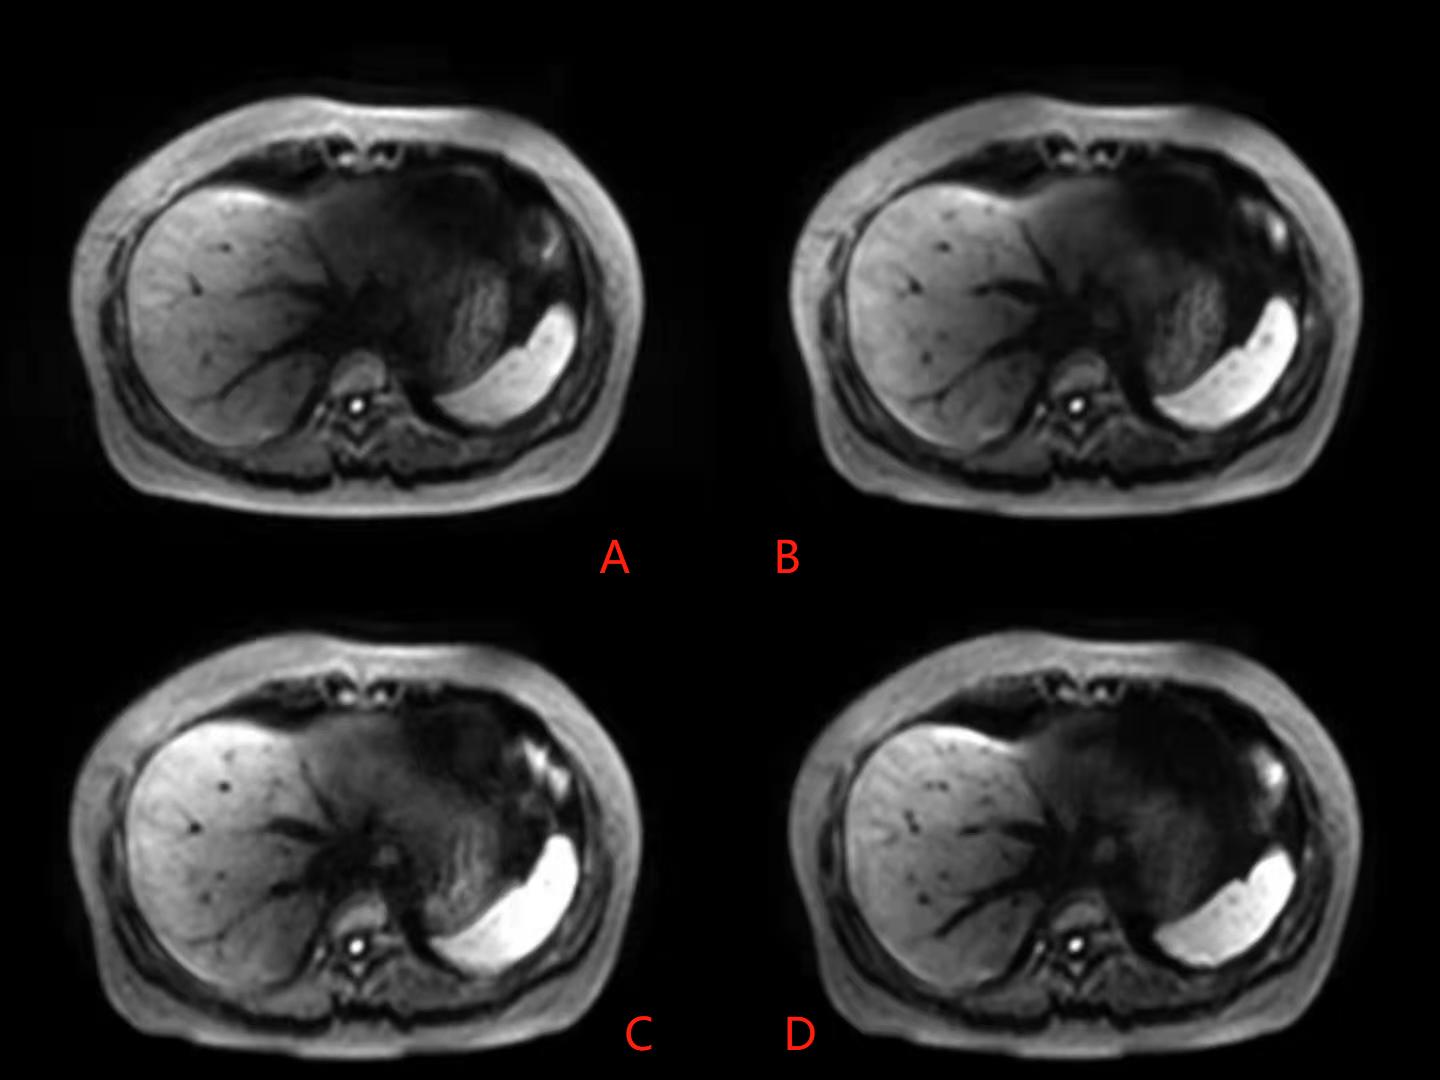
A: iShim sequence at respiratory triggering mode with and CFS
B: iShim sequence at respiratory triggering mode without CFS
C:iShim at a free-breathing mode
D:the ss-EPI sequence