4769
A method for automatic segmentation of the spinal cord and surrounding cerebrospinal fluid using whole-body Diffusion-Weighted MRI1The Institute of Cancer Research, London, United Kingdom
Synopsis
Whole-body Diffusion-Weighted MRI (WBDWI) is an emerging tool for quantitative assessment of the response/progression of metastatic bone disease from advanced prostate cancer and myeloma. The tumour apparent diffusion coefficient (ADC) measured by WBDWI shows sensitivity for assessing treatment response, but requires accurate bone disease segmentation. Automatic delineation of the spinal cord and cerebrospinal fluid (CSF) on WBDWI enables clear separation of the spinal cord from disease within the adjacent vertebral column leading to accurate bone disease segmentation. We have developed a new edge-detection method for automatic delineation of the spinal cord and surrounding CSF from WBDWI.
Background
Whole-body diffusion-weighted MRI (WBDWI) is an attractive tool for evaluating metastatic bone disease from prostate and breast cancers [1-2], and is now recommended for primary staging of multiple myeloma [3]. The technique enables quantification of the apparent diffusion coefficient (ADC), which is a surrogate marker of tumour cellularity, and also appears promising as a response biomarker for prostate bone metastases to treatment with systemic therapies [4-5]. To facilitate whole-body ADC assessment, there is a cogent need for automatic bone disease delineation on WBDWI in order to derive ADC statistics, because manual disease delineation is time-consuming and not feasible clinical practice. Automatic segmentation algorithms are being developed for this purpose [6], but the high signal intensity of the spinal cord on high diffusion-weighted (b-value) images can confound these approaches. Previous attempts at spinal cord segmentation typically involve using high resolution sagittal T1-/T2-weighted spine images [7-8], but such images are often misaligned with WBDWI due the latter’s sensitivity to geometric distortions [1]. In this study, we develop an automated approach to segmentation of the spinal cord and surrounding cerebral spinal fluid (CSF) using WBDWI images alone.Purpose
In this study we developed a novel method for the automatic delineation of the spinal cord and surrounding cerebrospinal fluid on WBDWI. We tested the performance of the method on a dataset of 28 patients who underwent WBDWI scans before the starting targeted treatment.Methods
Patient Population and Image AcquisitionThe study was approved by local research and ethics committee. Twenty-eight patients with predominant bone disease from advanced prostate cancer (APC) underwent WBDWI scanning at 1.5T (Aera, Siemens) before systemic treatment. Axial 2D single-shot echo-planar imaging was performed over 4-5 imaging stations (depending on patient height) using the following parameters: STIR fat suppression, echo-time (TE) = 69ms, acquisition matrix = 128x104, pixel spacing = 3.36x3.36 $$$ mm^2 $$$ , slice thickness = 5mm, b-values = 50/600/900 $$$ s/mm^2 $$$ with number of signal averages (NSA) distributed as 3/3/5, GRAPPA acceleration factor R = 2, and pixel bandwidth = 1955 Hz/pixel.
Segmentation Approach
Filtering and edges detection
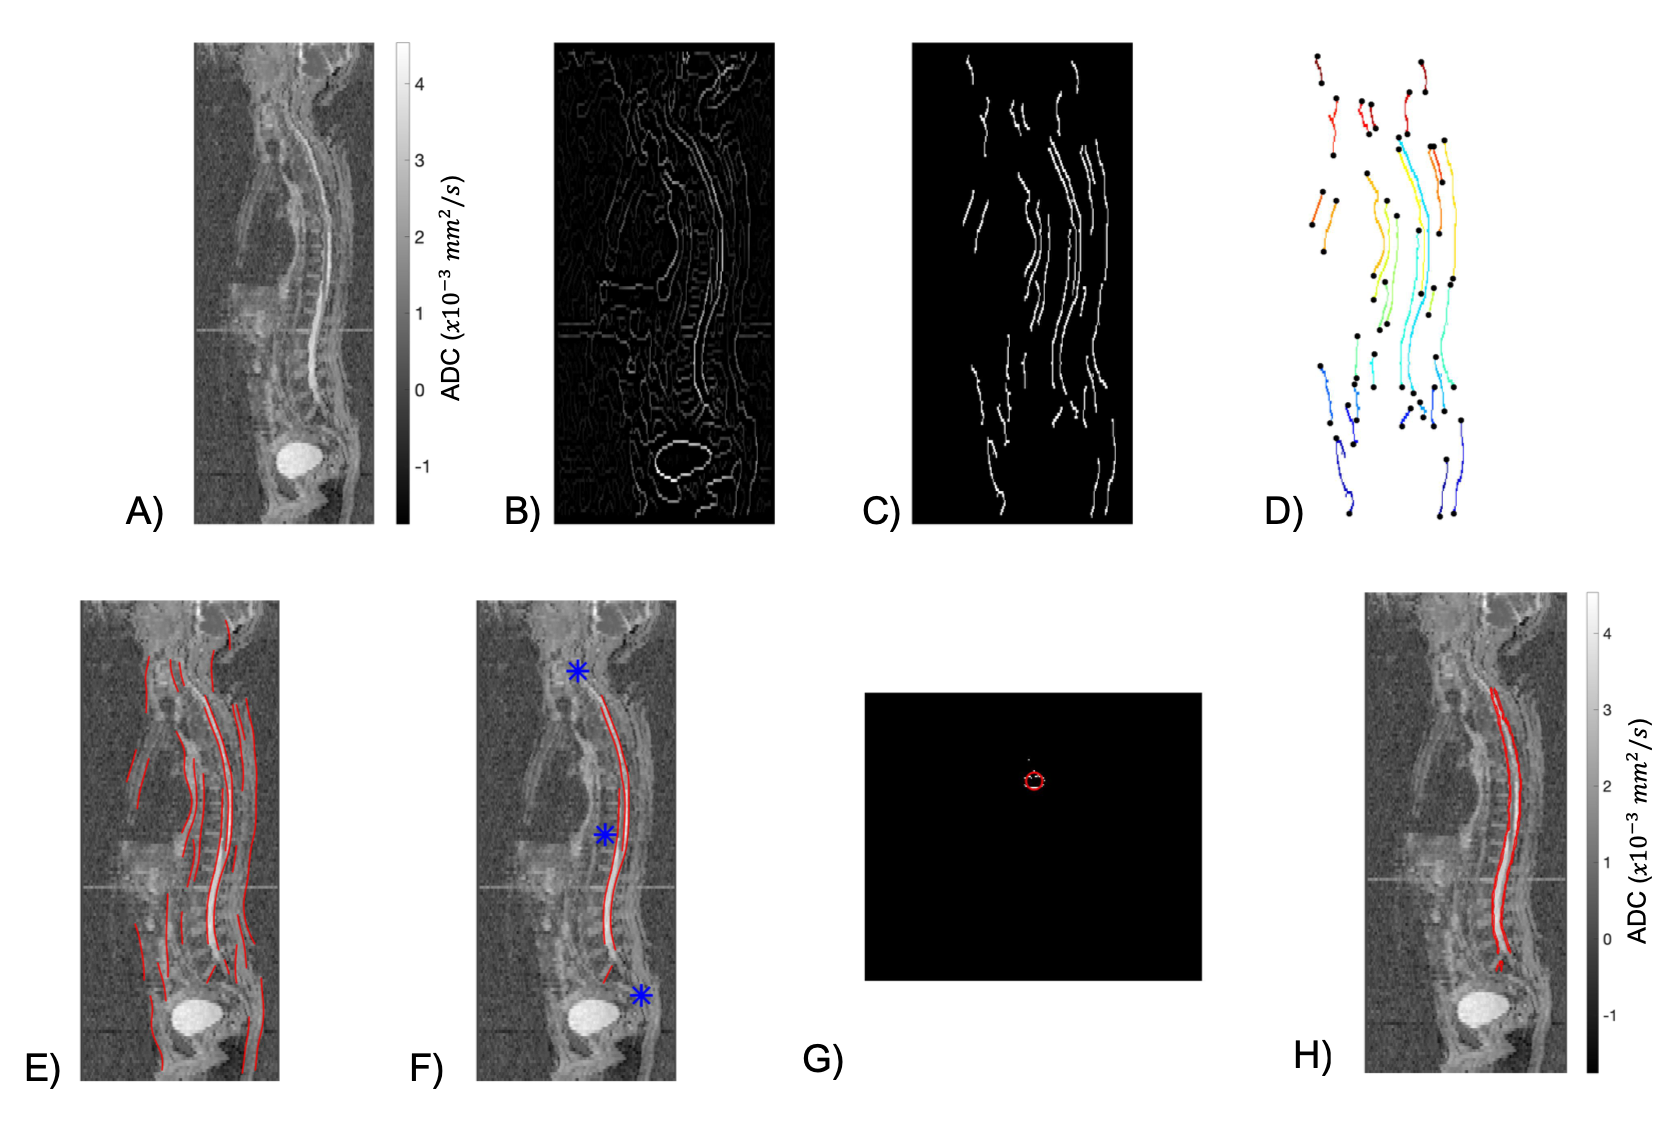
For each sagittal 2D ADC map reconstruction (Figure 1A), Wiener and Gaussian filters were used to removed noise and improve contrast. Edge-detection was performed using a gradient-based approach that allowed estimation of edge magnitude and direction (Figure 1B). Thresholding of the gradient magnitude was performed using maximum-suppression and hysteresis thresholding techniques to provide the image edges. Edges with a predominantly vertical orientation ($$$ <22^{\circ} $$$) within the sagittal plane were removed (Figure 1C).
Edge Linking
Due to the inherently low resolution and poor signal-to-noise-ratio (SNR) within ADC maps, discontinuities along the edges occurred. To overcome this, the endpoints of the edges were identified; edges were grouped if the Euclidean distance between any pair of endpoints was less than 5 pixels (Figure 1D). Each edge-group was then interpolated using a spline function to decrease edge discontinuities (Figure 1E).
Atlas registration and 3D delineation mask
To remove any edges outside of the vertebral column, we utilized an atlas-based detection of the spine; ADC maps were non-linearly registered to an atlas of nine WBDWI studies with previously delineated skeletons. This provided identification of edges that belong to the spinal column alone (Figure 1F). This process was repeated over all sagittal slices, and results were stacked to produce a preliminary 3D segmentation mask. Then, for each reconstructed axial slice, the centroid of the resulting mask was calculated; the average Euclidean distance of each pixel included in the mask to the centroid provided an estimate of the joint radius, r, of the spinal cord and CSF combined (Figure 1G). The final segmentation was constructed as a disk with radius r, centered at the calculated centroid (Figure 1H).
Results
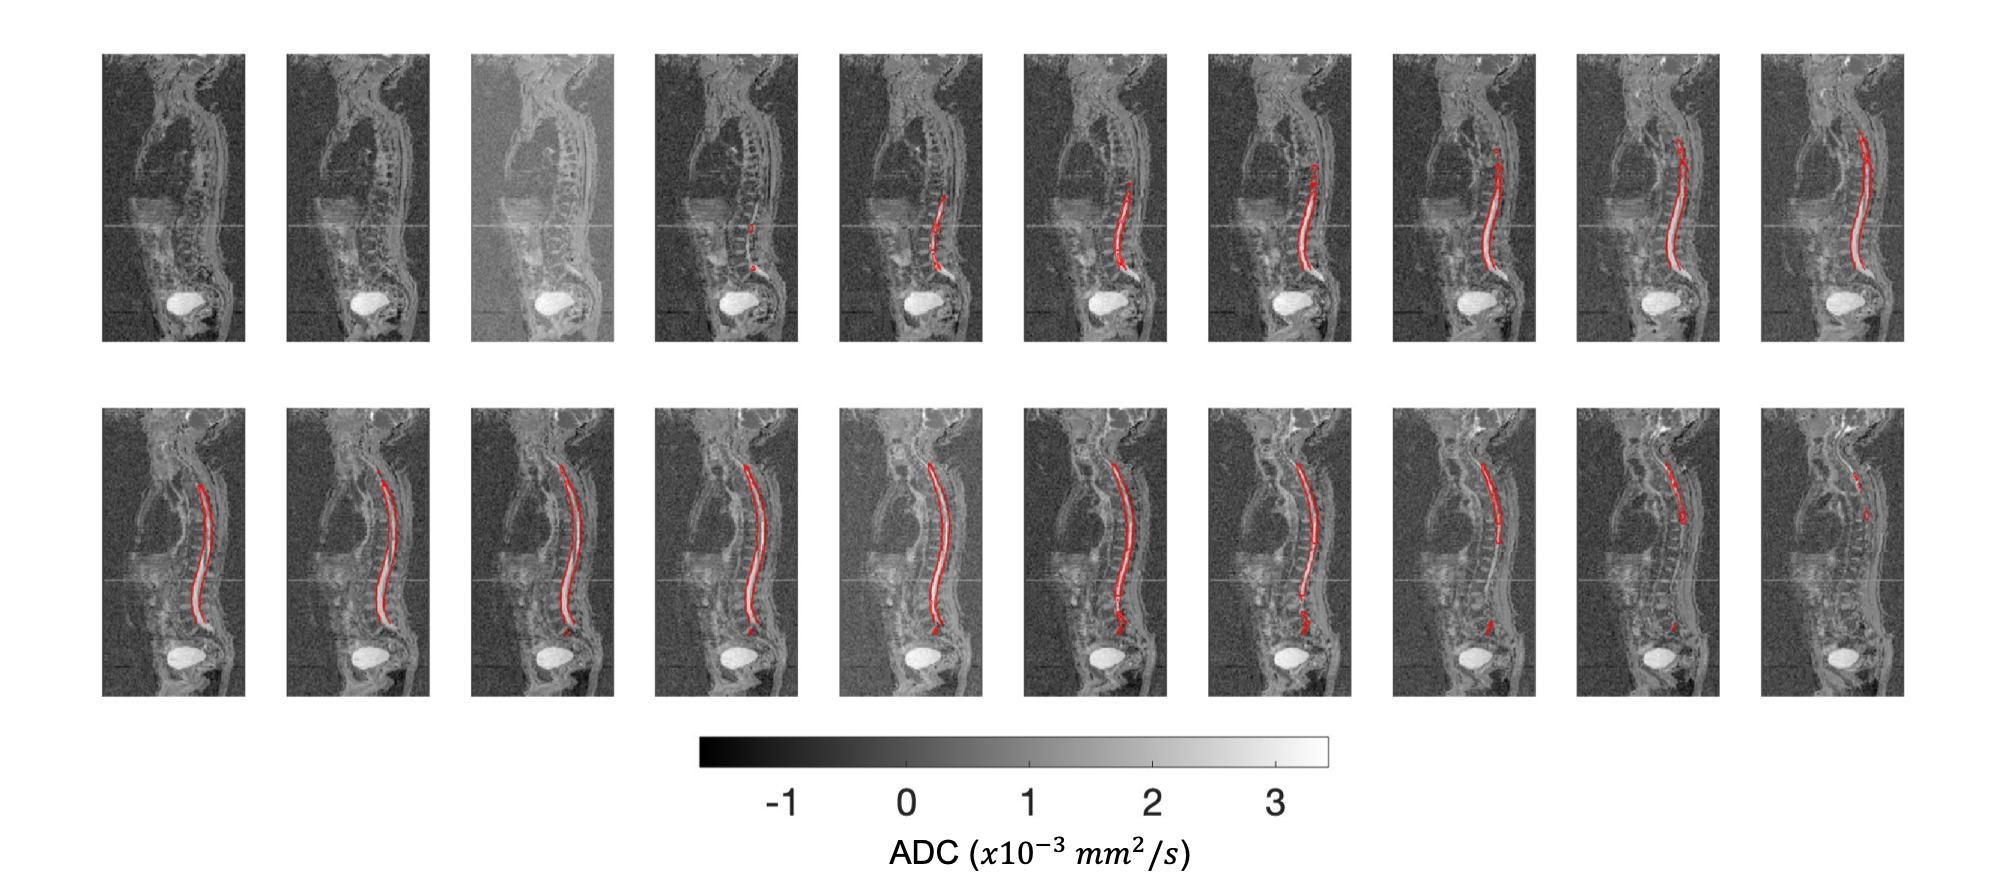
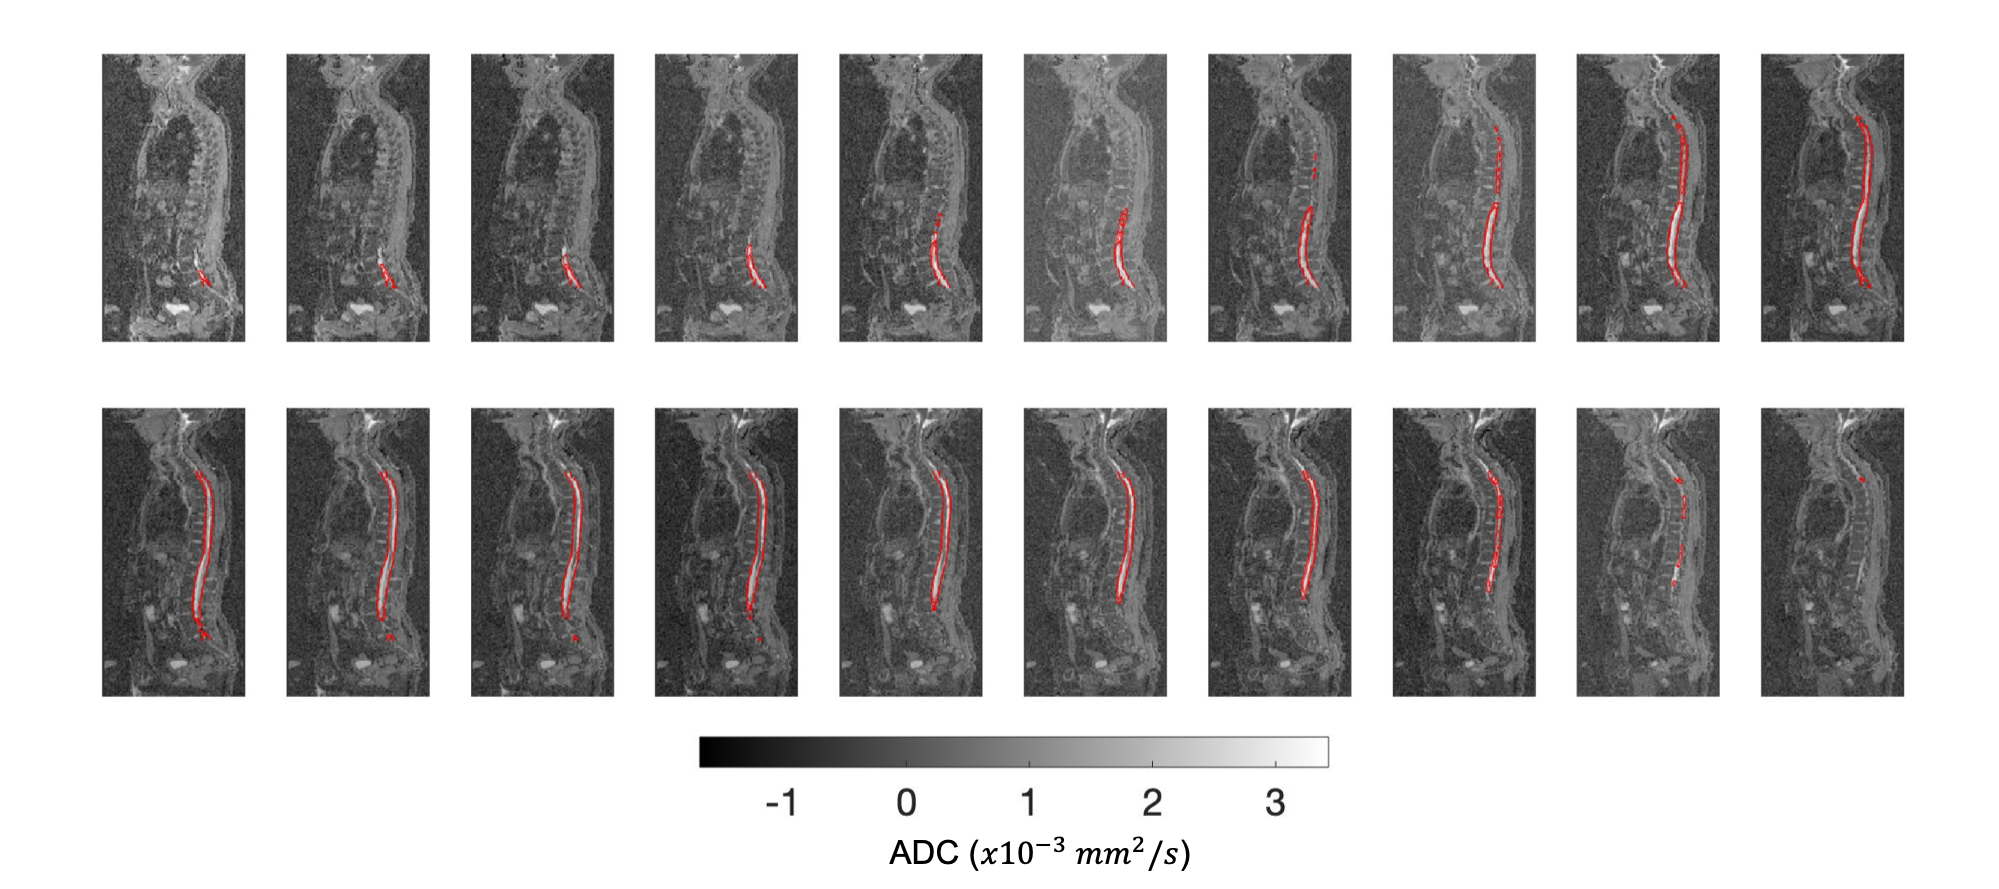
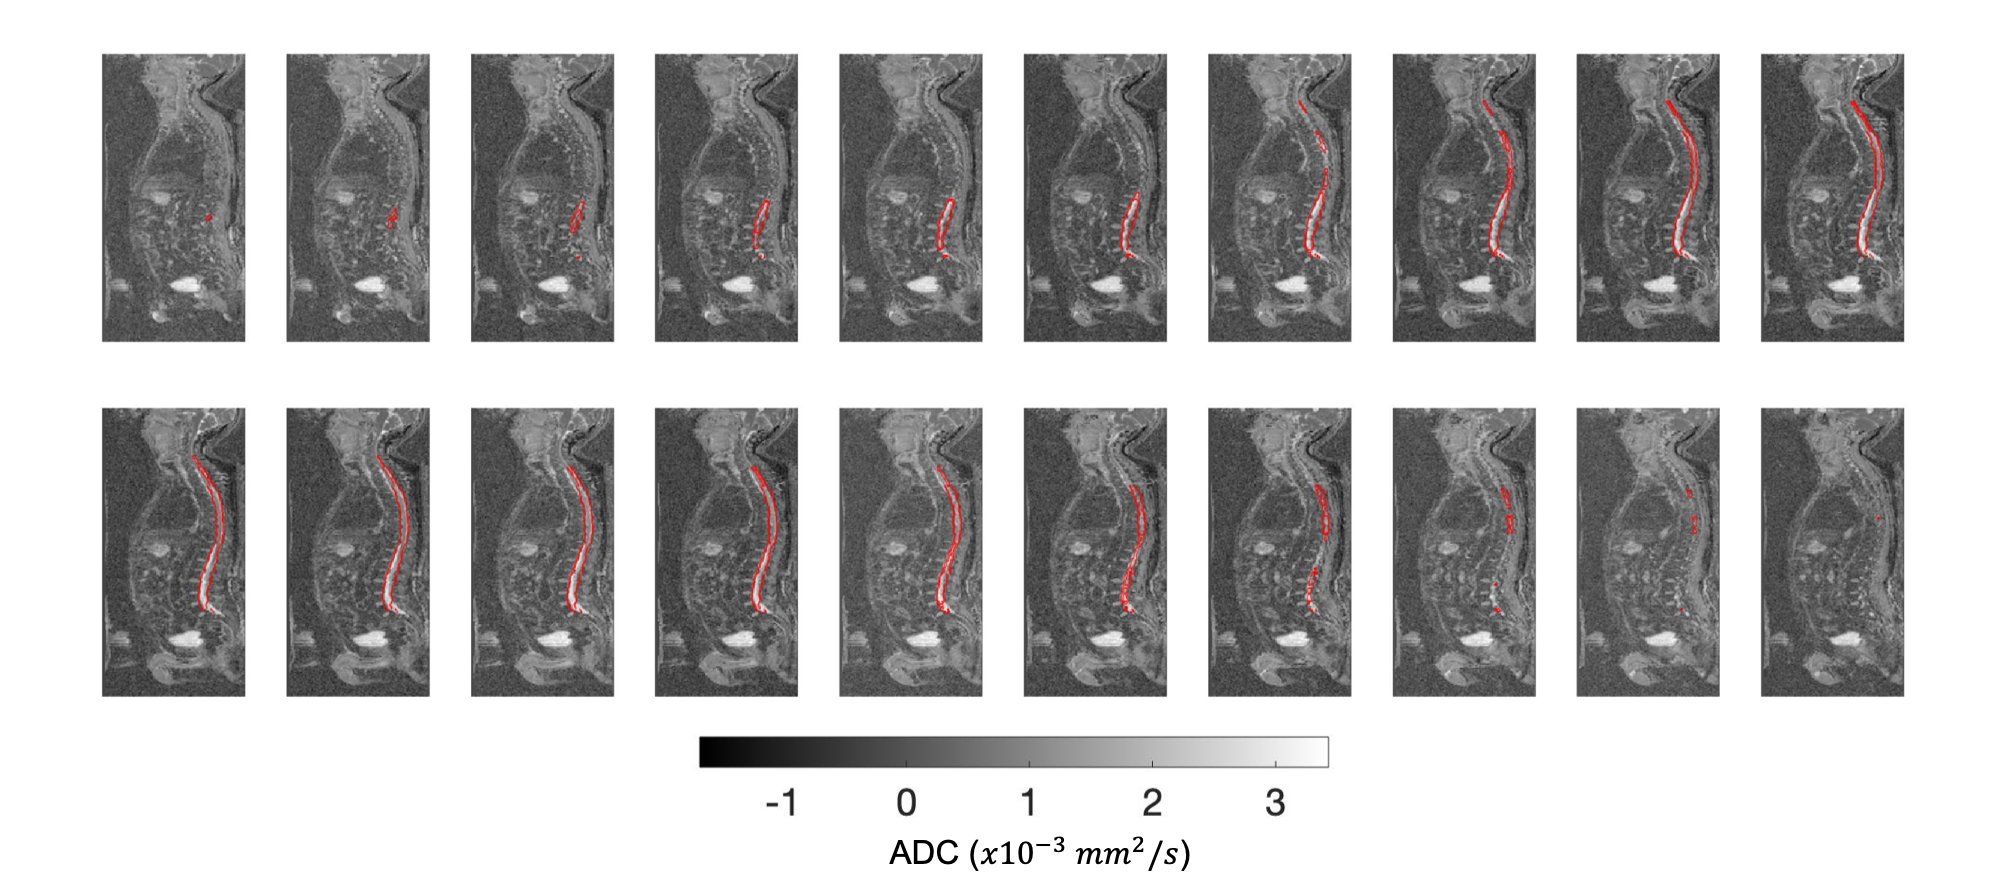
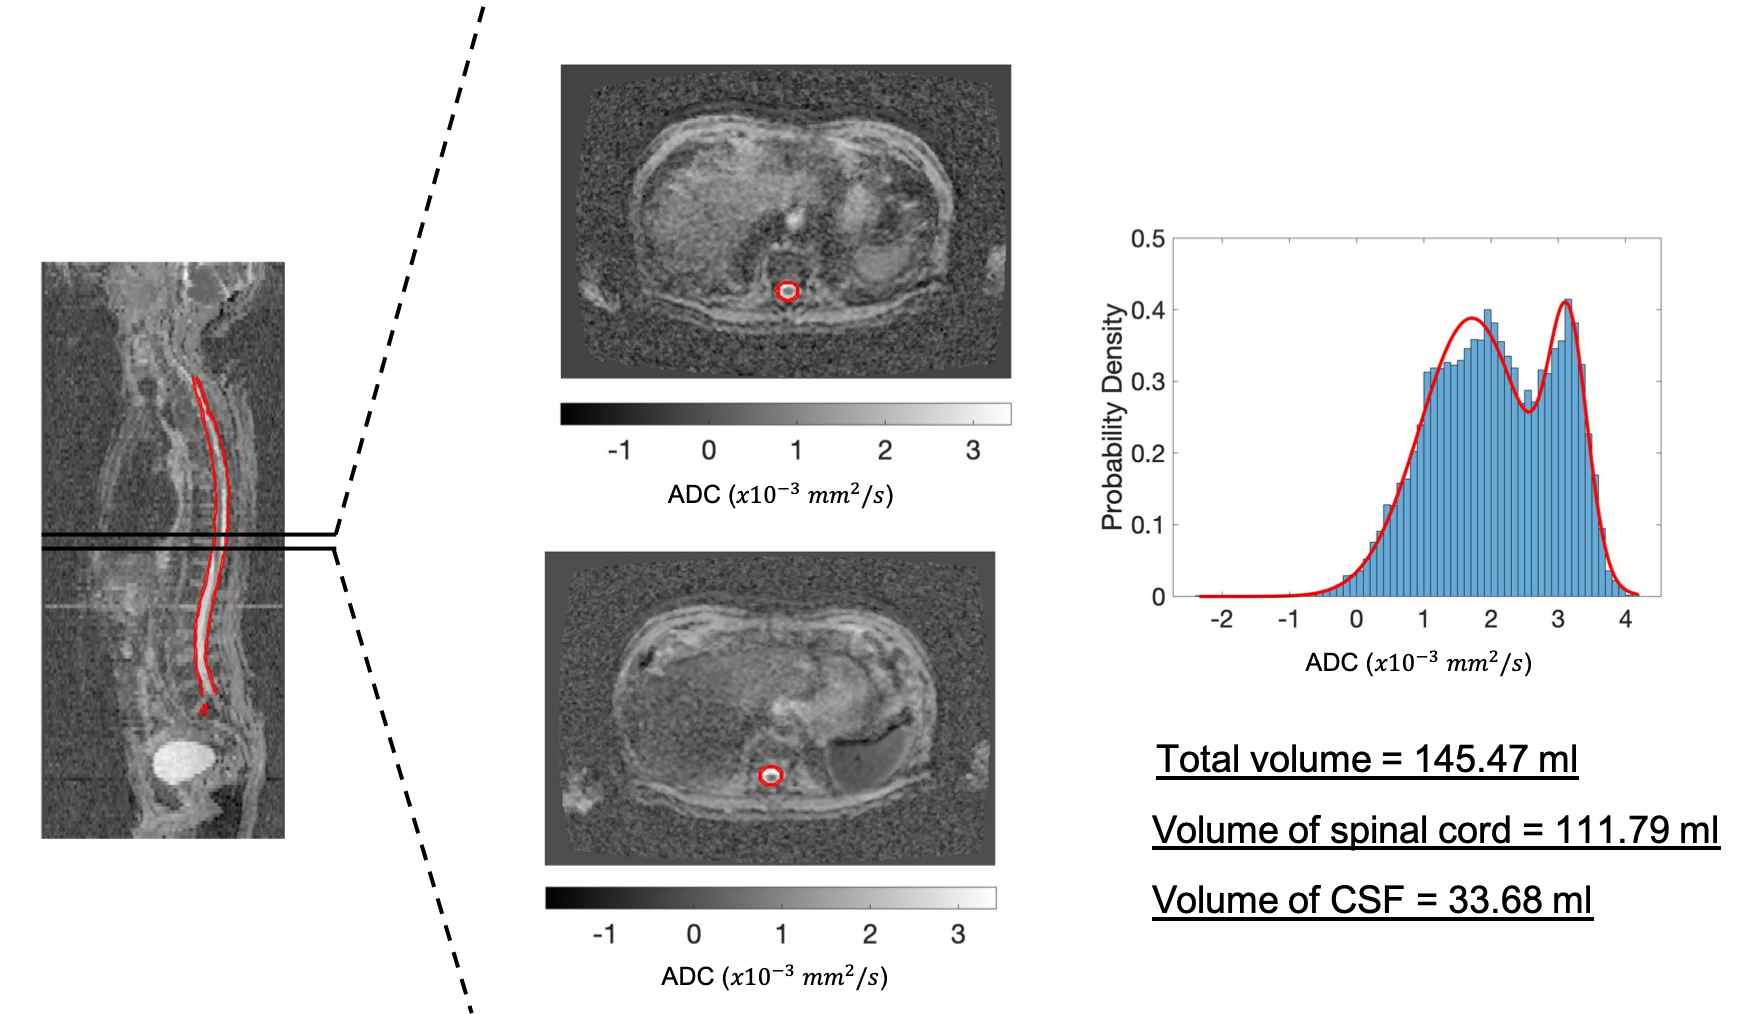
Figures 2-4 show the outcome of the method for the delineation of the spinal cord and CSF for three patients. The delineations (in red) were overlaid on the 2D reconstructed sagittal ADC maps for multiple sagittal locations. The method was capable of delineating the spinal cord and CSF with qualitatively high accuracy for each sagittal slice. Figure 5 illustrates the delineation along the axial plane of the spinal cord and CSF for the same patient demonstrated in Figure 2; the distribution of ADC values was derived and the volume of the spinal cord and CSF were estimated using a 2-component Gaussian mixture model.Discussion
This novel automatic segmentation method for the delineation of the spinal cord and CSF from WBDWI using the ADC maps showed promising results. This approach may automate the delineation of the spinal cord and improve automated approaches for segmenting metastatic bone disease, to improve the accuracy of disease ADC measurements on WBDWI. With further developments, such tools may guide clinicians in identifying the best treatment strategy for patients with metastatic bone disease. Further work is needed to validate these results within the context of a clinical trial.Acknowledgements
The authors would like to acknowledge Mint Medical; the NIHR i4i grant funding (NIHR i4i grant II-LA-0216-20007); as well as NIHR Clinical Research Facilities and Biomedical Research Centre at the Royal Marsden Hospital and Institute of Cancer Research.
References
[1]. Koh, Dow-Mu, et al. "Whole-body diffusion-weighted MRI: tips, tricks, and pitfalls." American Journal of Roentgenology 199.2 (2012): 252-262.
[2]. Padhani, Anwar R., et al. "METastasis reporting and data system for prostate cancer: practical guidelines for acquisition, interpretation, and reporting of whole-body magnetic resonance imaging-based evaluations of multiorgan involvement in advanced prostate cancer." European urology 71.1 (2017): 81-92.
[3]. Messiou, Christina, et al. "Guidelines for acquisition, interpretation, and reporting of whole-body MRI in myeloma: myeloma response assessment and diagnosis system (MY-RADS)." Radiology 291.1 (2019): 5-13.
[4]. Giles, Sharon L., et al. "Whole-body diffusion-weighted MR imaging for assessment of treatment response in myeloma." Radiology 271.3 (2014): 785-794.
[5]. Blackledge, Matthew D., et al. "Assessment of treatment response by total tumor volume and global apparent diffusion coefficient using diffusion-weighted MRI in patients with metastatic bone disease: a feasibility study." PloS one 9.4 (2014): e91779.
[6]. Ceranka, Jakub, et al. "Multi‐atlas segmentation of the skeleton from whole‐body MRI—Impact of iterative background masking." Magnetic resonance in medicine (2019).
[7]. Horsfield, Mark A., et al. "Rapid semi-automatic segmentation of the spinal cord from magnetic resonance images: application in multiple sclerosis." Neuroimage 50.2 (2010): 446-455.
[8]. Chen, Min, et al. "Automatic magnetic resonance spinal cord segmentation with topology constraints for variable fields of view." Neuroimage 83 (2013): 1051-1062.
Figures