4768
Measuring the repeatability of an automated Whole-Body Diffusion-Weighted MRI tumour segmentation approach in metastatic prostate cancer1The Institute of Cancer Research, London, United Kingdom, 2Mint Medical, Heidelberg, Germany, 3IEO, European Institute of Oncology IRCCS, Milan, Italy
Synopsis
There is currently no accepted biomarker for assessing response to treatment in patients with bone disease from advanced prostate cancer (APC). Whole-Body Diffusion-Weighted-MRI (WBDWI) is emerging as a bone response biomarker in APC. However, automatic segmentation of disease from WBDWI is needed to quantify changes in WBDWI-derived biomarkers (global tumour apparent diffusion coefficient (gADC) and total tumour volume, tDV) for more reliable response assessment. We investigate the repeatability of WBMRI parameters using automatic disease delineation in APC patients.
Background
Metastatic bone disease affects more than 75% of patients diagnosed with advanced prostate cancer [1] (APC). Metastases can result in skeletal fractures and spinal cord compression [2], leading to significant morbidity. Whole-Body Diffusion-Weighted MRI (WBDWI) demonstrates high sensitivity for detecting metastatic bone disease and for assessing their response/progression to systemic treatment [3]. Using WBDWI, the mean/ median global Apparent Diffusion Coefficient (gADC), which reflects the cellularity of bone disease across the body, typically increases in responders to treatment [4]. Furthermore, the total disease volume of bone metastases (tDV - in milliliters) can also be calculated, which often reduces with successful treatment. However, manual delineation of all disease across the body to measure gADC and tDV is impracticaland time-consuming, thus compromising the clinical usefulness of quantitative WBDWI for APC response assessment.Purpose
In this study, we evaluate the repeatability of a novel automatic disease segmentation algorithm for suspected areas of bone disease on WBDWI to measure their gADC and tDV on test-retest WBDWI scans obtained on the same day in patients with APC.Methods
Patient PopulationIn this retrospective study, we analysed data from eight patients with APC who underwent two baseline WBDWI scans on the same day, prior to treatment initiation. Ethical approval was obtained for this study, and analysis was performed in accordance with the Declaration of Helsinki (2013).
Image Acquisition
WBDWI images were acquired using b-values of 50, 600 and 900$$$ s/mm^2$$$ on a 1.5T scanner (Siemens Aera, Erlangen, Germany), over 4-5 stations from the skull base to mid-thigh, with each station comprising 40 slices, each with a slice thickness of 5mm. Echo-planar image acquisition was used (GRAPPA=2) employing a double-spin echo diffusion encoding scheme applied over three orthogonal encoding directions [echo time (TE) = 69ms, repetition time (TR) = 11300–18100ms, matrix size = 208x256, receive bandwidth = 1955 Hz/pixel, STIR fat suppression with an inversion time (T1) of 180ms and imaging field of view = 39±4cm (depending on patient size)].
Image Analysis
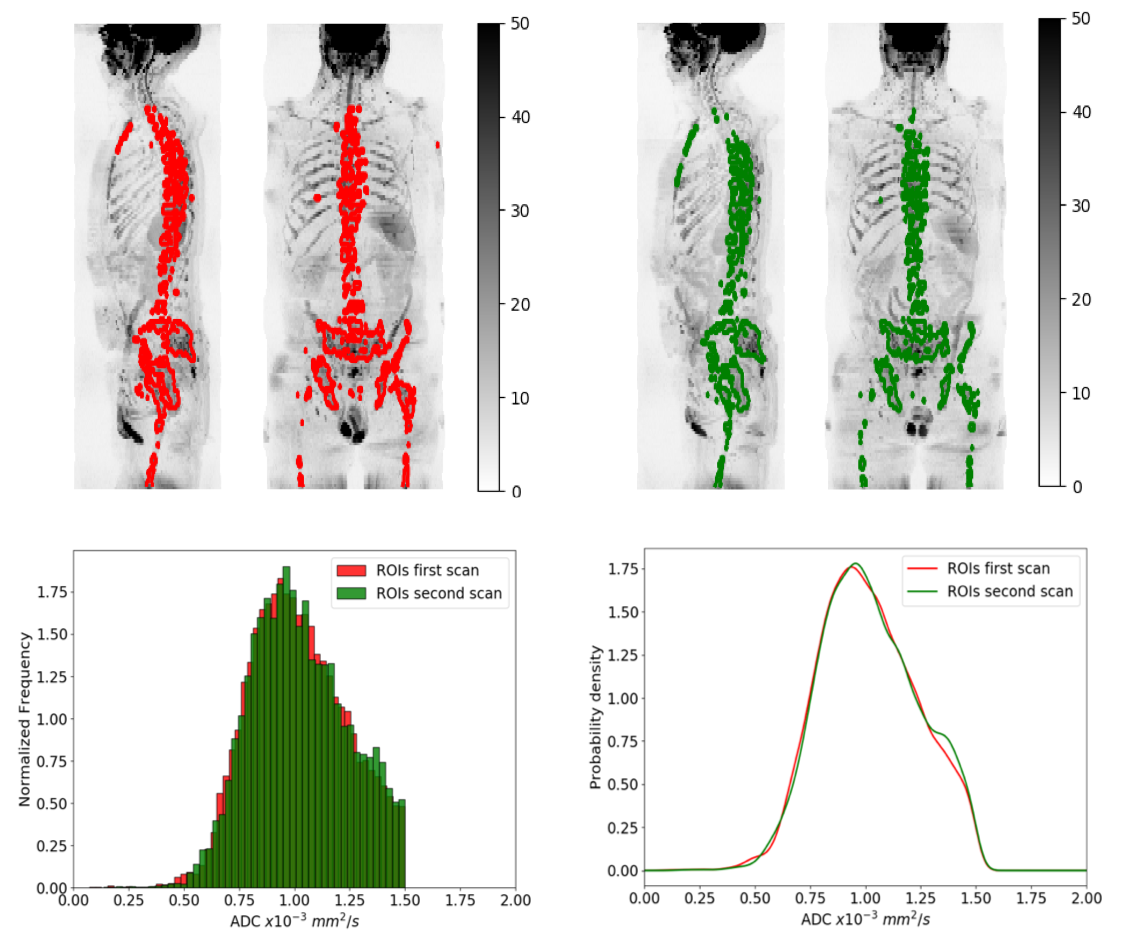
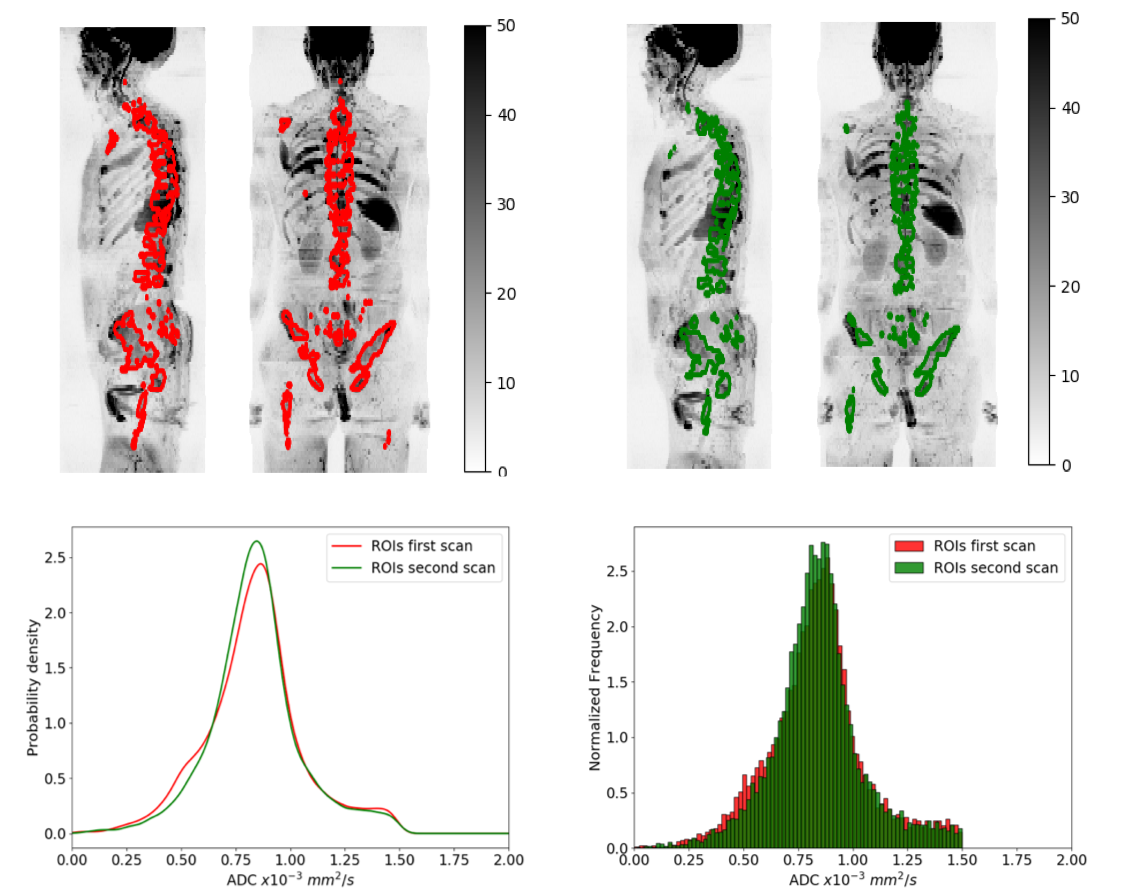
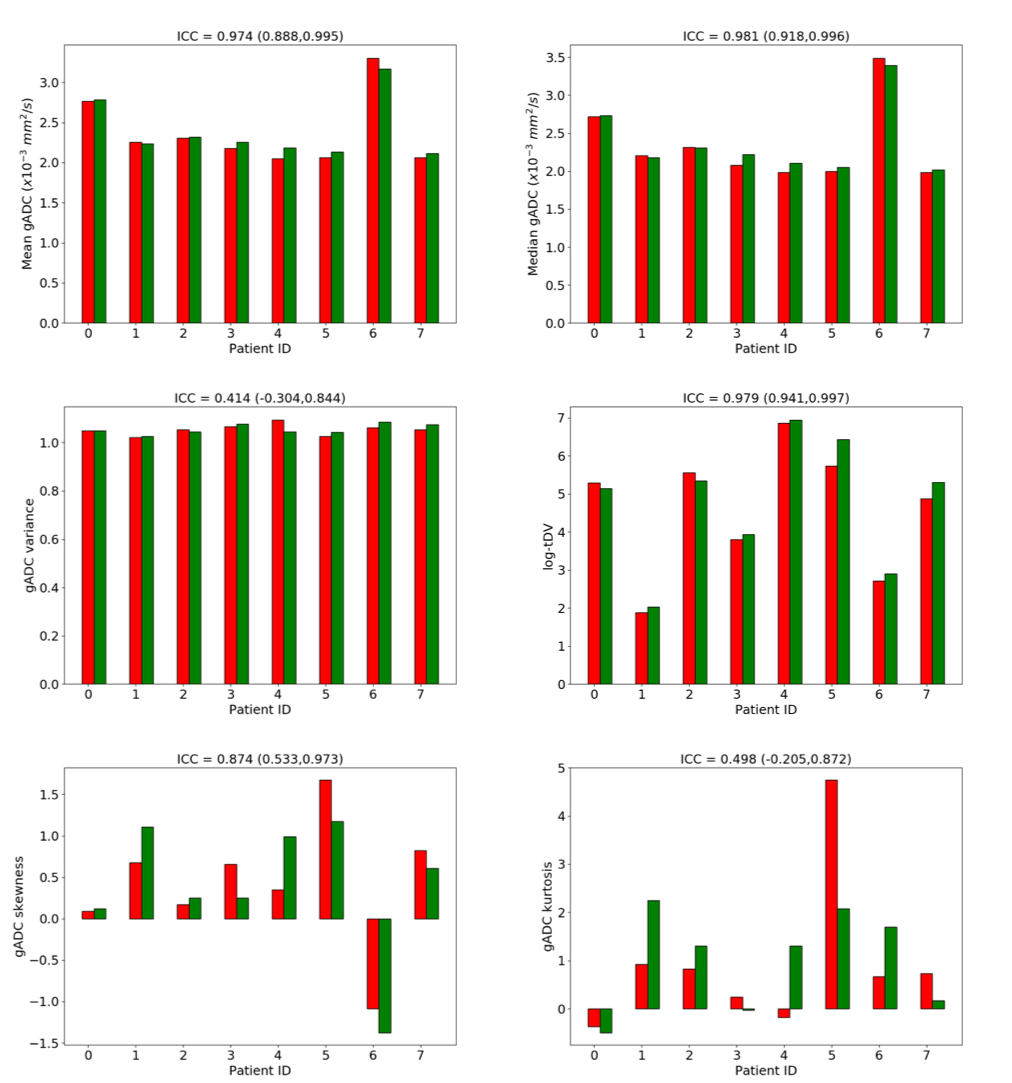
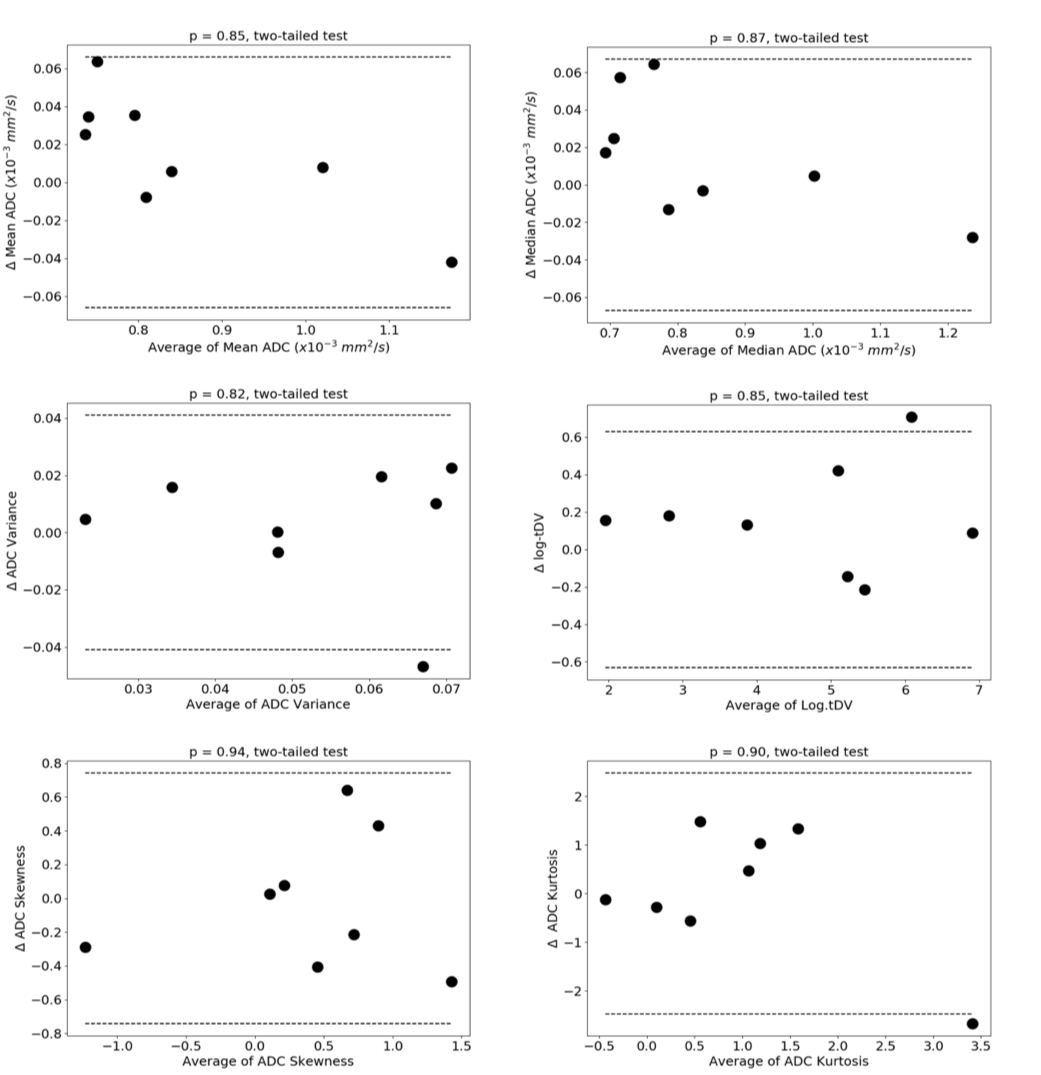
Delineation of the regions of interest (ROIs) was performed using a fully automated software solution: images were non-linearly registered to an atlas cohort of WBDWI datasets for which entire skeleton was manually defined. Generated ROIs were transferred to the calculated gADC maps and ADC statistics including mean, median, variance, skewness and kurtosis were calculated, in addition to the logarithm of the tDV (Figure 1 and Figure 2). Repeatability of each of these metrics was calculated using Bland-Altman analysis [5], and the intraclass correlation coefficient was measured (Figure 3). A two-tailed significance test (t-test) was performed to identify any bias between the repeat measurements. The Intraclass Correlation Coefficient (ICC), Coefficient of Variation (CoV), repeatability coefficient (r), and percentage repeatability (%r) were calculated for all WBDWI parameters:
$$$ ICC = \sigma_B^2 / (\sigma_B^2 + \sigma_W^2) $$$
$$$ CoV = \sigma_{W} / \mu $$$
$$$ r = 1.96 \cdot \sqrt{2} \cdot \sigma_{W} $$$
%$$$ r = (r/\mu)\cdot100 $$$
where ($$$\sigma_{B}$$$) and ($$$\sigma_{W}$$$) are the between and within subject standard deviation, and $$$ \mu $$$ is the population average for each biomarker measurement derived from WBDWI.
Results
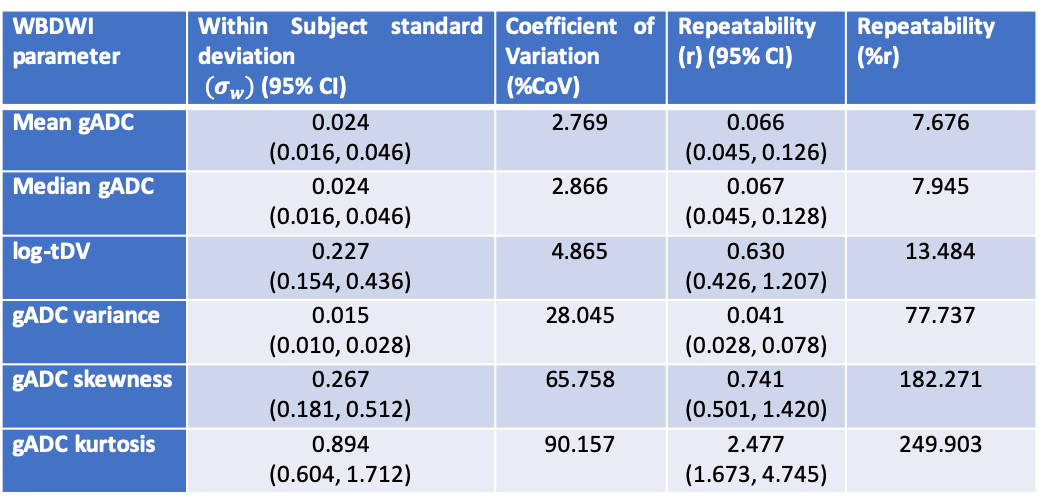
Figure 3 illustrates the barplots of the paired measurements for the two baseline WBMRI acquisitions. The plots show excellent measurement repeatability for the mean, median and skewness of gADC, and also for log-tDV; ICC values are higher than 0.97, indicative of excellent repeatability compared with between patient variation of these parameters. However, for a few histogram statistics (i.e. variance and kurtosis), the agreement between measurements decreases (ICC<0.5). Figure 4 illustrates the Bland-Altman plots for each of the WBDWI biomarkers investigated. The CoV for gADC variance, skewness and kurtosis is significantly higher than for mean/median gADC and log-tDV, suggesting that higher-order ADC parameters are not as robust for response assessment of disease using WBDWI. Table 1 summarises the CoV and %r for all derived parameters; CoV and %r for higher order histogram statistics are larger than for mean / median gADC and log-tDV, further demonstrating the statistical superiority of lower order gADC histogram features for response assessment.Discussion
This repeatability study demonstrates that the statistical gADC parameters derived from automated WBDWI segmentation show promise as a response biomarker for APC. The mean/median gADC and log-tDV demonstrate high repeatability between baseline data when applying a automatic segmentation technique. These results are consistent with an observer repeatability study performed by Blackledge et al. [6], where inter- and intra-reader repeatability were assessed. Interestingly, the repeatability for the mean and median (as well as the CoV) was in agreement with the study performed by Winfield et al. [7] evaluating repeatability across 13 studies. However, the paper reported the ADC repeatability values of tumors in smaller imaging fields-of-view (e.g. liver metastases) studies and did not include whole-body disease burden. A previous study investigating changes in WBDWI parameters following treatment demonstrated changes for log-tDV in the order of -50% to 26% and 17% for median gADC [8]. A change in WBDWI parameters of this magnitude would be outside the limits of agreements calculated in this study (~8% and ~14% for median gADC and log-tDV, respectively), suggesting that our automated segmentation approach could be used to successfully measure treatment response in clinical practice.Acknowledgements
The authors would like to acknowledge NIHR i4i grant funding (NIHR i4i grant II-LA-0216-20007); as well as NIHR Clinical Research Facilities and Biomedical Research Centre at the Royal Marsden Hospital and Institute of Cancer Research.
References
[1]. Coleman, R. E.et al.Clinical features of metastatic bone disease and risk of skeletal morbidity. Clin. Cancer Res.12, 6243–6250 (2006).
[2]. Macedo, F. et al.Bone metastases: An overview. Oncol. Rev.11, (2017).
[3]. Padhani, A. R., Koh, D. M. & Collins, D. J. Whole-body diffusion-weighted MR imaging in cancer: Current status and research directions. Radiology261, 700–718 (2011).
[4]. Padhani, A. R. & Gogbashian, A. Bony metastases: Assessing response to therapy with whole-body diffusion MRI. Cancer Imaging11, (2011).
[5]. J. Martin Bland, Douglas G. Altman a, B. Statistical methods for assessing agreement between two methods of clinical measurement. Int. J. Nurs. Stud.47, 8–10 (2011).
[6]. Blackledge, M. D. et al.Inter- and Intra-Observer Repeatability of Quantitative Whole-Body, Diffusion-Weighted Imaging (WBDWI) in Metastatic Bone Disease. PLoS One11, e0153840 (2016).
[7]. Winfield, J. M. et al.Extracranial soft-tissue tumors: Repeatability of apparent diffusion coefficient estimates from diffusion-weighted MR imaging. Radiology284, 88–99 (2017).
[8]. Blackledge, M. D. et al.Assessment of treatment response by total tumor volume and global apparent diffusion coefficient using diffusion-weighted MRI in patients with metastatic bone disease: A feasibility study. PLoS One9, 1–8 (2014).
Figures