4765
Retrospective ADC correction of gradient nonlinearity errors in multi-center breast DWI trials: ACRIN6698 multi-platform feasibility study1Radiology, University of Michigan, Ann Arbor, MI, United States, 2Radiology and Biomedical Imaging, University of California San Francisco, San Francisco, CA, United States, 3Hospital for Special Surgery, New York, NY, United States, 4GE Global Research, Niskayuna, NY, United States, 5Philips Research North America, Cambridge, MA, United States, 6Philips MR Clinical Science, Best, Netherlands, 7Siemens Medical Solutions, Boston, MA, United States, 8Siemens Healthcare GmbH, Erlangen, Germany, 9Radiology, University of Washington, Seattle, WA, United States
Synopsis
Multi-site, multi-platform clinical oncology trials seek to enhance quantitative utility of the apparent diffusion coefficient (ADC) metric by reducing technical cross-platform variability due to systematic gradient nonlinearity (GNL). Here we test feasibility of retrospective GNL correction implementation for a representative subset of subjects and systems from the ACRIN6698 breast cancer therapy response trial. GNL ADC correction based on previously developed formalism is demonstrated for trace-DWI DICOM using system-specific gradient-channel fields derived from vendor-provided spherical harmonic tables. Implemented correction substantially improves precision and removes ADC bias for DWI QC phantoms, and markedly changes ADC histogram percentiles for solid breast tumors.
INTRODUCTION
The ACRIN6698 multi-center breast cancer imaging trial evaluated the use of apparent diffusion coefficient (ADC) for prediction of therapy response1. Improved ADC accuracy after correction for spatial non-uniformity of diffusion weighting (DW) induced by system-specific gradient nonlinearity (GNL)2,3 was demonstrated for off-center anatomy by previous studies on a single vendor platform4,5. With the goal to improve cross-platform reproducibility and accuracy of ADC measures, this study evaluates the feasibility of retrospective GNL correction (GNC) in a clinical trial setting.METHODS
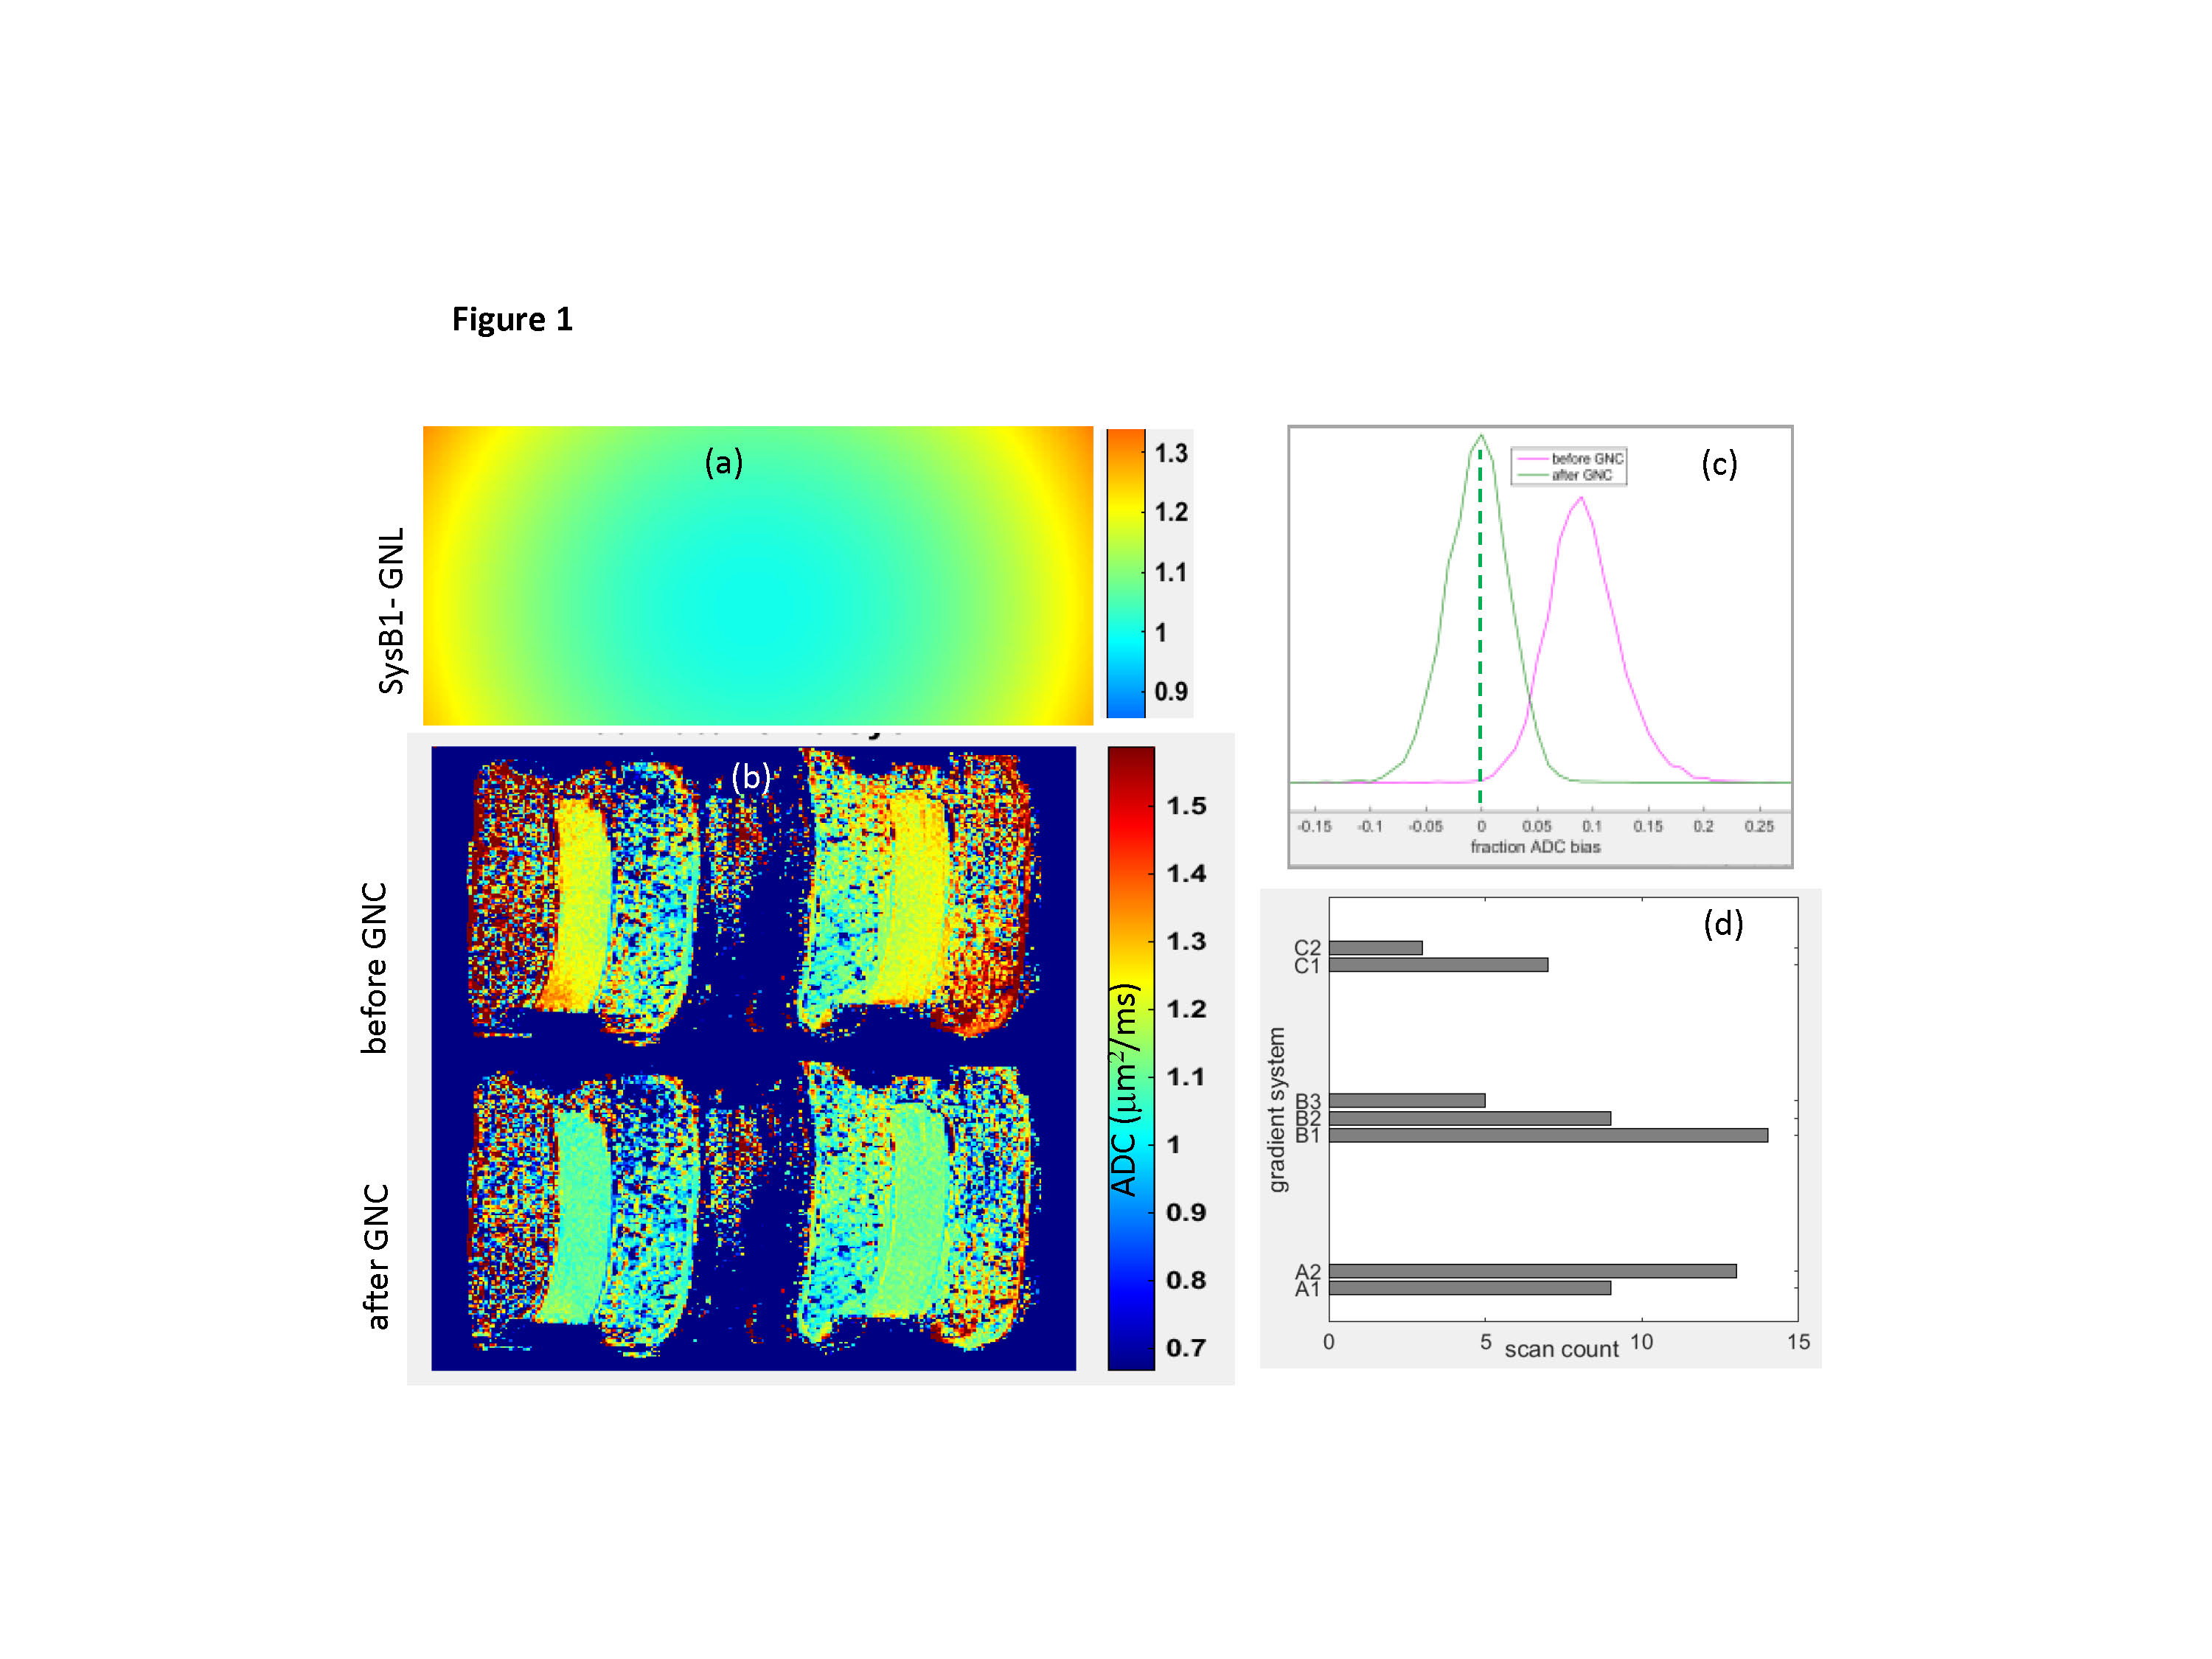
Phantom and subject data: For the ACRIN6698 trial, axial trace-DWI images for ice-water QC phantoms and study subjects were acquired at 10 imaging centers on 10 gradient configurations by 3 MRI vendors with dedicated breast coils. DWI was performed1 using standardized SS EPI sequences with b = 0, 100, 600, 800 s/mm2. ADC maps were calculated using a mono-exponential diffusion model. Tumor ROIs were defined as previously described1 on b=800 s/mm2 images to avoid necrotic areas. 60 trial subjects underwent test-retest scans before treatment to assess repeatability6 . For this feasibility study, a subset of 12 subjects (with 7 scanner gradient configurations) from the repeatability study was selected based on tumor ROI sizes between 1K and 3K voxels (to avoid histogram sampling bias). The QC phantom scans were analyzed for the gradient models corresponding to the in vivo scans.System GNL correction: An MRI gradient system inventory was compiled based on DICOM header information for the quantitative DWI phantom scans (Figure 1) used for trial site certification. Gradient channel design spherical harmonics (SPH) coefficients1 and normalization conventions were provided by vendors and used for calculation of system gradient fields and their spatial derivatives (GNL tensors, L(r), 2) on a 4-5 mm 3D grid. Direction-averaged corrector maps, Cb(r)=Tr[Luk(Luk)T],3 were then constructed covering the full characteristic gradient radii (500-660 mm diameters) using DWI gradients, uk, along primary magnet axes. For phantom and subject DWI, the system correctors were 3D-spline interpolated according to the DICOM header information for each imaged volume and resolution (e.g., Fig.1a). ADC correction was then performed by pixel-wise scaling, ADCGNC=ADC/Cave .
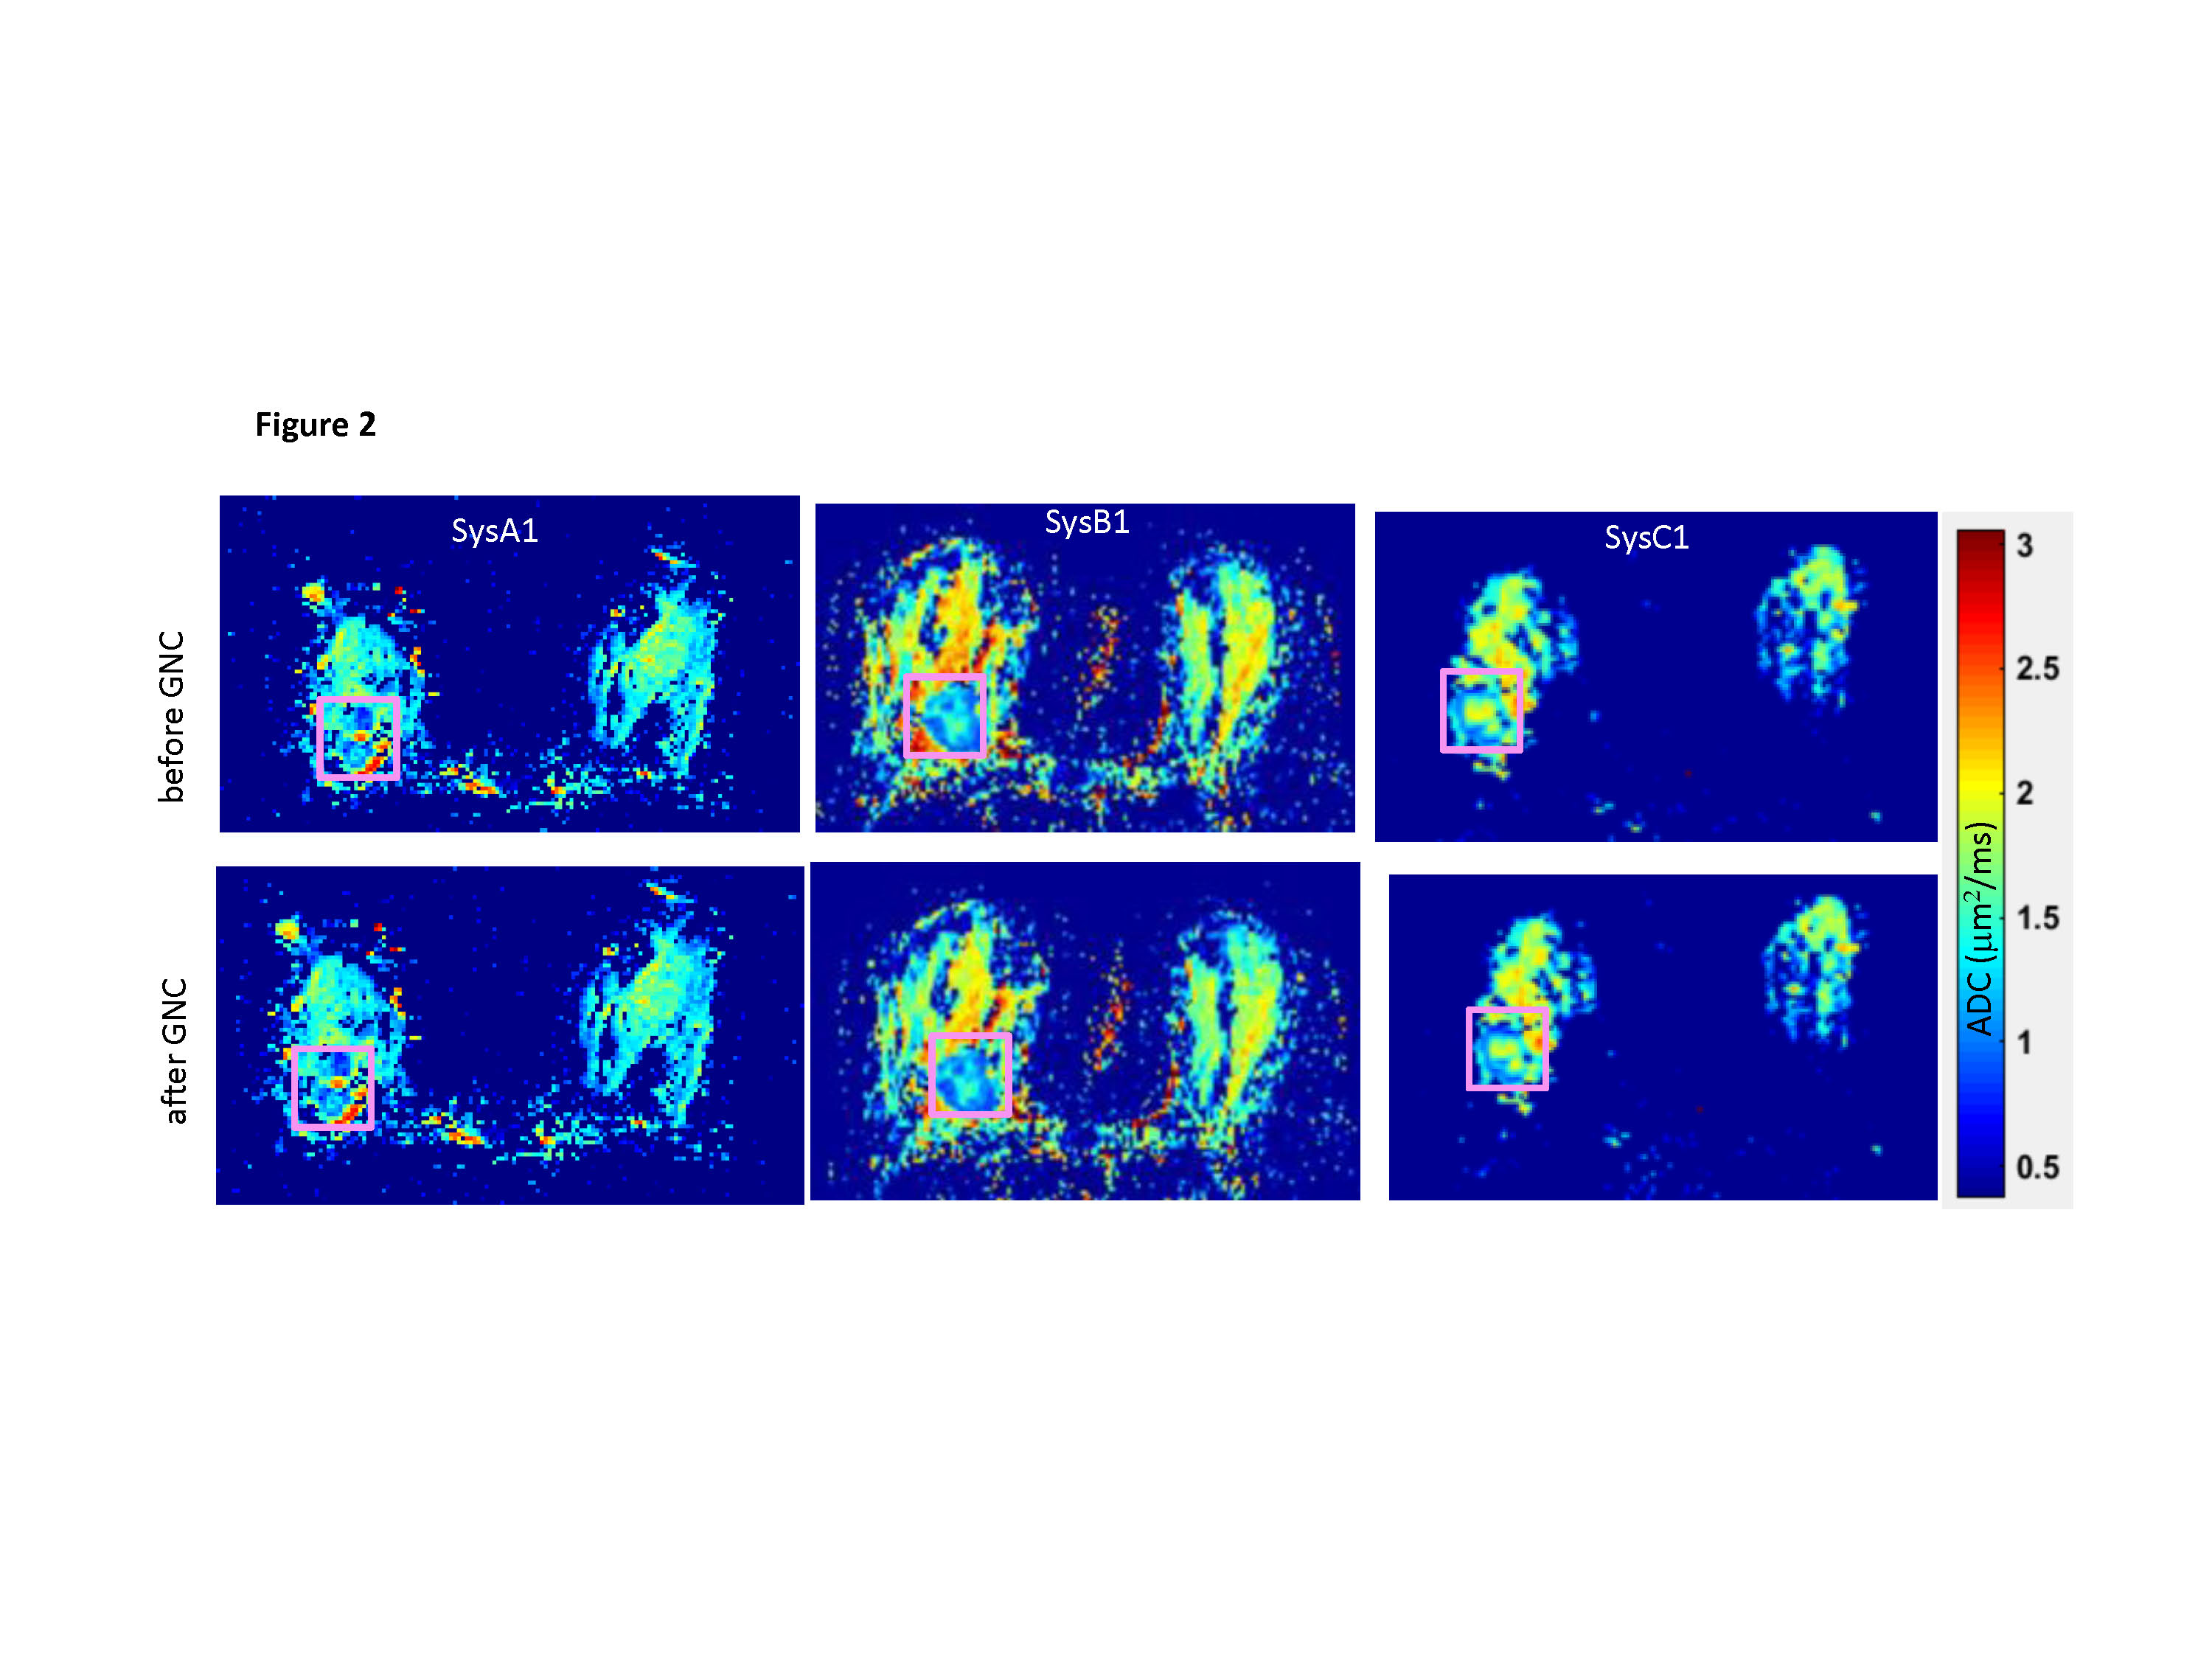
ADC histogram analysis: For ice-water DWI phantoms, the ADC bias, (ADC- ADC0)/ADC0, was estimated as fraction-deviation from the known diffusion value of ice-water ADC0 = 1.1(x10-3 µm2/s)7. The phantom ROIs encompassed whole tube length in the right and left jar (Fig.1b) over three axial sections. Subject/scanner-specific ROI histograms were normalized to total pixel count. The phantom ADC correction performance was quantified by reduction of fraction-bias for ROI histogram metrics (median and range) for individual scanners (Fig.1c) and improved alignment across scanners. The effect of in vivo GNC (Figure 2) was assessed from malignant tumor ADC histogram percentiles across scanners and subjects.
RESULTS AND DISCUSSION
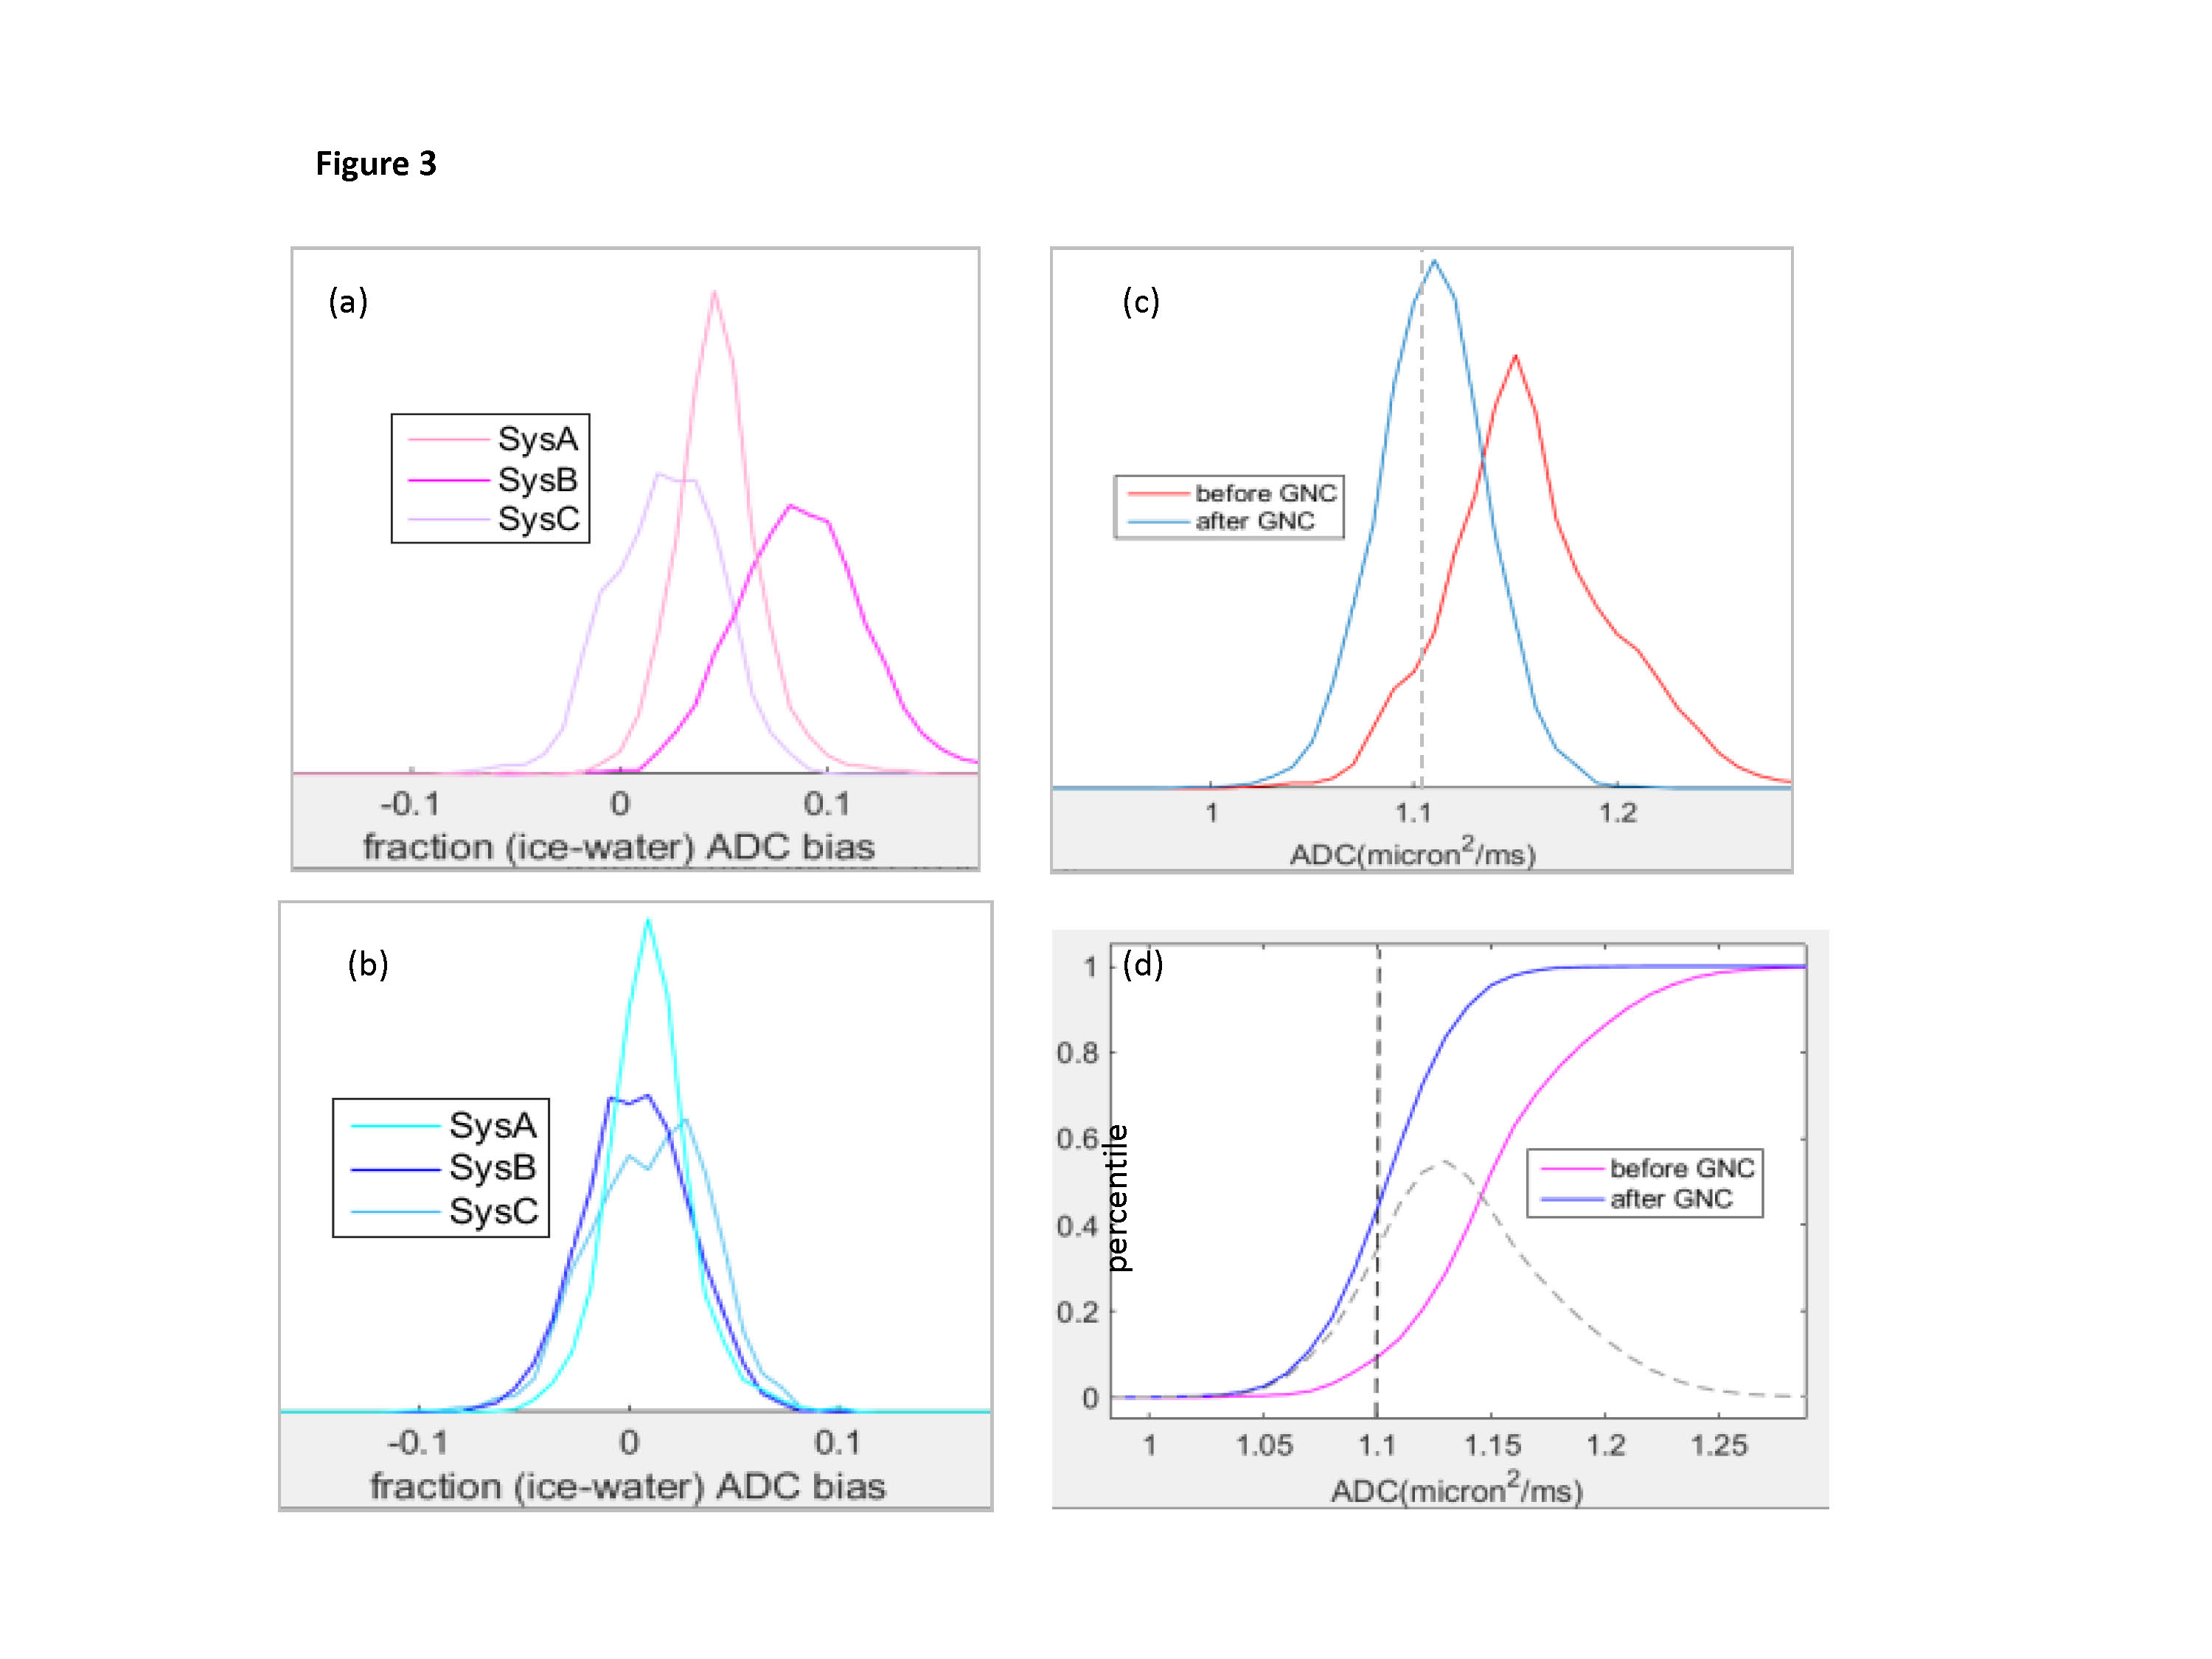
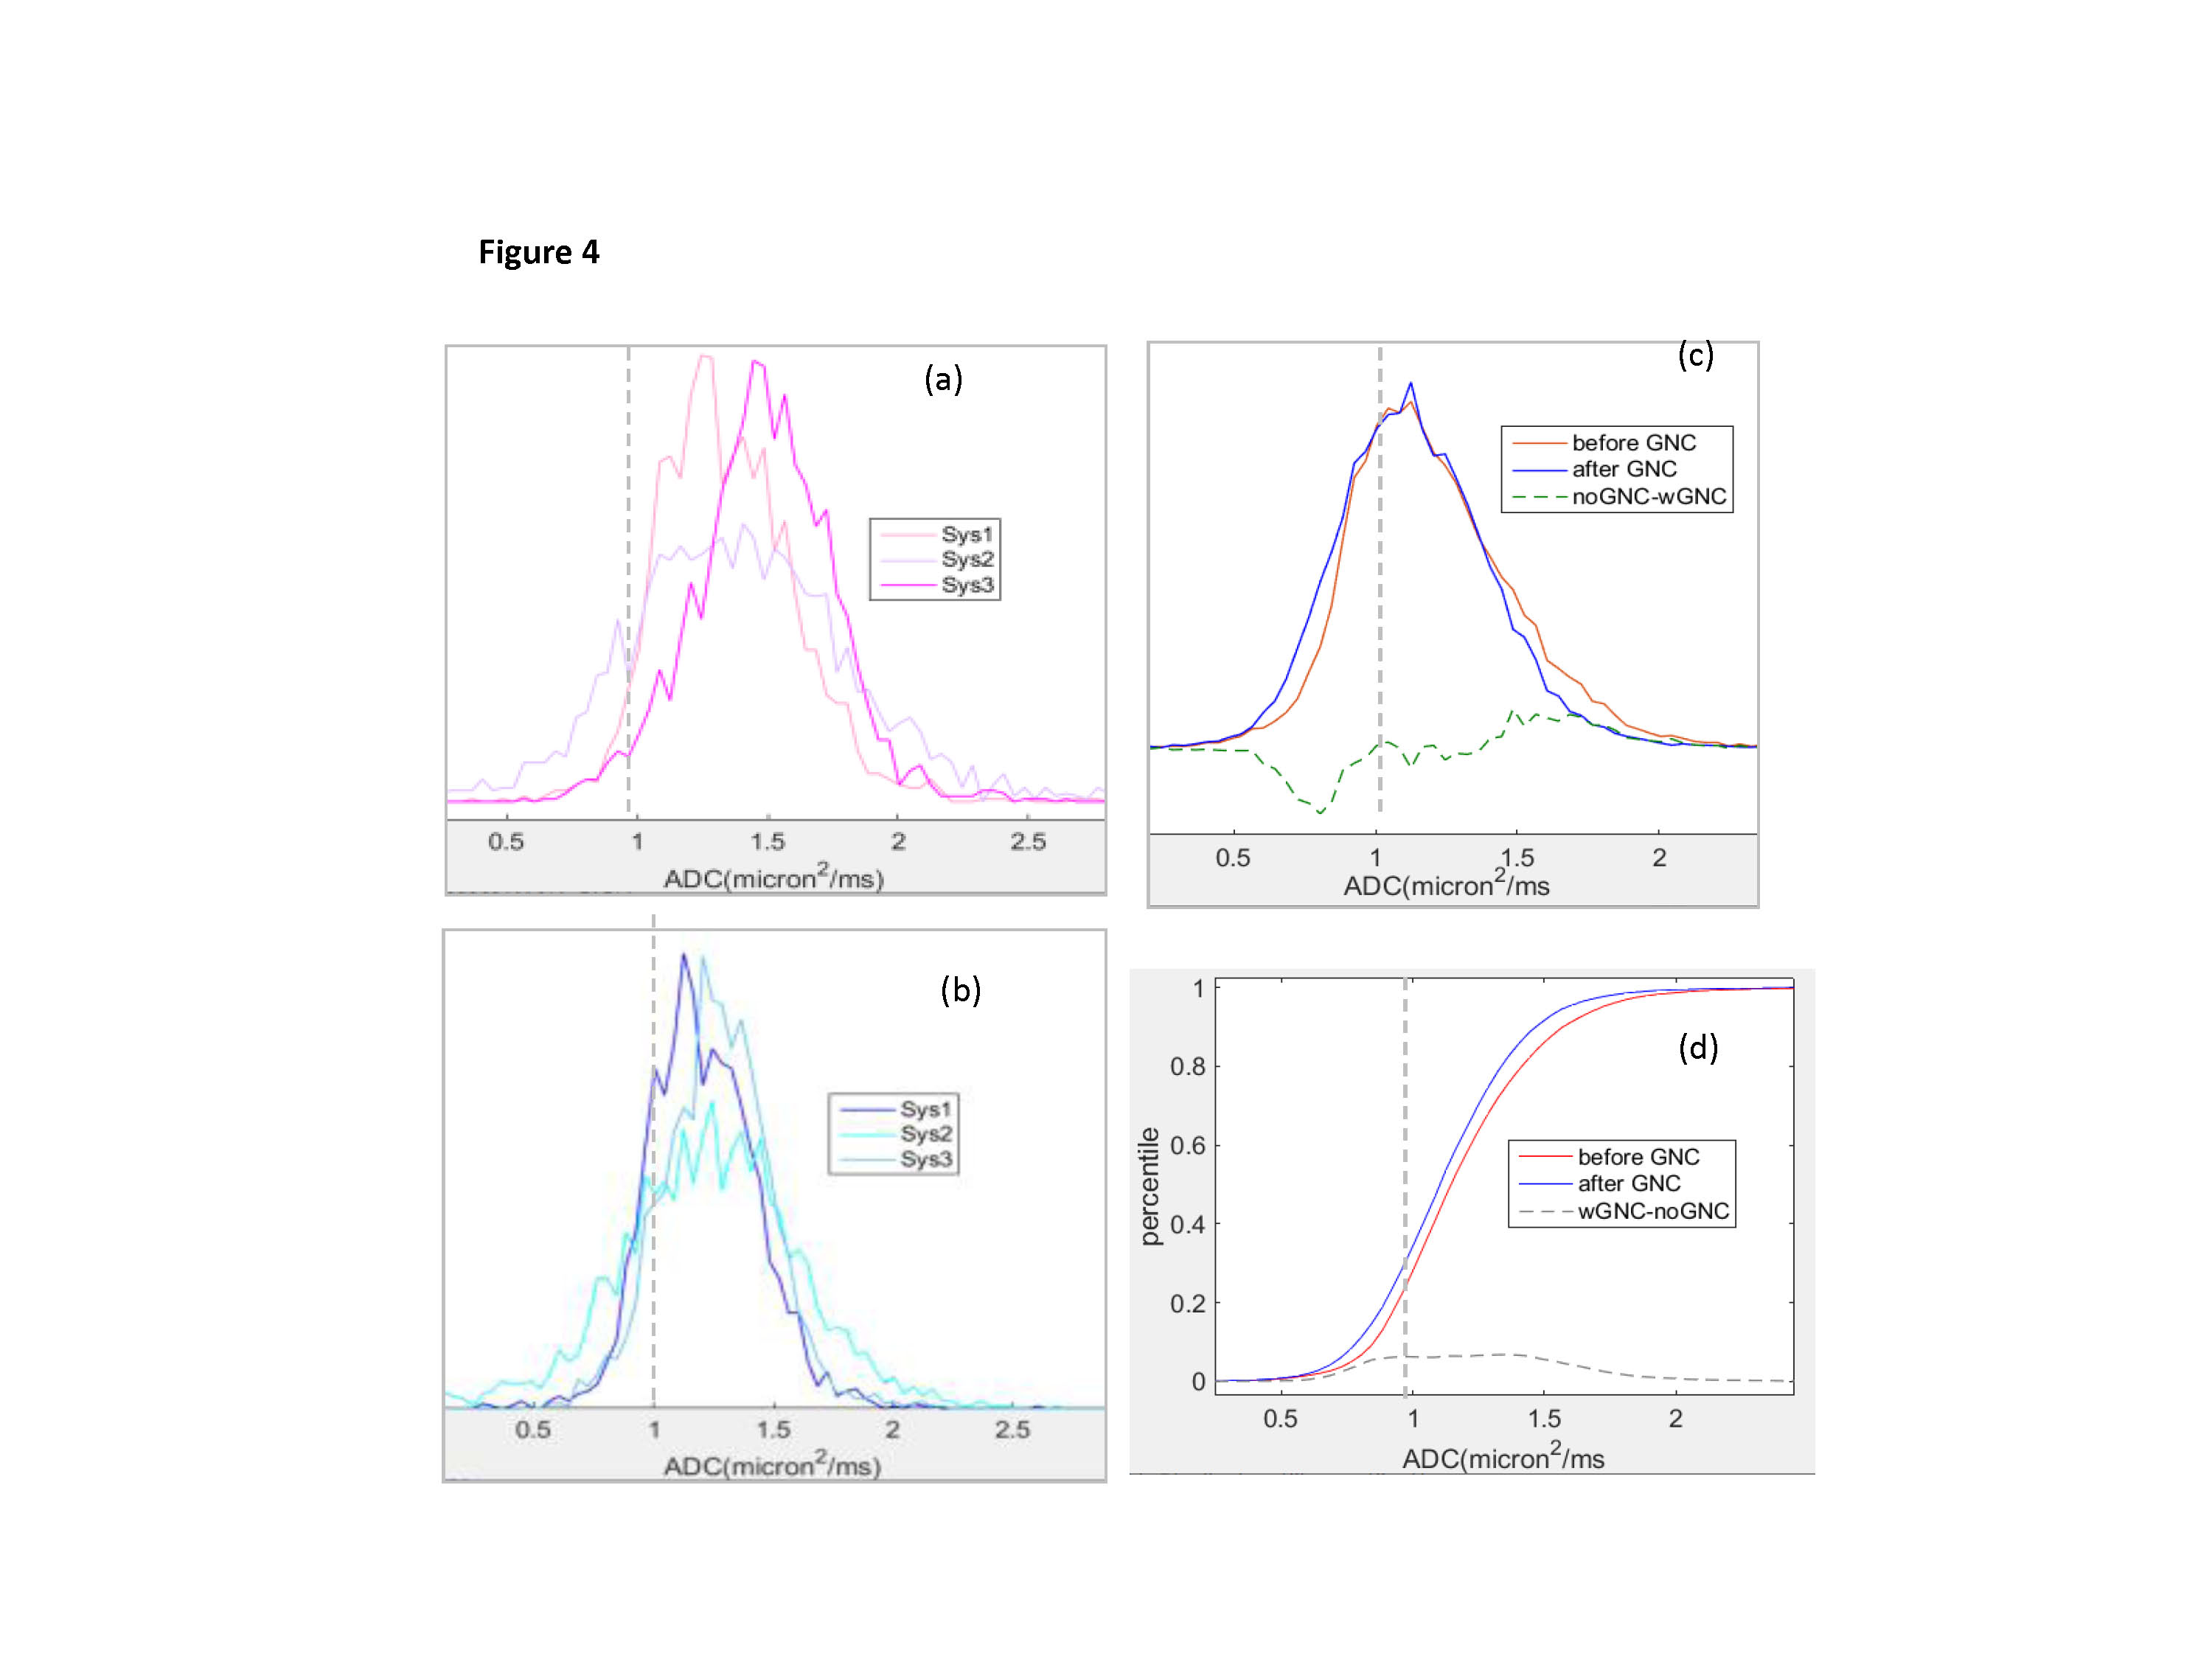
Figures 1 and 3 illustrate excellent performance of GNC for the quantitative DWI phantom scanned on three representative ACRIN6698 systems from 3 different vendors. Cross-system GNL non-uniformity induced mostly positive ADC bias that both shifted and misshaped phantom ADC histograms (Fig.3a). This led to apparent non-Gaussian broadening (-3% to 14% range) of system-averaged ADC histogram (Fig.3c, red) and substantial percentile deviation (Fig.3d), dashed) peaking at 50th percentile. GNC improved ADC accuracy for individual systems (Fig.1c,3b), and reduced the system-average histogram widths (down to ±5% range for 90th percentile (Fig.3c,d, blue). The median bias error was effectively eliminated (<1%) and systematic cross-platform variability along RL was reduced (< 2%).GNC effect on in vivo ADC histograms (Figure 4) is qualitatively similar to the phantom, showing intra-system narrowing and improved cross-system alignment. Compared to phantom, corrected ADC histograms of lesions exhibit 7-fold broader ADC ranges, reflective of tumor heterogeneity beyond residual non-GNL biases. The percentile differences are uniform between 10th and 80th indicating larger relative GNL error effect on lower percentiles (e.g., 0.3 volume for 20th). Percentile-dependent ADC threshold is notably altered by correction, shifting to lower values by ~0.1 μm2/ms. Consistent with previous single-platform observations4,5, GNL-induced DW nonuniformity led to substantial errors for off-center breast anatomy both in absolute ADC values and technical cross-system variability. Phantom GNC correction improved accuracy and reproducibility of ADC maps and confirmed adequate correction performance across all studied vendor gradient models. In vivo GNC for the studied subjects had notable effect on lower histogram percentiles and corresponding solid tumor ADC thresholds.
CONCLUSION
The study demonstrated feasibility of retrospective ADC correction for a multi-platform imaging trial. Notable correction impact on ADC histogram percentiles promises improvement of accuracy and reproducibility for diagnostic and prognostic thresholds sought by breast cancer imaging trials.Acknowledgements
National Institutes of Health Grants: R01CA190299, U01CA166104, U01CA225427, R01 CA132870References
1. Partridge SC, Zhang Z, Newitt DC, Gibbs JE, Chenevert TL, Rosen MA, Bolan PJ, Marques HS, Romanoff J, Cimino L, Joe BN, Umphrey HR, Ojeda-Fournier H, Dogan B, Oh K, Abe H, Drukteinis JS, Esserman LJ, Hylton NM, Team AT, Investigators IST. Diffusion-weighted MRI Findings Predict Pathologic Response in Neoadjuvant Treatment of Breast Cancer: The ACRIN 6698 Multicenter Trial. Radiology. 2018;289(3):618-27.
2. Bammer R, Markl M, Barnett A, Acar B, Alley MT, Pelc NJ, Glover GH, Moseley ME. Analysis and generalized correction of the effect of spatial gradient field distortions in diffusion-weighted imaging. Magn Reson Med. 2003;50(3):560-9
3. Malyarenko DI, Ross BD, Chenevert TL. Analysis and correction of gradient nonlinearity bias in apparent diffusion coefficient measurements. Magn Reson Med. 2014;71(3):1312-23.
4. Newitt DC, Tan ET, Wilmes LJ, Chenevert TL, Kornak J, Marinelli L, Hylton N. Gradient nonlinearity correction to improve apparent diffusion coefficient accuracy and standardization in the American College of Radiology Imaging Network 6698 breast cancer trial. J Magn Reson Imaging. 2015;42(4):908-19.
5. Malyarenko DI, Pang Y, Senegas J, Ivancevic MK, Ross BD, Chenevert TL. Correction of gradient nonlinearity bias in quantitative diffusion parameters of renal tissue with Intra Voxel Incoherent Motion. Tomography. 2015;1(2):145-51
6. Newitt DC, Zhang Z, Gibbs JE, Partridge SC, Chenevert TL, Rosen MA, Bolan PJ, Marques HS, Aliu S, Li W, Cimino L, Joe BN, Umphrey H, Ojeda-Fournier H, Dogan B, Oh K, Abe H, Drukteinis J, Esserman LJ, Hylton NM, Team AT, Investigators IST. Test-retest repeatability and reproducibility of ADC measures by breast DWI: Results from the ACRIN 6698 trial. J Magn Reson Imaging. 2019;49(6):1617-28.
7. Holz M, Heil SR, Sacco A. Temperature-dependent self-diffusion coefficients of water and six selected molecular liquids for calibration in accurate H-1 NMR PFG measurements. Phys Chem Chem Phys. 2000;2(20):4740-2.
Figures