4763
Validation of accuracy of fat-referenced PRFS thermometry on activated brown adipose tissue in rat in vivo1Shenzhen Institutes of Advanced Technology,Chinese Academy of Sciences, Shenzhen, China, 2Shenzhen Hospital of Guangzhou University of Chinese Medicine, Shenzhen, China
Synopsis
Brown adipose tissue (BAT) is a special adipose tissue which burns fat and dissipates energy in heat. As a result, heat production capacity of BAT is considered to represent its activity directly. In this study, we aimed to evaluate the accuracy of the proposed magnetic resonance fat-referenced PRFS method on BAT in vivo in rat after activated by Norepinephrine. The preliminary results show the PRFS based thermometry can describe the temperature change in activated BAT accurately, implying that magnetic resonance thermometry (MRT) is a useful tool to characterize the BAT activity.
Introduction
Since brown adipose tissue (BAT) burns fat and dissipates energy in heat after activated, temperature measurement would be a direct description of its function1. Proton resonance frequency shift (PRFS) thermometry has been verified as a noninvasive temperature measurement method, and it is very easy to implement in current clinical/preclinical MRI systems2. Previously, dual-step iterative temperature estimation (DITE) fat-referenced PRFS method has been demonstrated to measure the temperature change in BAT ex vivo using a 3.0T MRI3. In this study, a calibration study was carried out to evaluate the accuracy of the proposed DITE method on activated BAT in vivo in rat using a fluorescence fiber optical thermometer as reference on a clinical 3.0T MR. In comparison with the results from the thermometer, the measured average mean error and RMS error using the DITE method in the interscapular BAT (iBAT) of rat were −0.24ºC and 0.86ºC, respectively.Methods
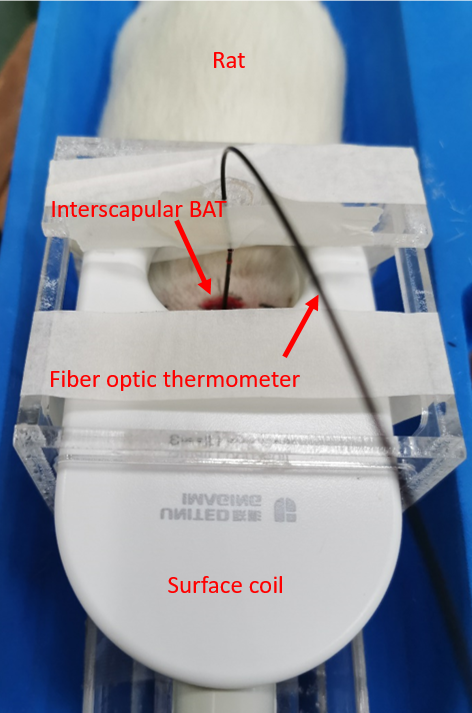
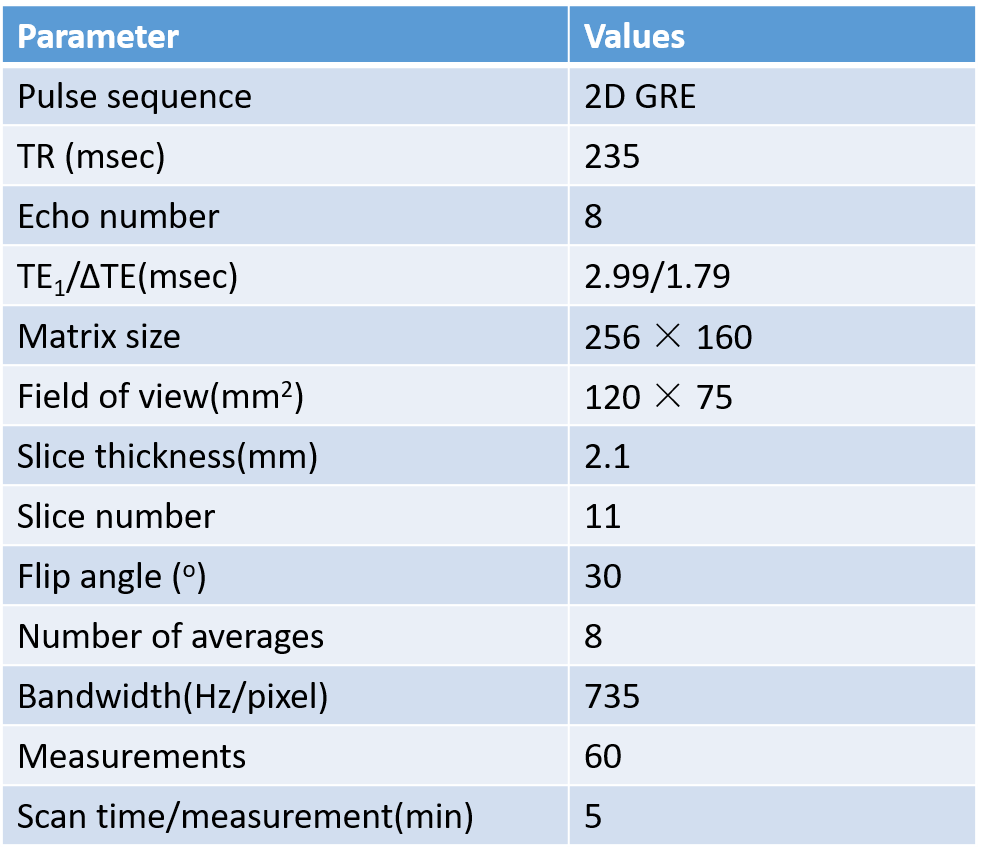
Two SD rats with age of 11 weeks were used in this study with IRB approval. Figure 1 shows the experimental setup of this study. Before the experiment, an MR-compatible fluorescence fiber optical thermometer was surgically inserted into iBAT location (Figure 1) with confirmation of MRI scans. During the experiment, the rats were anesthetized by isoflurane (in 100% oxygen with a flow of 1.5 L/min). The MRI scans were completed using a 3.0T scanner with maximal gradient = 100mT/m (uMR 790, Shanghai United Imaging healthcare, Shanghai, China) using an 8-echo gradient-echo sequence. A single-channel rat/mouse surface coil was used to acquire images. MRI parameters are summarized in Table1. The imaging slices were located in the interscapular area. The scan time of each measurement was 5 minutes and a total of 60 successive measurements were acquired. The total acquisition time was 300 minutes. BAT was activated by injecting NE in a dose of 2 mg/kg through intraperitoneal injection immediately after 12th measurement (60 minutes).The proposed fat-referenced DITE proton resonance frequency shift (PRFS) method was adopted to measure the temperature change in iBAT area. The accuracy was evaluated by comparing the results to the thermometer readings.
Results
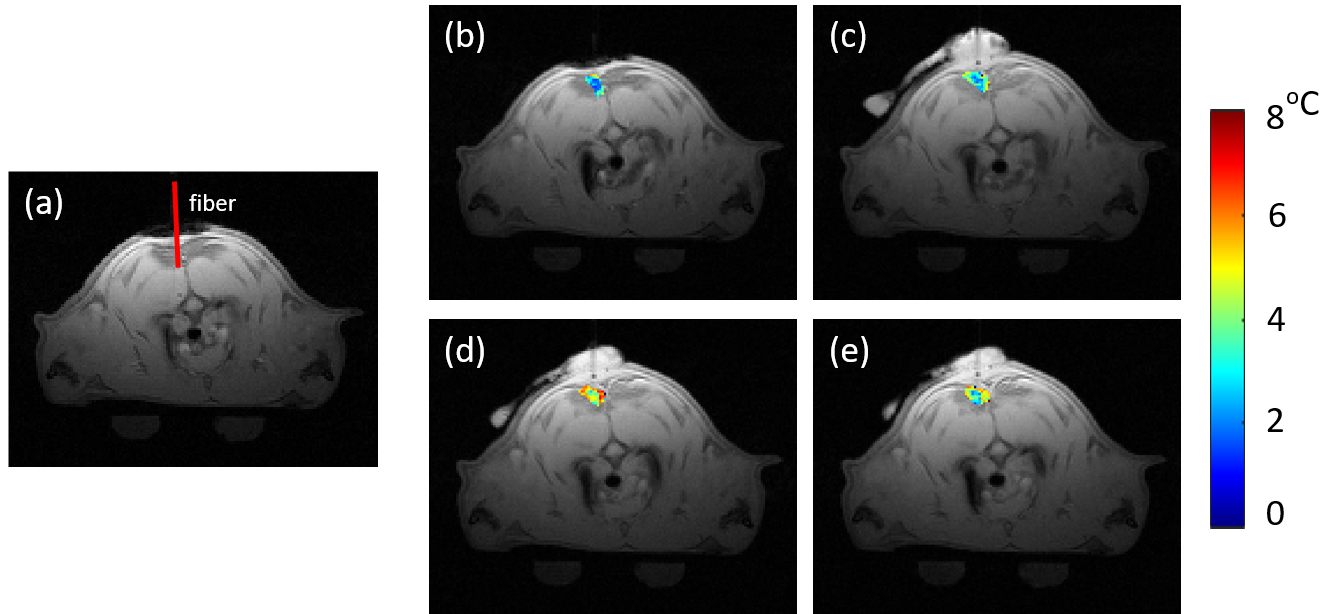
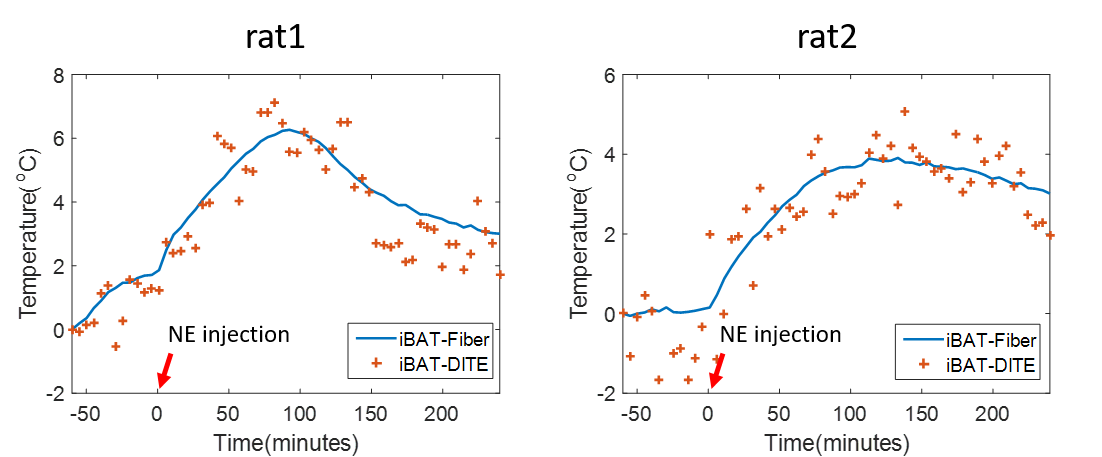
The temperature maps of one rat are shown in Figure 2. The first echo magnitude image of the first measurement is shown in Figure 2(a) with the location of the fiber optical thermometer. An iBAT ROI is drawn around the fiber optical thermometer. The distributions of the relative temperature change at the 5, 65, 125, 185 minutes after NE injection in the ROI are overlapped in the magnitude image and are shown in Figure 2(b-e). Figure 3 shows the mean temperature change curve in the ROI over all of the measurements for two rats. The temperatures estimated with the proposed DITE method were consistent with the values measured with the thermometer. The averaged mean error (ME) /RMSE for two rats were −0.36°C/0.88°C and -0.13°C/0.84°C, respectively, over all of the measurements within the ROI.Discussion and conclusions
In this study, the temperature change in iBAT after NE activation was successfully observed by the proposed DITE method and its accuracy was demonstrated by comparing to the results from fiber optic thermometer.There exists a little deviation between the measured temperatures by DITE method and fiber optical thermometer from FIG.3. The reason may be that the accuracy of DITE method was compromised by the motion of rat due to surgical operation. The physiological fluctuation may further induce the susceptibility change in the small iBAT area after NE injection, and thus yielding inferior results to the ex vivo experiment. Besides, the experiments were conducted on a clinical 3.0T MR scanner and the accuracy was limited due to the available SNR.
The present study demonstrated the accuracy of the proposed method of measuring the temperature change in activated BAT in vivo and it would promote the research of the heat product capacity of BAT noninvasively.
Acknowledgements
This research was supported by the Natural Science Foundation of China, No.61901462, and the China Postdoctoral Science Foundation, No.2019M650220.References
1. Sampath S C, Sampath S C, Bredella M A, et al. Imaging of brown adipose tissue: state of the art[J]. Radiology, 2016, 280(1): 4-19.
2. Zou C, Tie C, Pan M, et al. Referenceless MR thermometry-a comparison of five methods[J]. Physics in medicine and biology, 2017, 62(1): 1-16.3.
3. Cheng C, Zou C, Wan Q, et al. Dual‐step iterative temperature estimation method for accurate and precise fat‐referenced PRFS temperature imaging[J]. Magnetic resonance in medicine, 2019, 81(2): 1322-1334.
Figures