4751
Assessment of Metastatic Lymph Node in Head and Neck Cancer Using Simultaneous 18F-FDG-PET, DCE-MRI, and DWI
Jenny Chen1, Mari Hagiwara1, Artem Mikheev1, Henry Rusinek1, Jean Logan1, Elcin Zan1, and Sungheon Gene Kim1
1Department of Radiology, NYU School of Medicine, New York, NY, United States
1Department of Radiology, NYU School of Medicine, New York, NY, United States
Synopsis
Detecting malignant lymph nodes in the neck remains a challenge such that most patients still have to consider aggressive treatment including nodal dissection. In this study, we used positron emission tomography with 18F-fluorodeoxyglucose (18F-FDG PET), dynamic contrast enhanced magnetic resonance imaging (DCE-MRI), and diffusion weighted imaging (DWI) to assess head and neck cancer cases and consider the feasibility of using all three imaging methods in synergy to assess the regional lymph nodes.
Introduction
Accurate identification of nodal metastasis is a crucial step for treatment planning and evaluation of therapy response in head and neck cancer (HNC). Dynamic contrast enhanced (DCE)-MRI has been used to measure blood flow-related parameters (perfusion, permeability, vascular volume, etc.), in order to assess tissue microenvironment in cancerous regions. 18F-fluorodeoxyglucose (FDG) PET provides visualization of cancer cells which has abnormally high rates of glucose metabolism while diffusion weighted imaging (DWI) provides visualization of tumor lesions with restrict diffusion. This study aims to use all three imaging methods by obtaining quantitative DCE-MR and FDG PET kinetic parameters and apparent diffusion coefficient (ADC) to assess the nodal metastasis in HNC.Methods
This study recruited HNC patients (n=23) who were scheduled for node dissection surgery. Within one week before their planned surgery, each patient had one research PET/MR scan. This was done with a whole body 3T PET/MR scanner (Biograph mMR, Siemens Healthcare). Using the conventional neck lymph node levels, the locations of removed lymph nodes were noted during the dissection surgery so multi-parametric MRI measures can be compared to pathology by lymph node levels.The PET scan started 1 minute before the injection of PET tracer (10 mCi of 18F-FDG) and was acquired dynamically for 60 minutes. The attenuation correction map was generated using T1-weighted Dixon gradient-echo sequence water and fat images and was used to reconstruct 127 axial slices with 344x344 matrix at 2x2x2 mm3 voxel size on the vendor platform. Fractional uptake value (ki) of tumor regions of interest (ROIs) were estimated using the two compartment model 1 in FireVoxel (https://wp.nyu.edu/firevoxel) with the individual specific arterial input function (AIF) automatically generated using the principal component analysis (PCA) method 2.
During PET acquisition, DCE-MRI scan was acquired simultaneously using a golden-angle radial 3D gradient echo sequence with TR/TE = 3.6/1.7 ms, FA=10deg, Res=1x1x2mm. The baseline was acquired for 1 minute followed by injection of a dose of GD-DTPA (1mM/kg body weight) at 1mL/s into an antecubital vein then a saline flush, after which the scan continued for 9 minutes. The dynamic images were reconstructed using the GRASP method 3. Plasma volume fraction (vp), interstitial volume fraction (ve), and permeability-surface area product (PS) of ROIs were estimated for each ROI using two-compartment model 4 in FireVoxel with the arterial input function (AIF) automatically generated using PCA 2.
DWI data were also acquired during the PET acquisition using a twice-refocused spin echo sequence with echo planar readout and b-values ranging from 200 to 800; a total of 10 images including the b0 image. Apparent diffusion coefficient (ADC) image was generated using FireVoxel.
Due to long scan time, there were inevitable motion and misalignment between datasets, so image coregistration across and within modalities is essential to making sure ROIs cover the same areas in each image. DCE-MRI images were coregistered to a specific frame after the baseline which is referred to as the fixed frame using SimpleITK’s SimpleElastix (https://simpleelastix.github.io/) with parameters from its database (http://elastix.bigr.nl/wiki/index.php/Par0048). DWI volumes were registered to the fixed DCE-MRI frame using SimpleITK to reslice DWI to match DCE-MRI voxel dimensions and to register each DWI with metric as mutual information, optimizer as regular step gradient descent, and interpolator and transform as b-spline. PET images were registered to the fixed DCE-MRI using FireVoxel.
Results
Figure 1 shows an example of a case with PET and DWI images aligned to the DCE-MRI fixed frame. Representative PET and DCE-MRI data and their kinetic model fits are shown in Figure 2. The pharmacokinetic model analysis of dynamic PET data shows that the fractional uptake in metastatic regions is significantly higher (p<0.001) (Fig.3). In DCE-MRI there was statistical significance in vp where the mean of vp is lower in metastatic nodes than that of normal nodes (p=0.0384). Additionally, ve and PS are both significantly lower in metastatic nodes (p<0.001). DWI data show that there is no statistical significance for higher 10th percentile and median diffusivity in metastatic areas. However, there is a significantly higher 90th percentile diffusivity in metastatic nodes (p=0.0234). The results are summarized in Table 1.Discussion and Conclusion
The kinetic parametric data from PET and DCE along with ADC from DWI were successfully obtained and used to show how individual parameters can be used to classify metastatic nodes. Future studies can further explore the reproducibility of these results and obtain voxel-by-voxel parametric maps for measurement of tumor heterogeneity and their association with histological properties.Acknowledgements
NIH grants R21CA188217, R01CA160620, R01CA219964, UG3CA228699References
- Sokoloff, Louis, et al. "The [14C] deoxyglucose method for the measurement of local cerebral glucose utilization: theory, procedure, and normal values in the conscious and anesthetized albino rat." Journal of neurochemistry 28.5 (1977): 897-916.
- Sanz‐Requena R, Prats‐Montalban JM, Marti‐Bonmati L, et al. Automatic individual arterial input functions calculated from PCA outperform manual and population‐averaged approaches for the pharmacokinetic modeling of DCE‐MR images. J Magn Reson Imaging. 2015;42(2):477‐487.
- Feng L, Grimm R, Block KT, Chandarana H, Kim S, Xu J, Axel L, Sodickson DK, Otazo R. Golden-angle radial sparse parallel MRI: combination of compressed sensing, parallel imaging, and golden-angle radial sampling for fast and flexible dynamic volumetric MRI. Magn Reson Med 2014;72(3):707-717.
- Flouri, D. , Lesnic, D. and Sourbron, S. P. (2016), Fitting the two‐compartment model in DCE‐MRI by linear inversion. Magn. Reson. Med., 76: 998-1006.
Figures
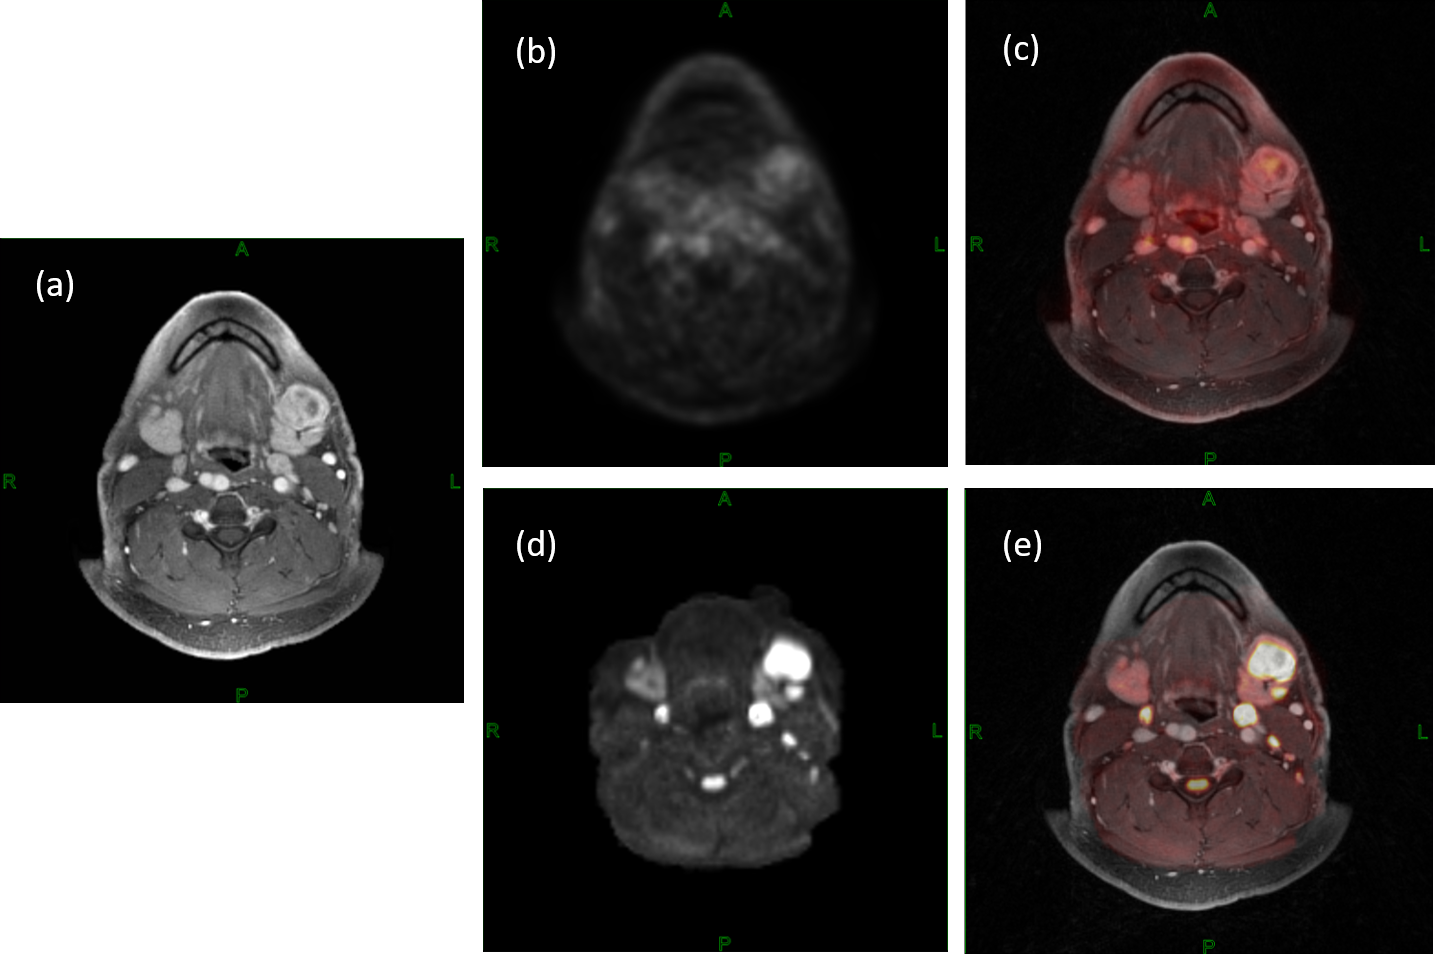
Figure 1. An
example of a 50-year-old male patient with floor of the mouth squamous cell
carcinoma. A left level-1 metastatic lymph node can be detected in (a) DCE-MRI,
(b) 18F-FDG-PET, (c) PET activity map overlaid on DCE-MRI, (d) DWI and (e) DWI
overlaid on DCE-MRI
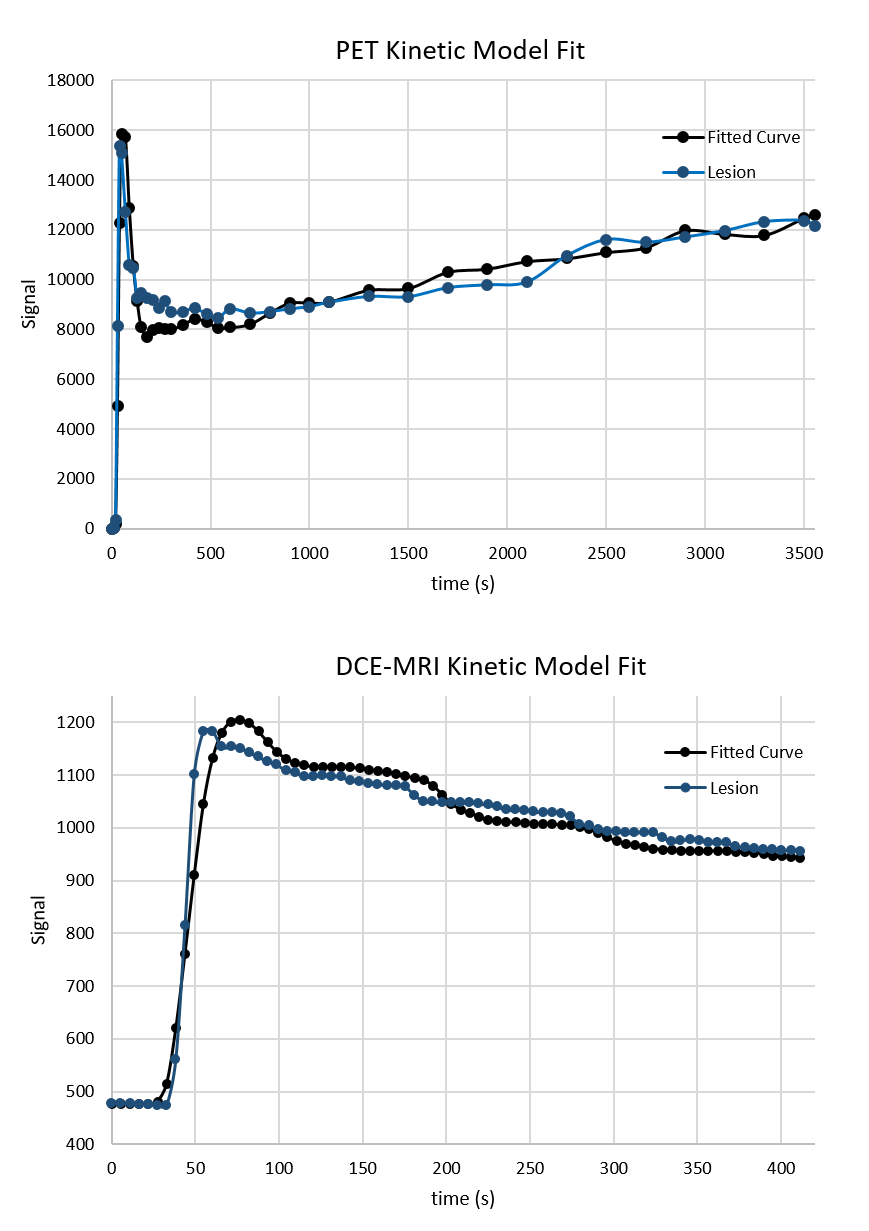
Figure 2.
Examples of PET (top) and DCE-MRI (bottom) kinetic model fits for a ROI
covering the left level-1 metastatic lymph node of a 50-year-old male patient.
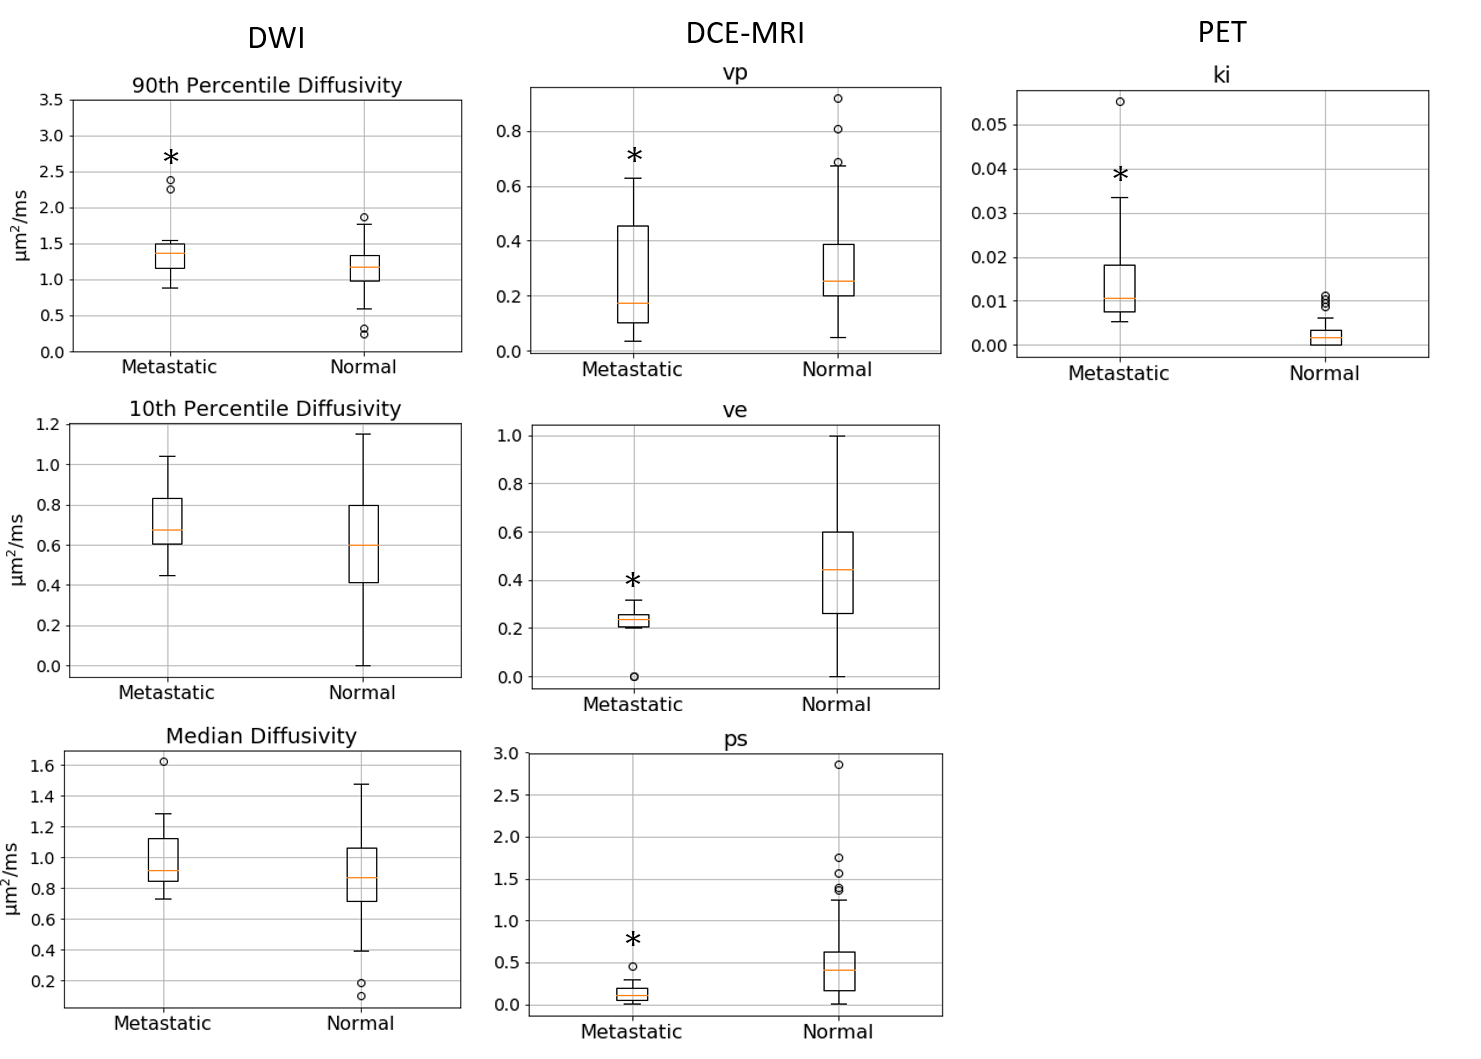
Figure 3.
Box-whisker plot summary of pharmacokinetic analysis of dynamic PET and DCE-MRI
data. DWI column shows data of 90th and 10th percentile and
median diffusivity within each ROI DCE-MRI column shows estimated vp,
ve, and ps for each ROI, PET column shows ki for each ROI.
* represents a statistical significance where p<0.05 from Mann-Whitney test.
The p-values can be found in table 1.
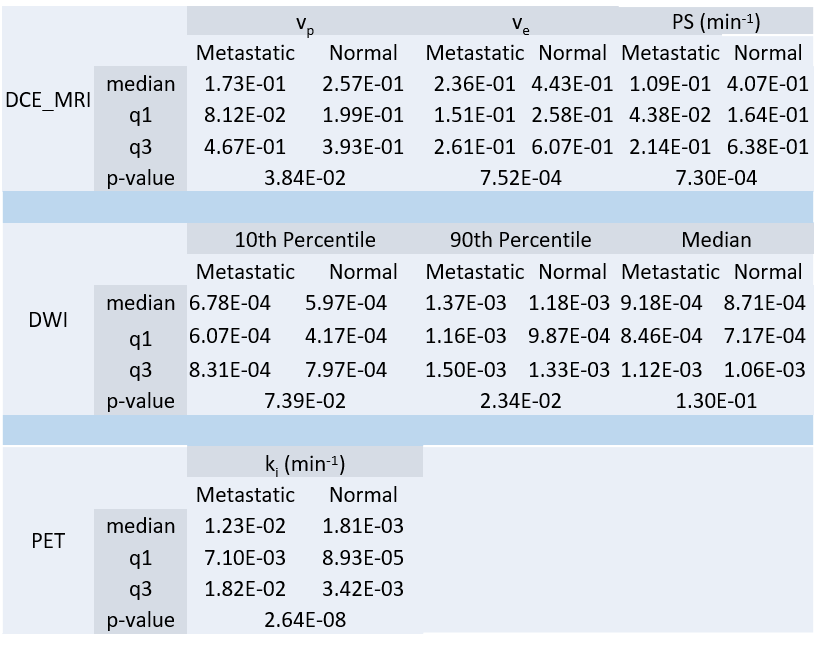
Table 1. Summary
of the median, first quartile (q1), third quartile (q3), and p-value of metastatic
and normal ROI kinetic parameters (DCE-MRI and PET). DWI summary shows median,
first quartile, third quartile, and p-value of 10th percentile, 90th
percentile, and median voxel-by-voxel ADC in metastatic and normal ROIs.