4747
3D T2 mapping with dictionary-based matching in simultaneous PET/MR: a preliminary study in prostate cancer patients1Biomedical Engineering Department, School of Biomedical Engineering and Imaging Sciences, King's College London, London, United Kingdom, 2Siemens Healthcare Limited, Frimley, United Kingdom, 3Cancer Imaging Department, School of Biomedical Engineering and Imaging Sciences, King's College London, London, United Kingdom, 4Siemens Healthcare GmbH, Erlangen, Germany
Synopsis
In this work we aim to show the clinical feasibility of quantitative 3D T2 mapping for tissue characterization and with the potential for prostate cancer detection. We implemented a 3D T2-prepared multi-shot gradient echo sequence and a dictionary matching approach for quantitative T2 analysis. We tested it in three biopsy-proven prostate cancer patients who underwent a simultaneous 18F-Choline PET/MR scan. Quantitative T2 matched literature values and we observed reduced T2 in lesions compared to normal peripheral zone tissue even in only moderately differentiated cancers (Gleason 3+4). Lesion location matched uptake of simultaneously acquired 18F-Choline PET.
Introduction
Simultaneous PET/MR is a valuable tool for tissue characterisation and has shown potential for prostate cancer detection.1-3 While PET-SUV images are inherently quantitative, in conventional multiparametric MRI (mpMRI) only EPI-ADC is quantitative. However, accurate lesion localization is challenging due to the low spatial resolution of PET and the typically observed distortion in EPI-ADC. In contrast, T2-weighted (T2w) images offer high resolution and are non-distorted; however, they are limited by being 2D and qualitative. We previously proposed a rapid 3D T2 mapping method for prostate imaging.4 In this work, we have optimized this method to make it more robust for clinical use and evaluated its clinical utility by applying it to a cohort of biopsy-proven prostate cancer patients who underwent a simultaneous 18F-choline PET/MR scan, with the aim to achieve high-quality, non-distorted, three-dimensional T2 maps.Methods
Following approval by our local institutional review board and written informed consent, 7 male subjects were scanned on a 3T PET/MR scanner (Biograph mMR, Siemens Healthcare, Erlangen, Germany): 4 age-matched healthy controls (mean age 68 ± 3 years), and 3 biopsy-proven prostate cancer patients who underwent a 18F-Choline PET/MRI scan (mean age 65 ± 4 years).Data acquisition. The previously proposed 3D T2 mapping method generates quantitative T2 maps via matching of T2w images acquired with a T2-prepared multi-shot balanced steady state free precession (bSSFP) sequence to a dictionary of simulated signals.4 To overcome the limitations of bSSFP (banding artefacts, “dark rim” artefacts, and higher SAR), in this work we replaced the bSSFP with a spoiled gradient echo readout (MS-T2P-GRE). MS-T2P-GRE data were acquired using a custom fully sampled 3D Cartesian k-space trajectory with centric sector-like profile ordering and the following imaging parameters: 78 RF pulses per shot, shot duration (TR) = 1000 ms, flip angle = 10o, TR/TE = 5.0/2.5 ms, 400 Hz/pixel bandwidth, transversal orientation, 256x168x30 matrix, 1.6x1.6x5 mm3 resolution (and 1.6mm-isotropic in one example case), T2prep-TE = 0, 90, 150 ms, acquisition time per volume = 1:57 min. MS-T2P-GRE was acquired in addition to the clinical standard mpMRI scan which included high-resolution 2D T2w-TSE and 2D diffusion-weighted EPI (b-values = 50, 800, extrapolated 1500 s/mm2). Simultaneous PET imaging was performed 45-50 minutes after injection of 18F-Choline (mean 319 MBq).
Data analysis. 3D T2 maps were obtained from the set of three T2w images using the simulation-based dictionary matching approach proposed in 4. T2 estimates were evaluated in the following regions of interest: peripheral zone healthy (PZH), cancer (PZCa), central gland (CG), and muscle (M). The appearance of the PZCa lesions was compared with highest Gleason score from prostatectomy specimens, 18F-Choline SUVmax uptake, 2D T2w-TSE, clinical EPI-ADC map, and proposed 3D T2 map.
Results and Discussion
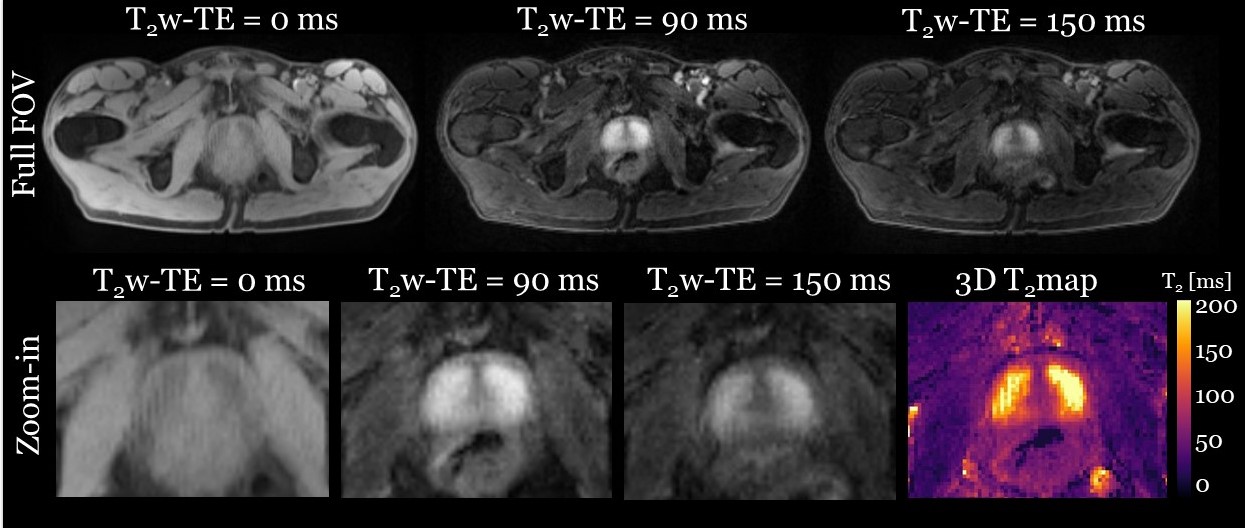
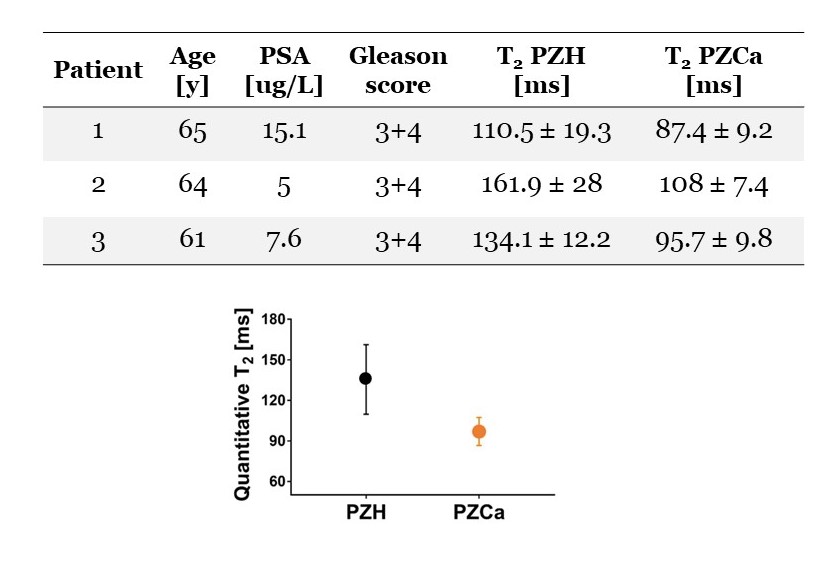
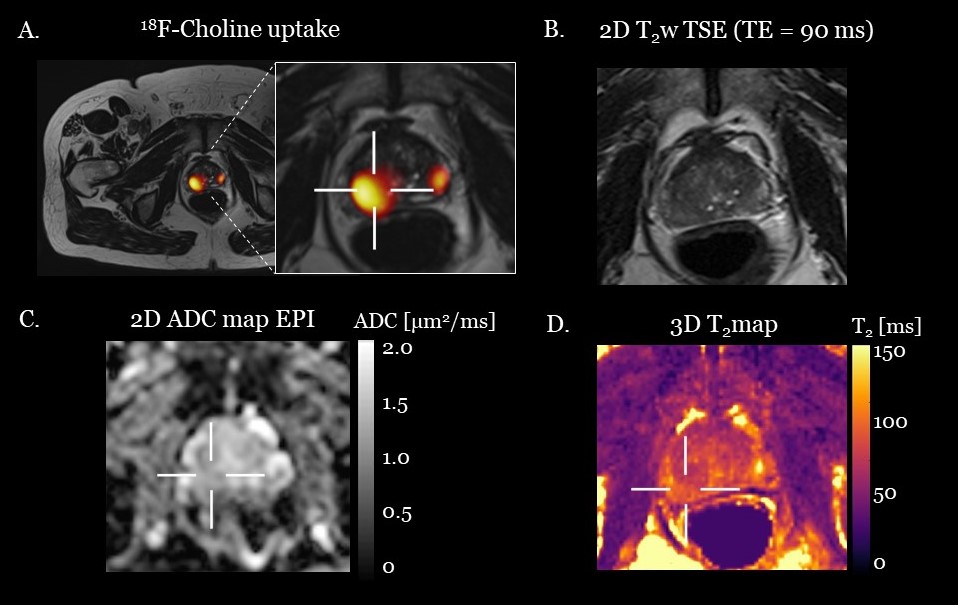
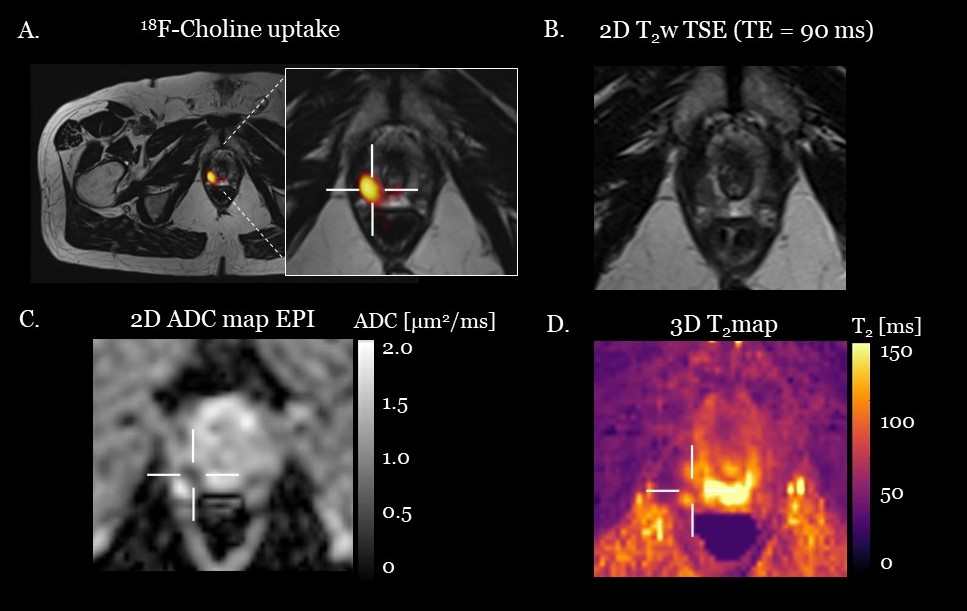
With the proposed sequence, good image quality was achieved for all 7 scans; for one healthy control, a representative set of T2w images is shown in Figure 1 alongside the corresponding 3D T2 map. T2 values estimated with the proposed dictionary-matching approach in PZH, CG, and muscle for all healthy subjects were 173.3 ± 24.4, 87.9 ± 12.0, and 33.9 ± 6.6 ms respectively, in good agreement with reported literature values. 5-7For the patient study, clinical results are shown in Figure 2. Figures 3 and 4 show two representative patient cases. We observed increased 18F-Choline uptake where the main lesion was located. EPI-ADC was lower at the lesion location. However, accurate spatial location was not possible on either PET or EPI-ADC because of low resolution of PET and distortion of EPI-ADC map. On the clinical T2w images, slightly hypointense signal was found. On the proposed 3D T2 map, the lesion could accurately be located for all patients. In the lesions we observed reduced T2 of 93.4 ± 12.3 ms compared to normal 133.1 ± 26 ms in our cohort of patients with Gleason score 3+4, moderately differentiated cancers.
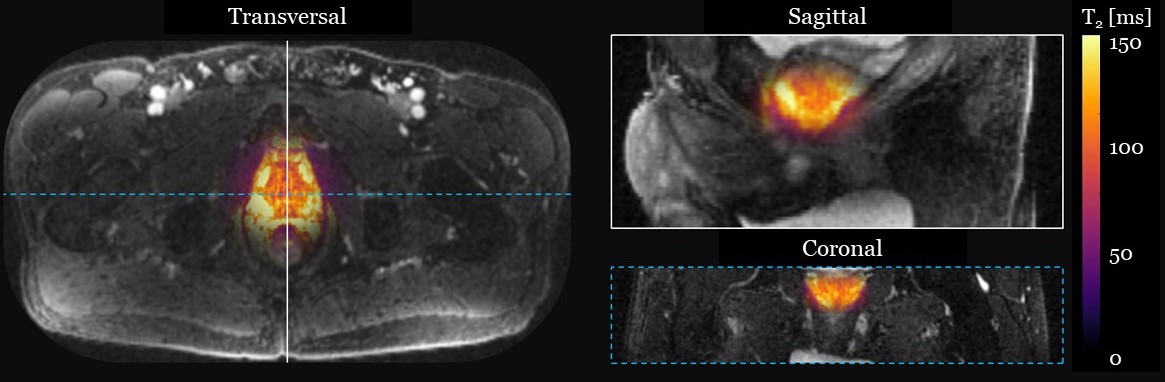
The potential of isotropic high-resolution 3D T2 mapping is demonstrated for a healthy subject in Figure 5, which illustrates axial, sagittal and coronal views of the entire prostate gland.
Conclusion
The proposed framework combines a multi-shot T2-prepared sequence and signal simulations to achieve high-quality, non-distorted, 3D T2 maps that are acquired simultaneously with a PET scan. Our quantitative T2 results in patients show the potential to identify prostate cancer lesions based on reduced T2 even in only moderately differentiated cancer.Acknowledgements
This work was supported by the King’s College London & Imperial College London EPSRC Centre for Doctoral Training in Medical Imaging [EP/L015226/1]; the Wellcome EPSRC Centre for Medical Engineering at Kings College London [WT 203148/Z/16/Z]; the National Institute for Health Research (NIHR) Biomedical Research Centre based at Guy’s and St Thomas’ NHS Foundation Trust and King’s College London; the King’s Health Partners Research and Development Challenge Fund; TOHETI; NIHR BRC; GSTT/KCL BRC; CRUK/EPSRC Cancer Centre; Siemens Healthineers; Theragnostics Ltd. The views expressed are those of the authors and not necessarily those of the NHS, the NIHR or the Department of Health.References
1. Bailey DL, Pichler BJ, Gückel B, Barthel H, Beer AJ, Bremerich J, et al. Combined PET/MRI: Multi-modality Multi-parametric Imaging Is Here: Summary Report of the 4th International Workshop on PET/MR Imaging; February 23-27, 2015, Tubingen, Germany. Mol Imaging Biol. 2015;17: 595–608.
2. Bashir U, Mallia A, Stirling J, Joemon J, MacKewn J, Charles-Edwards G, et al. PET/MRI in Oncological Imaging: State of the Art. Diagnostics. 2015;5: 333–357.
3. Spick C, Herrmann K, Czernin J. 18F-FDG PET/CT and PET/MRI perform equally well in cancer: evidence from studies on more than 2300 patients. J Nucl Med. 2016;57(3):420–430.
4. Roccia E, Vidya Shankar R, Neji R, Cruz G, Munoz C, Botnar R, et al. Accelerated 3D T 2 mapping with dictionary-based matching for prostate imaging. Magn Reson Med. 2018;81: 1795–1805.
5. Liu W, Turkbey B, Senegas J, Remmele S, Xu S, Kruecker J, et al. Accelerated T2 mapping for characterization of prostate cancer. Magn Reson Med. 2011;65: 1400–1406.
6. Dregely I, Margolis DAJ, Sung K, Zhou Z, Rangwala N, Raman SS, et al. Rapid quantitative T2 mapping of the prostate using three-dimensional dual echo steady state MRI at 3T. Magn Reson Med. 2016;76: 1720–1729.
7. Chatterjee A, Devaraj A, Mathew M, Szasz T, Antic T, Karczmar GS, et al. Performance of T2 Maps in the Detection of Prostate Cancer. Acad Radiol. Elsevier Inc.; 2019;26: 15–21.
Figures