4746
Quantitative mapping for prostate cancer detection in the peripheral zone using synthetic MRI1Department of Medical Imaging, Sun Yat-sen University Cancer Center, Guangzhou, China, 2Department of Radiology, Sun Yat-Sen University Cancer Center, Guangzhou, China, 3MR Research, GE Healthcare, Beijing, China
Synopsis
Our study aims to develop and evaluate an examination using Synthesis MRI based T1, T2, and proton density (PD) mapping for multiparametric characterization of prostate cancer. T1, T2 and PD mapping exhibited excellent differential diagnosis of normal prostate, prostatitis and Prostate cancer (PCa) and discrimination performance was better than ADC. T1, T2 and PD mapping of synthetic quantitative MRI seem to be a potential method in PCa detection. It may aid prostate biopsy by means of guiding and controlling localized therapy delivery. This preliminary study showed that synthetic MRI has a potential in the detection and characterization of PCa.
INTRODUCTION
Prostate cancer (PCa) is the second most frequently diagnosed cancer and the sixth major cause of death in the male population.1 Multiparametric MRI is increasingly used and has shown promising detection and assessment of PCa.2 However, conventional prostate MRI is limited in PCa detction due to its similar expression to benign tissues. Recently-introduced synthetic MRI (SyMRI) technique possesses acquisition of the quantitative physical properties3. Our study aimed to evaluate the usefulness of synthetic MRI in discrimination of the prostate cancer in the peripheral zone.METHODS
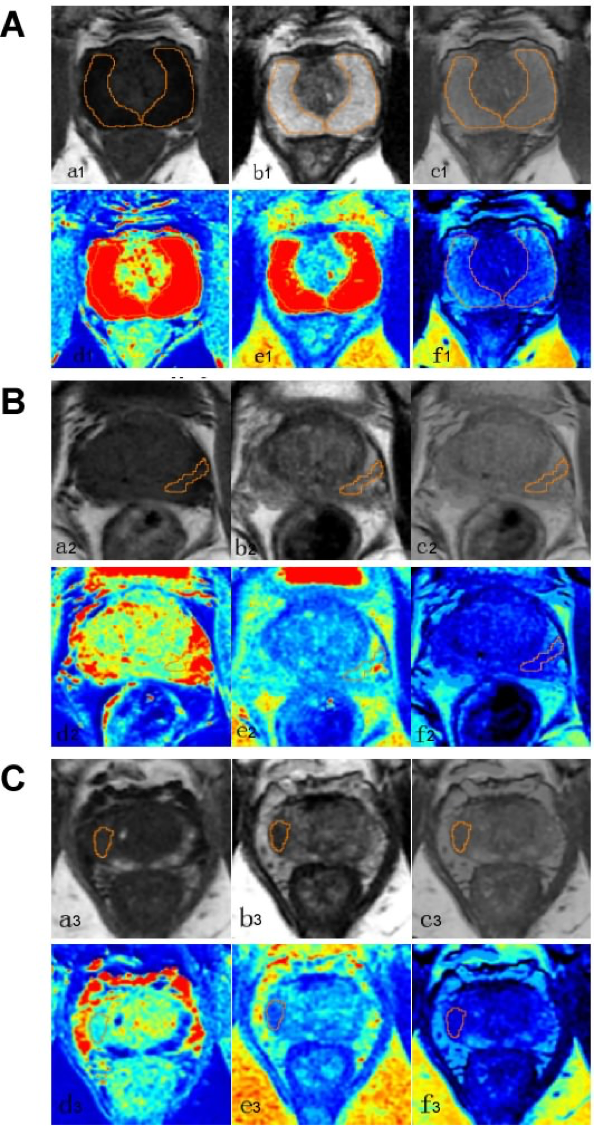
With the approval of the Ethics Committee, 36 patients with PCa in the peripheral zone, 47 patients with prostatitis confirmed by biopsy before radical surgery, and 24 normal prostate subjects from March to September 2019 were enrolled in this study. All participants underwent magnetic resonance image compilation (MAGiC) sequence imaging and diffusion weighted imaging (DWI) on routine multiparametric MRI at 3.0T (Signa Pioneer, GE Healthcare) to obtain T1 mapping, T2 mapping, proton density(PD) mapping and apparent diffusion coefficient (ADC) value. ROIs were delineated along the lesion contours in the prostate by two radiologists and the areas were correlated with available pathology results. The diagnostic performance, such as area under the curve (AUC), sensitivity, and specificity, were analyzed. Statistically significant difference P values were set at less than or equal to 0.01.RESULTS
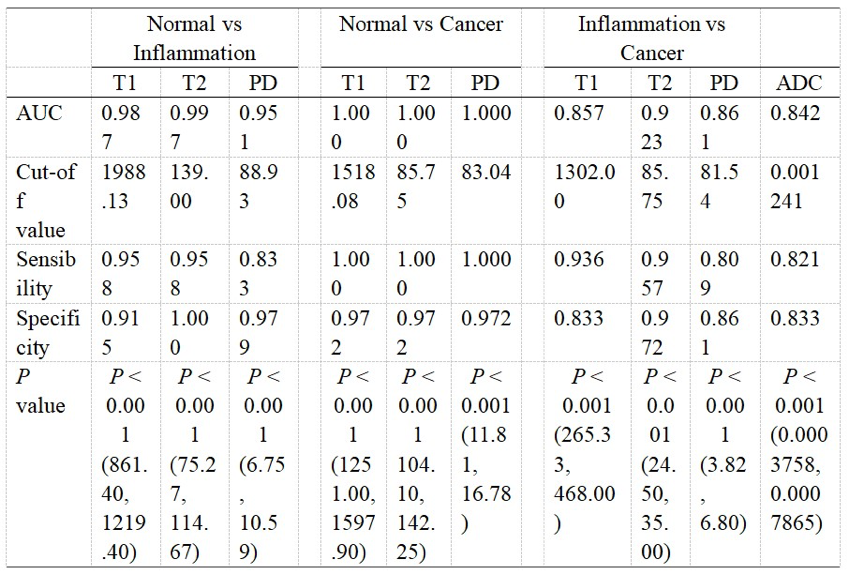
Significantly lower T1, T2 and PD values in prostatitis and PCa tissues than normal prostate samples were found (p < 0.0001) (Figure 2). Better than ADC, T1, T2 and PD mapping exhibited excellent differential diagnosis of normal prostate, prostatitis and PCa with good AUC (Figure 3). The T1, T2 and PD values were positively associated with ADC (P<0.001) (Figure 4).DISCUSSION
Despite extensive research to help improve the accuracy in MRI diagnosis of PCa, many uncertainties still remain. In our study, an approach to effectively identify patients at high-risk PCa with synthetic quantitative MRI, T1, T2 and PD mapping. The scanning time of traditional T1 mapping and T2 mapping sequences is known to be more than ten minutes,4 and image resolution are lower than desired T1WI and T2WI due to limited scanning time, leading to the limitation of clinical practicability and accuracy. The MAGiC sequences only takes five minutes to acquire stable multiparametric values and various weighted images with offline adjustable imaging parameters, which may contribute to unitary data establishment at multicenter. Besides, the performance of T1, T2 and PD maps in the PCa detection is better than a routinely-used quantitative ADC map,5 which has not been previously reported.CONCLUSION
This preliminary study showed that synthetic quantitative T1, T2 and PD maps has a potential in the detection and characterization of PCa. It could be an image-guided prostate biopsy to guide and control delivery of localized therapy, thereby improving therapeutic effectiveness and survivals.Acknowledgements
No acknowledgement found.References
1. American Cancer Society. Cancer facts and figures 2008.Atlanta, GA: American Cancer Society, 2008.
2. Badve C, Yu A, Rogers M, et al. Simultaneous T1 and T2 brain relaxometry in asymptomatic volunteers using magnetic resonance fingerprinting. Tomography 2015; 1(2):136–144.
3. Wolfgang Krauss, Martin Gunnarsson, Margareta Nilsson, Per Thunberg.Conventional and synthetic MRI in multiple sclerosis: a comparative study.Eur Radiol (2018) 28:1692–1700.
4. Bojorquez J Z , Bricq, Stéphanie, Brunotte F , et al. A novel alternative to classify tissues from T1 and T2 relaxation times for prostate MRI[J]. Magnetic Resonance Materials in Physics, Biology and Medicine, 2016, 29(5):777-788.
5. Hambrock T, Hoeks C, Hulsbergen-van de Kaa C, et al. Prospective assessment of prostate cancer aggressiveness using 3-T diffusion-weighted magnetic resonance imaging-guided biopsies versus a systematic 10-core transrectal ultrasound prostate biopsy cohort. Eur Urol. 2012; 61(1):177–184.
Figures