4745
Extending an MR elastography based method for inferring total tumour pressure to multiple organs1School of Biomedical Engineering and Imaging Sciences, King's College London, London, United Kingdom, 2Department for Diagnostic Physics, Oslo University Hospital, Oslo, Norway, 3INSERM, University Paris Diderot, Paris, France, 4Department of Radiology, Hopital Universitaire Beaujon, Clichy, France, 5Department of Research Oncology, Guy's and St Thomas' NHS Foundation Trust, London, United Kingdom, 6Radiology and Nuclear Medicine, Academic Medical Center, Amsterdam, Netherlands, 7Division of Cancer Studies, King's College London, London, United Kingdom, 8Department of Biomedical Engineering and Cardiac Surgery, University of Michigan, Ann Arbor, MI, United States
Synopsis
Both interstitial fluid pressure and solid pressure of tumours have been shown to correlate with decreased efficacy of treatment and potentially with poorer prognosis. This increased fluid and solid pressure causes tumours to push on surrounding tissue, leading to changes in tissue stiffness due to nonlinear effects. A previously presented method relates the magnitude of these changes, as measured by MR elastography, to pressure using a nonlinear biomechanical model. Here, this method is extended for use on both preliminary liver and brain data which show correlation between reconstructed pressure and invasion and tumour type, respectively.
Introduction
Tumours often exhibit increased fluid and solid pressure due to factors such as vessel leakiness, interstitial fibrosis, and growth of the tumour itself.1-3 Both increased fluid and solid pressure lead to decreased efficacy of treatment and there is some evidence that these correlate with poor prognosis, due to promotion of tumour progression and increased invasion.1-4 Fluid pressure can be measured invasively by wick-in-needle1 and the solid pressure of tumours has been measured after extraction2, but clearly noninvasive measurement of tumour pressure would be of value.A method to noninvasively measure total tumour pressure (sum of fluid and solid components) has been previously presented by our group.5 This method uses MR elastography (MRE) to measure changes in stiffness in the tissue surrounding the tumour, due to the tumour pushing against the tissue. The magnitude of these stiffness changes is able to be correlated with pressure through the use of nonlinear biomechanical models. The method has been previously validated on both simulation data and phantom experiments. It has also been applied to breast cancer cases which indicate the reconstructed pressure values correlate with lymphovascular invasion.6 Here, the method is applied to additional preliminary MRE cancer data in both liver and brain. In liver, we find an indication of a similar correlation as with breast, in that tumour with histologically found microvascular invasion give higher values of reconstructed pressure. In brain, there is indication of a correlation between tumour type and reconstructed pressure.
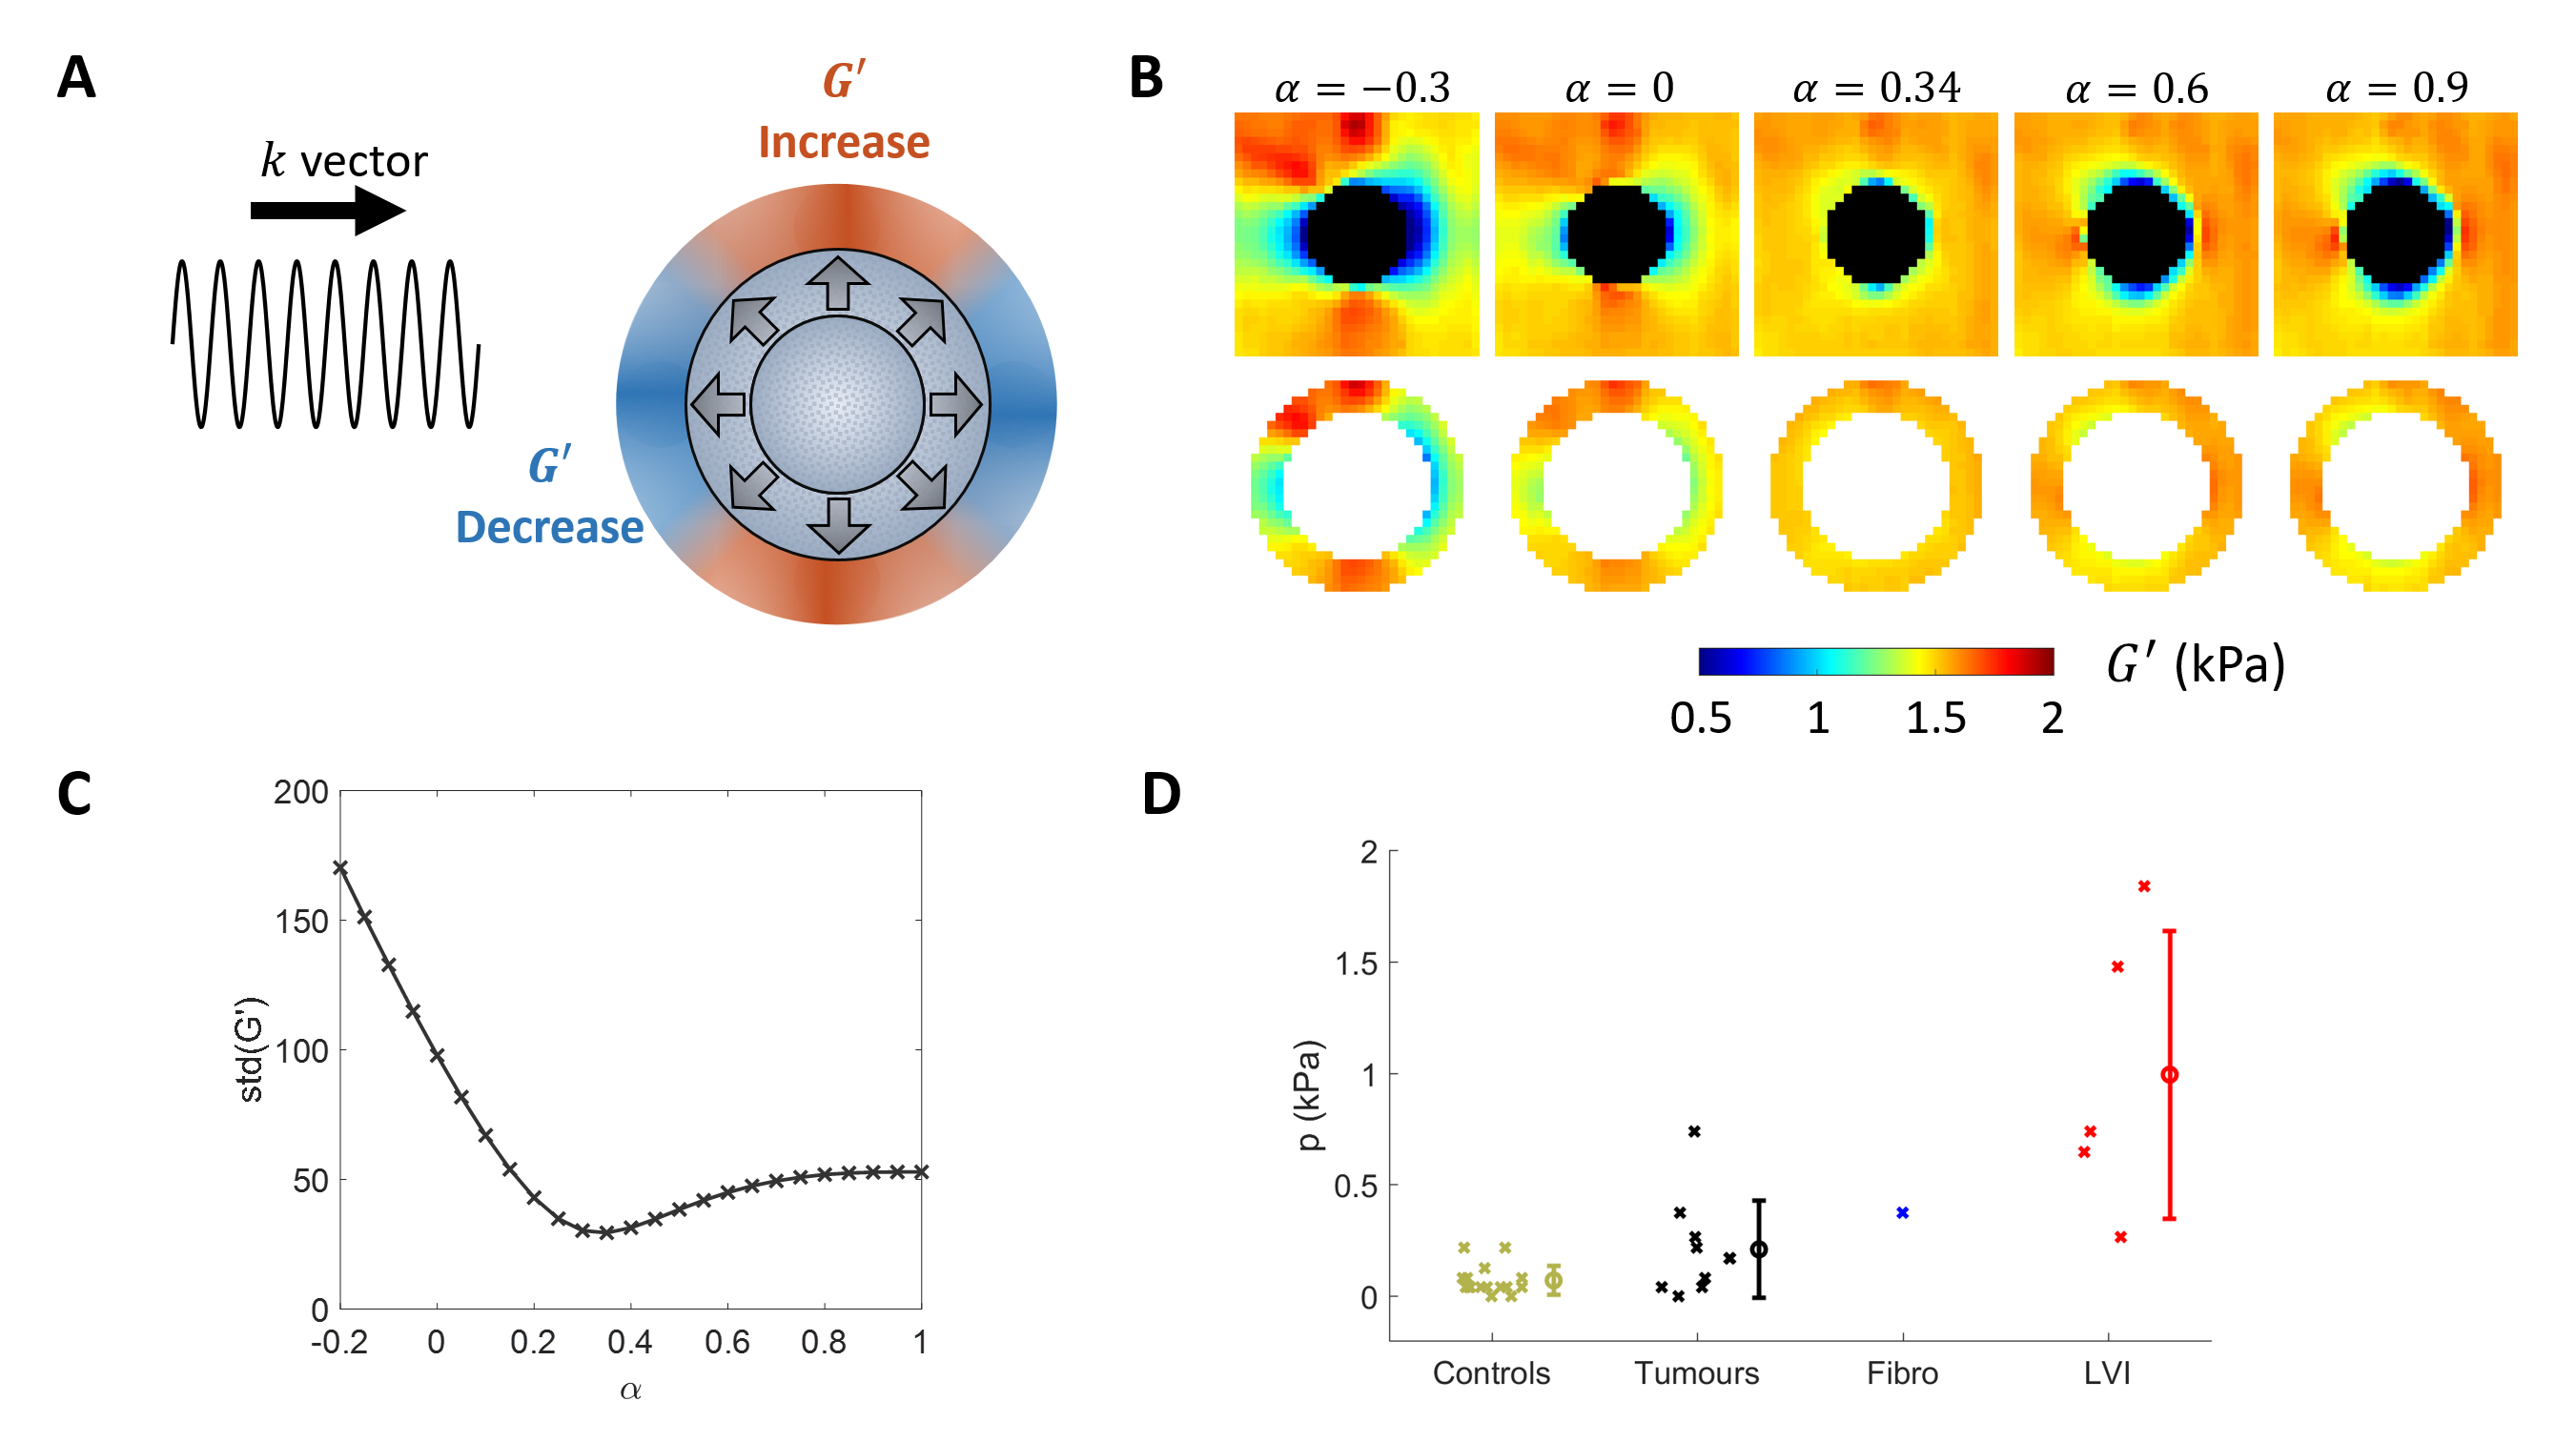
Methods
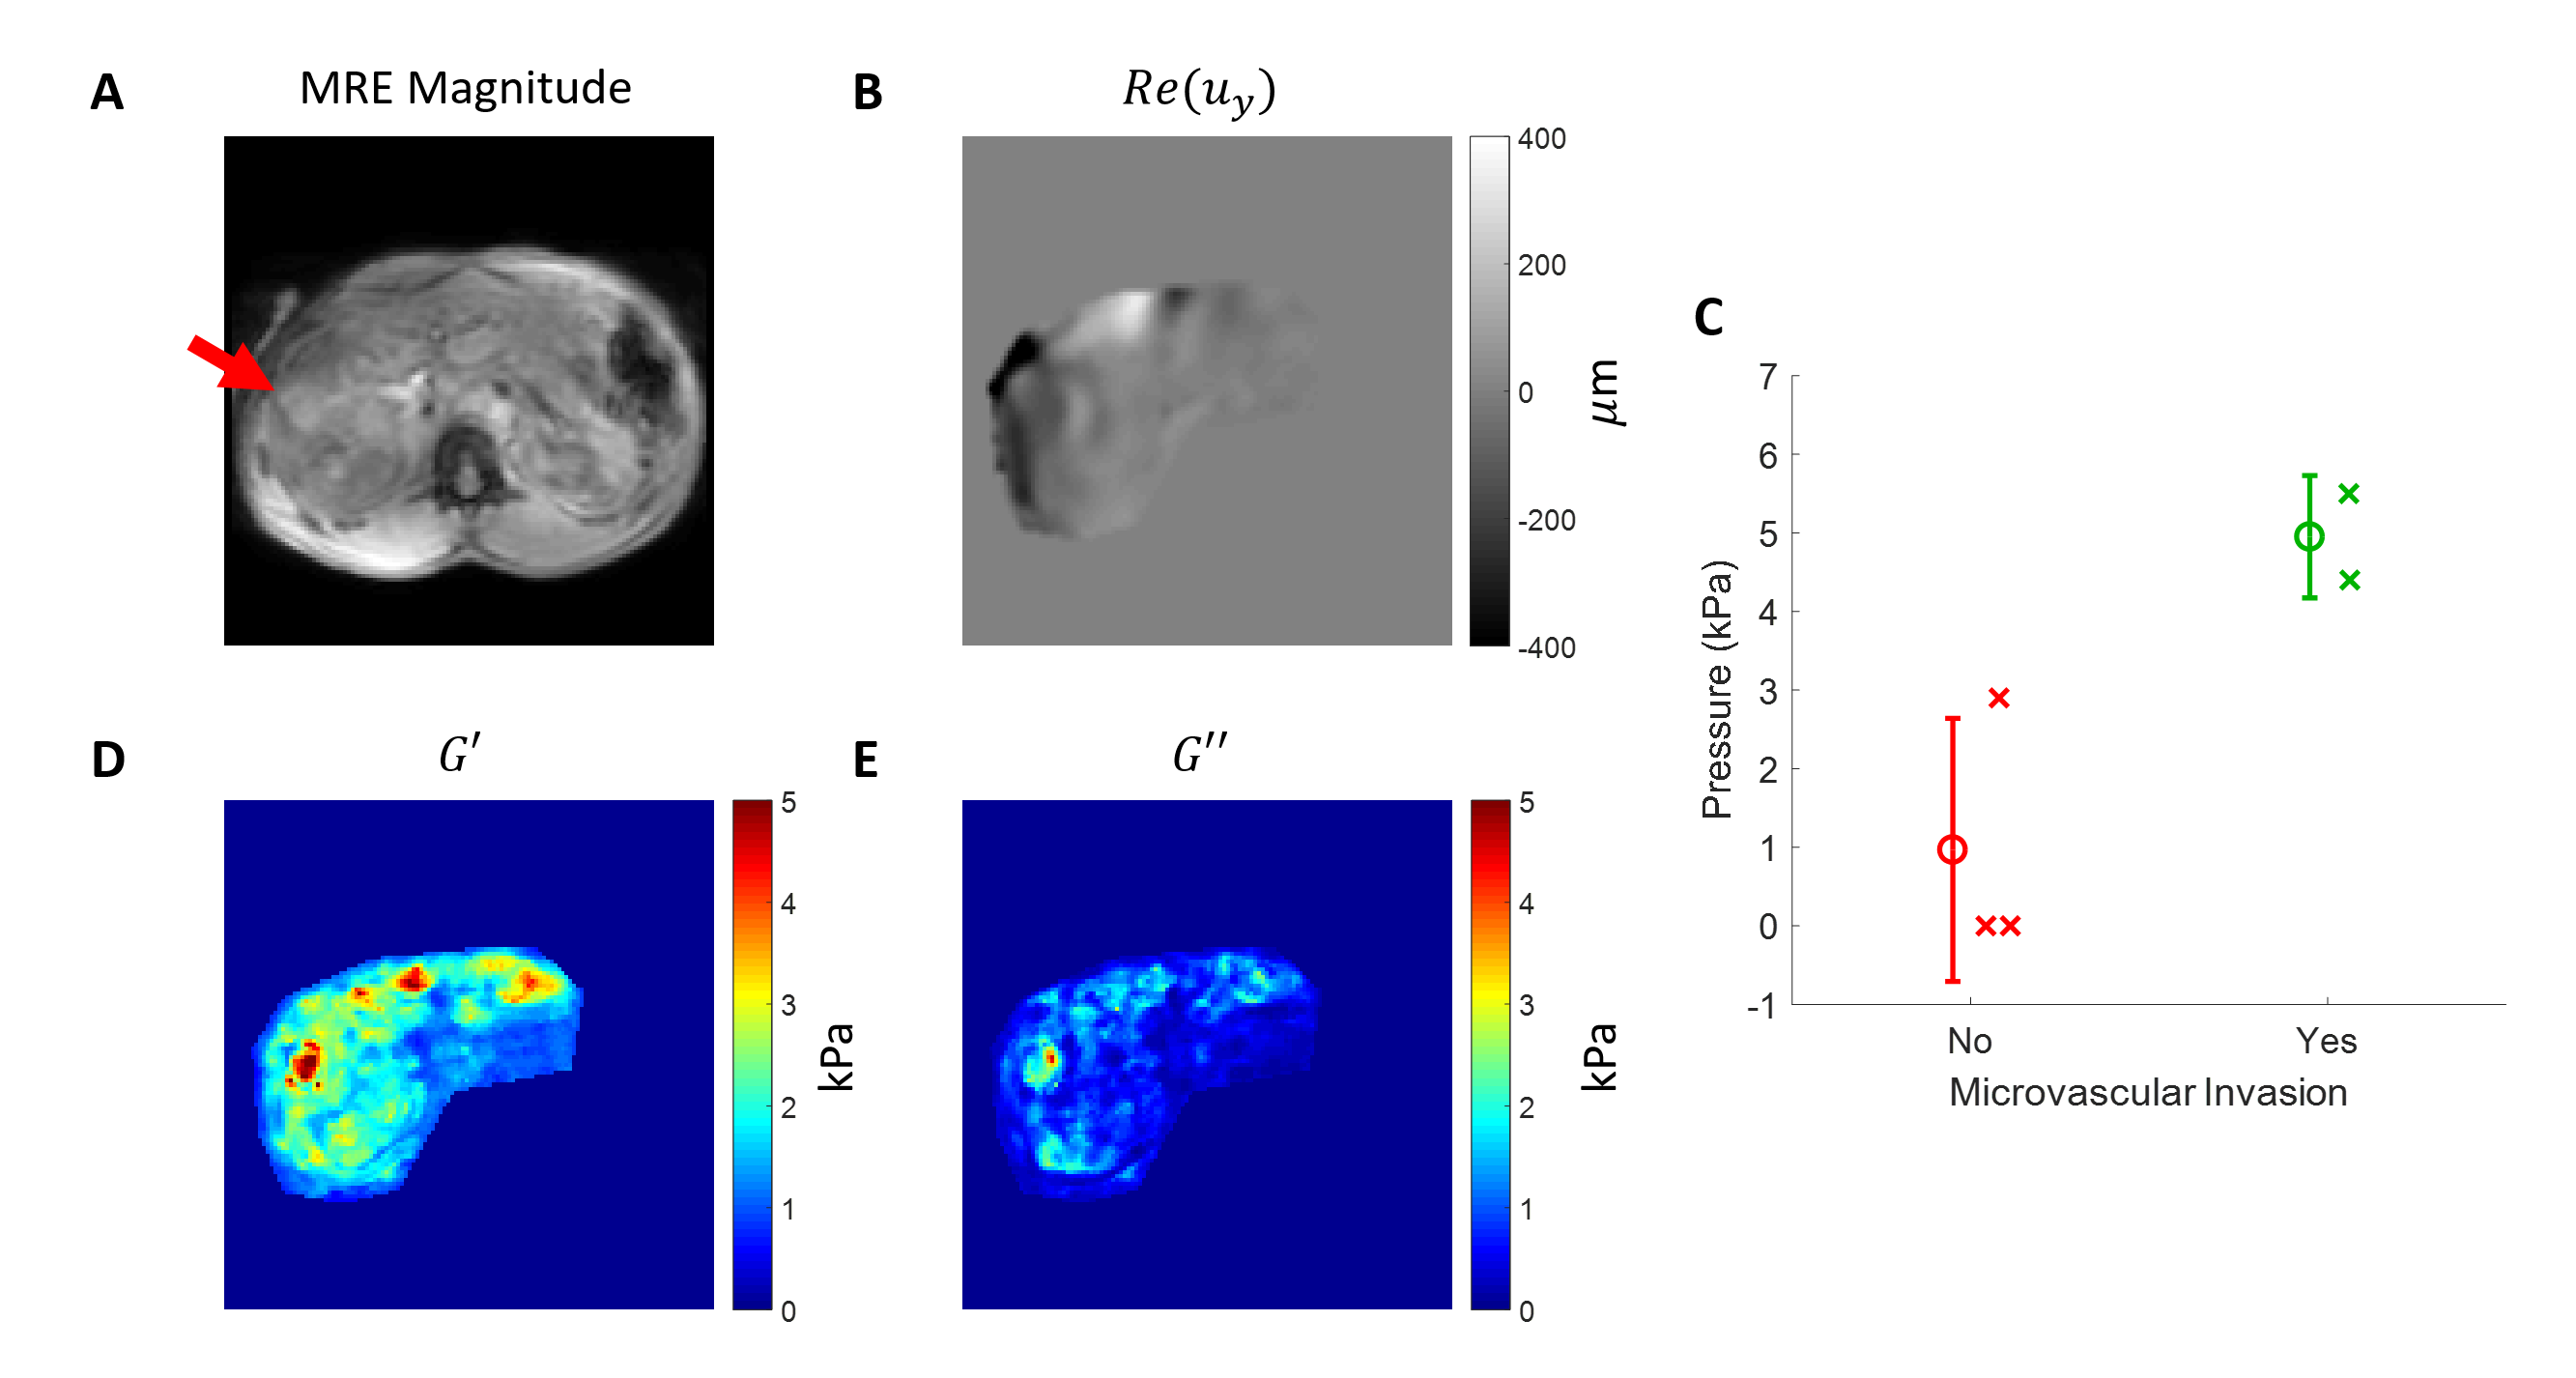
An MRE-based pressure reconstruction method is used to noninvasively measure pressure in liver and brain tumours.5 This method uses a single standard MRE image to investigate the stiffness in the vicinity of the tumour. It is assumed the tumour has deformed the surrounding tissue due to increased pressure which leads to changes in stiffness. A specialised reconstruction approach,7 incorporated into a finite element based reconstruction algorithm,8 reconstructs stiffness in accordance with various scalings of a presumed deformation field, while removing changes in stiffness due to this deformation. The scaling which most reduces the presumed biases is chosen as correct and a nonlinear biomechanical model is utilised to relate the scaling to pressure. Figure 1 shows an overview of the theory underlying the method and its application to breast cancer data.6 For the liver and brain pressure data presented here, a NeoHookean material model is assumed for both organs and background stiffness values of 3 and 1 kPa, respectively, were assumed.Liver tumour MRE data was acquired via standard MRE methods. Tumour location and size were determined by corresponding high resolution T2 weighted imaging. In this study, 23 patients have been scanned so far with MRE data collected. Of these 23 cases, 11 have unknown histology, as of the time of this writing, and so are excluded. A further 4 cases, primarily the first to be collected, suffered from wave data quality issues. An additional 3 cases failed to give any minimum in the scaling parameter. Of the remaining 5 cases, 2 show microvascular invasion and 3 do not.
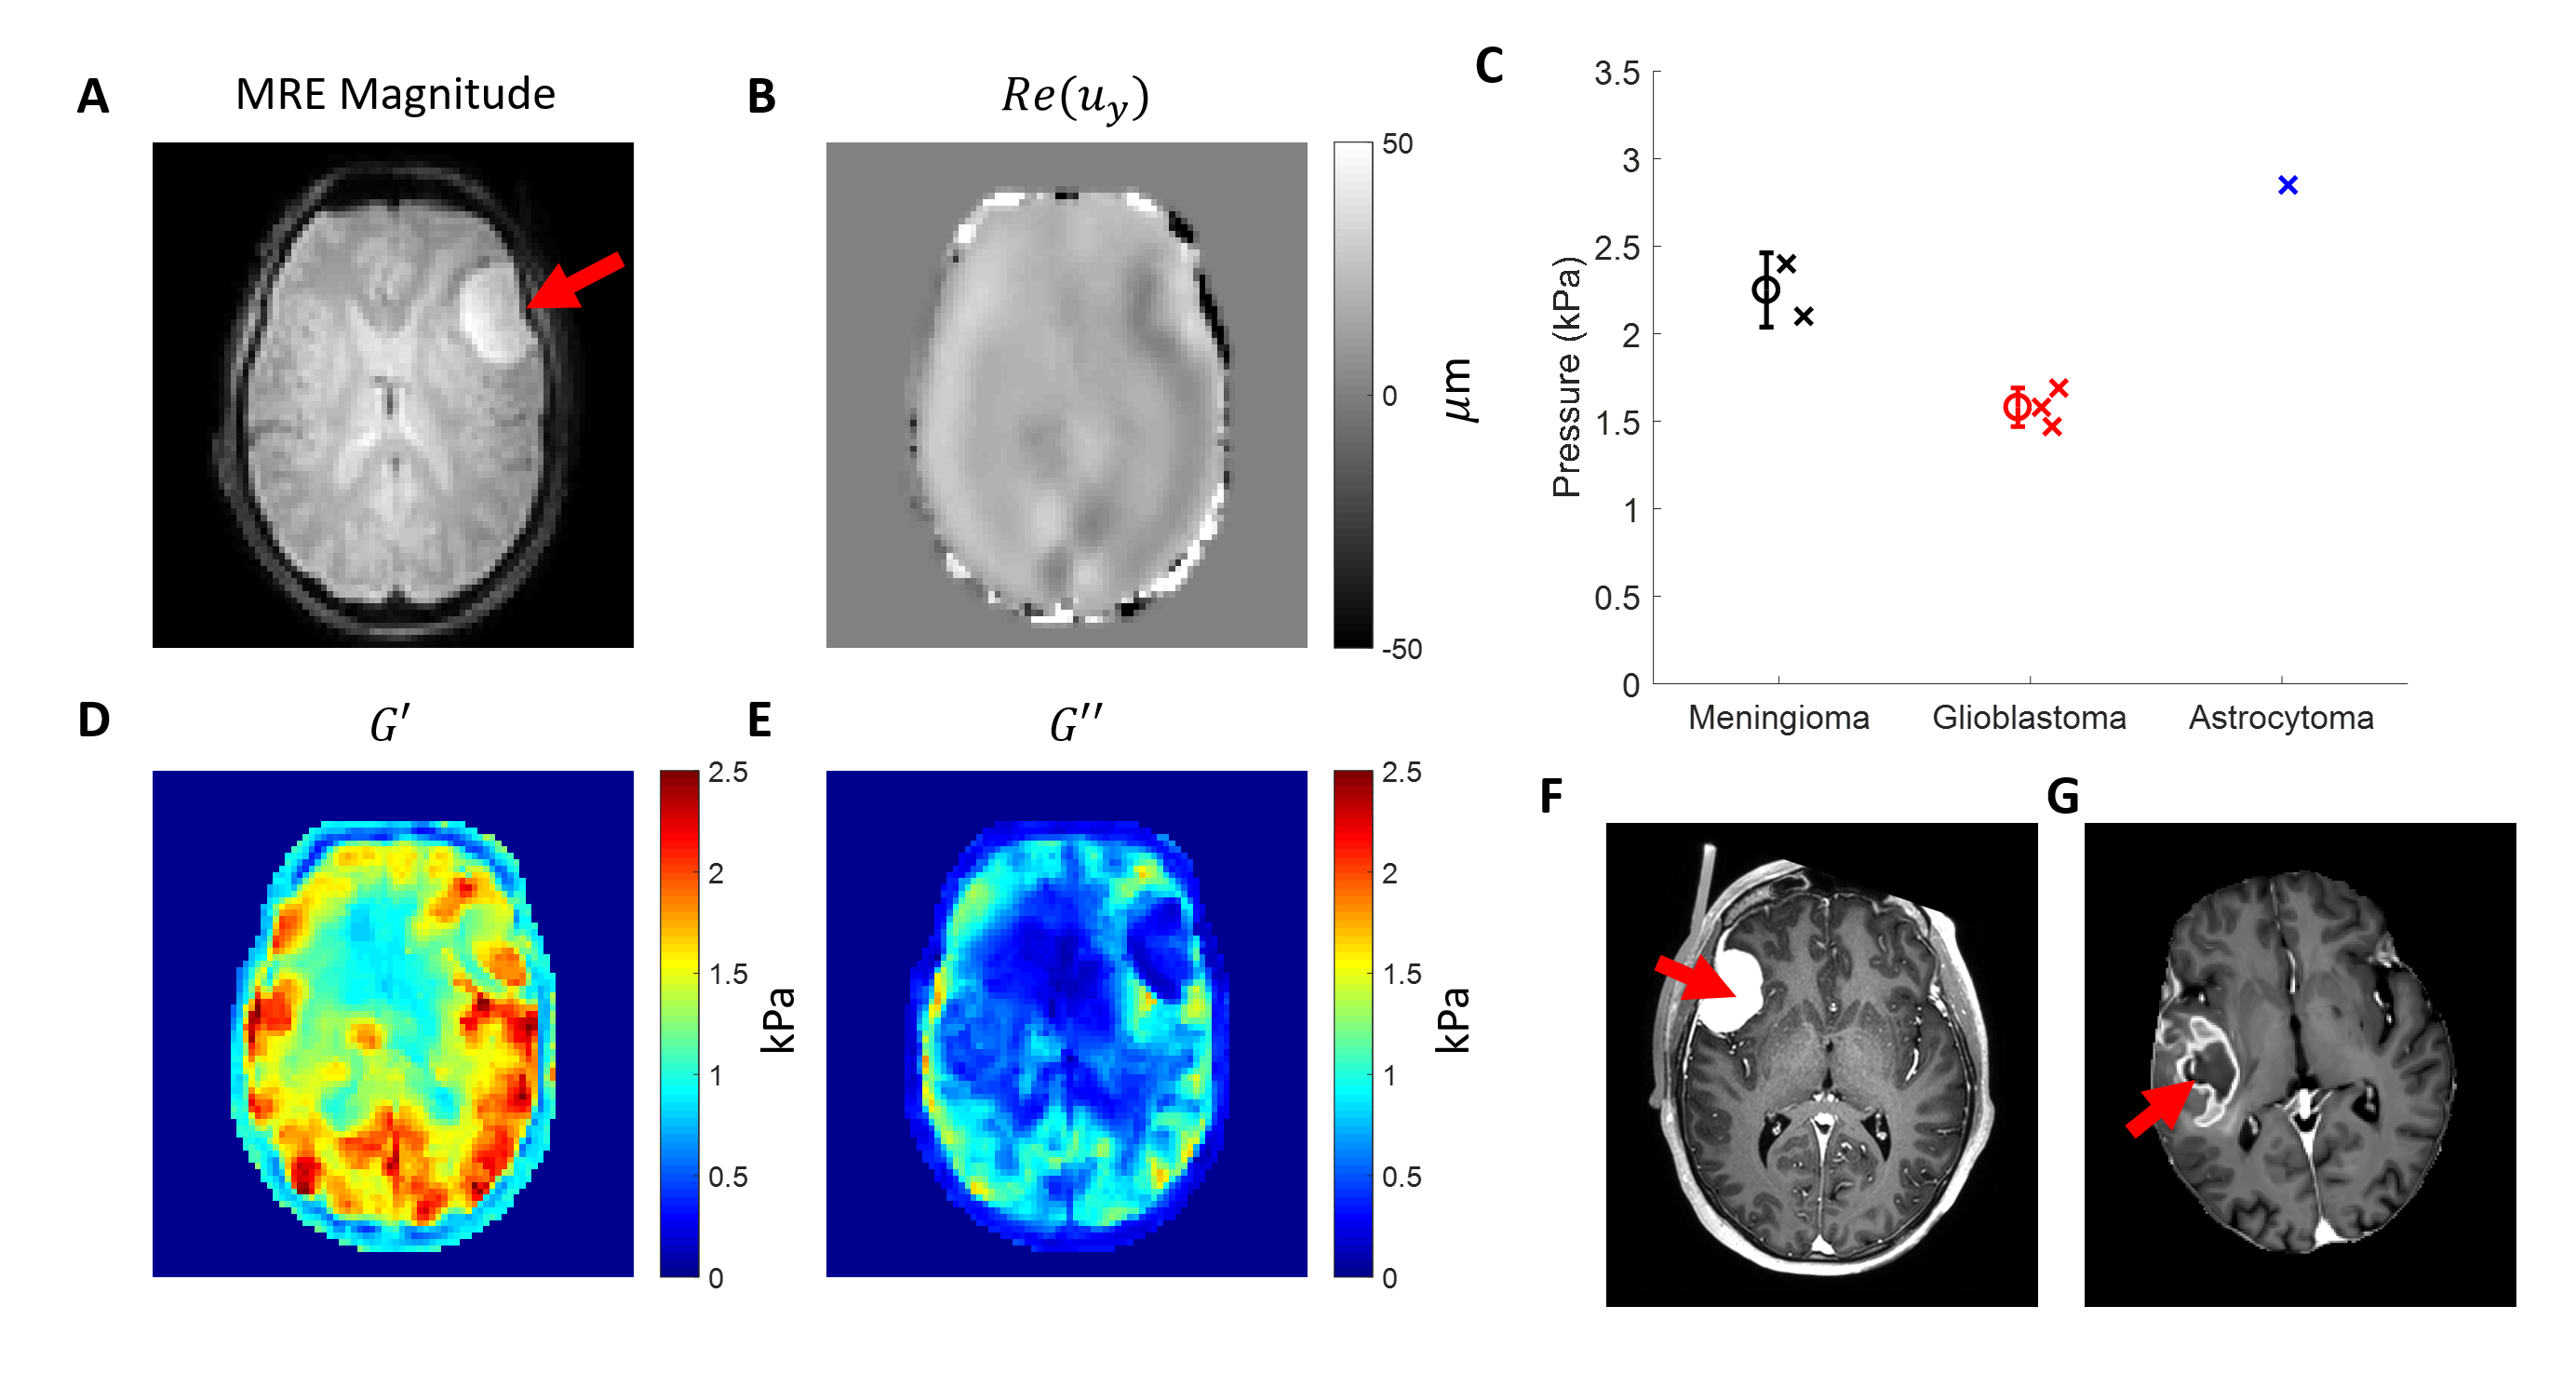
Brain tumour MRE data was acquired similarly. Tumour location and size were determined by segmenting9 high resolution T1 and contrast enhanced images. So far, in this study, seven patients have been scanned, composed of two meningioma cases, four glioblastomas (IDH-wildtype), and one anaplastic astrocytoma (IDH-mutant). One of the glioblastoma cases failed to give a minimum for the scaling parameter.
Results
Figure 2 shows reconstructed pressure values for the 5 cases considered and an example of the liver MRE scan. The cases without microvascular invasion show an average of 0.97 +/- 1.67 kPa and the cases with microvascular invasion show an average of 4.95 +/- 0.78 kPa.Figure 3 shows brain cancer pressure results for the 6 cases considered, an example of the brain MRE scan, and contrast enhanced images of an example meningioma and glioblastoma case. The 2 meningioma cases show an average 2.25 +/- 0.21 kPa, the 3 glioblastomas show 1.58 +/- 0.11 kPa, and the 1 astrocytoma gives 2.85 kPa.
Discussion & Conclusion
The preliminary liver results show a similar correlation as previously seen in breast cancer in that higher reconstructed pressure values indicate presence of microvascular invasion. This is an ongoing study which in the future will include more data sets. The preliminary brain data show an interesting potential separation between meningioma and glioblastoma tumour types. Unlike the breast and liver data, the higher pressure here indicates the more benign tumour type. However this makes physical sense as meningiomas are typically well encapsulated meaning a large portion of the growth pushes on the tissue.10 In contrast, glioblastomas typically show more infiltration, possibly meaning the tumour pushes less on its surroundings. More data is expected for breast, liver, and brain in the future.Acknowledgements
This project has received funding from the European Union’s Horizon 2020 research and innovation program under grant agreement No 668039.References
1. Heldin CH, Rubin K, Pietras K, Östman A. High interstitial fluid pressure—an obstacle in cancer therapy. Nature Reviews Cancer. 2004 Oct;4(10):806.
2. Nia HT, Liu H, Seano G, Datta M, Jones D, Rahbari N, Incio J, Chauhan VP, Jung K, Martin JD, Askoxylakis V. Solid stress and elastic energy as measures of tumour mechanopathology. Nature biomedical engineering. 2016 Nov 28;1(1):1-1.
3. Jain RK, Martin JD, Stylianopoulos T. The role of mechanical forces in tumor growth and therapy. Annual review of biomedical engineering. 2014 Jul 11;16:321-46.
4. Ariffin AB, Forde PF, Jahangeer S, Soden DM, Hinchion J. Releasing pressure in tumors: what do we know so far and where do we go from here? A review. Cancer research. 2014 May 15;74(10):2655-62.
5. Fovargue, D., Lee, J., Fiorito, M., Capilnasiu, A., Sethi, S., Hoelzl, S., Runge, J.H., de Arcos, J., Satchithananda, K., Nordsletten D., Purushotham, A., Sinkus, R. Non-linear Mechanics Allows Non-invasive Quantification of Interstitial Fluid Pressure. ISMRM, Paris, 2018.
6. Fovargue, D., Sethi, S., Lee, J., Fiorito, M., Capilnasiu, A., Hoelzl, S., Runge, J.H., Dokumaci, S., de Arcos, J., Satchithananda K., Nordsletten D., Purushotham, A., Sinkus, R. Lymphovascular invasion correlates with elevated tumor pressure as quantified by MR Elastography: initial results from a breast cancer trial. ISMRM, Montreal, 2019.
7. Capilnasiu A, Hadjicharalambous M, Fovargue D, Patel D, Holub O, Bilston L, Screen H, Sinkus R, Nordsletten D. Magnetic resonance elastography in nonlinear viscoelastic materials under load. Biomechanics and modeling in mechanobiology. 2019 Feb 15;18(1):111-35.
8. Fovargue D, Kozerke S, Sinkus R, Nordsletten D. Robust MR elastography stiffness quantification using a localized divergence free finite element reconstruction. Medical image analysis. 2018 Feb 1;44:126-42.
9. Juan-Albarracín J, Fuster-Garcia E, García-Ferrando GA, García-Gómez JM. ONCOhabitats: A system for glioblastoma heterogeneity assessment through MRI. International journal of medical informatics. 2019 May 16.
10. Seano G, Nia HT, Emblem KE, Datta M, Ren J, Krishnan S, Kloepper J, Pinho MC, Ho WW, Ghosh M, Askoxylakis V. Solid stress in brain tumours causes neuronal loss and neurological dysfunction and can be reversed by lithium. Nature Biomedical Engineering. 2019 Mar;3(3):230.
Figures