4742
Quantitative MRI in a Phase 1 Clinical Study of the Vascular Disrupting Agent Crolibulin1Moffitt Cancer Center, Tampa, FL, United States, 2University of Arizona, Tucson, AZ, United States, 3Emory University School of Medicine, Atlanta, GA, United States, 4Perlmutter Cancer Center, New York, NY, United States, 5Imaging Endpoints, Scottsdale, AZ, United States
Synopsis
Diffusion and DCE-MRI were performed at baseline and 2-3 days following Crolibulin (EPC2407) treatment in a phase 1 clinical study of this vascular disrupting agent (VDA). Several functional parameter maps were computed and co-registered across scan dates in 11 subjects with advanced solid tumors. We measured changes in these MRI parameters that indicate cell swelling and vascular reduction following treatment. We identified multivariate combinations of changes in these MRI parameters that are correlated with the dose, AUC and Cmax of Crolibulin, respectively, information that can guide Crolibulin dosing in clinical trials of this VDA in combination with cytotoxic drugs.
Purpose
Vascular Disrupting Agents (VDAs) are small molecules, peptides or antibodies designed to target established tumor vasculature and induce vascular failure. A hypothesized advantage of targeting tumor vascular endothelial cells over directly targeting tumor cells is that the former are genetically stable and therefore less likely to evolve resistance to VDAs [1]. However, pre-clinical and clinical studies reveal that treatment of tumors with VDAs leaves behind a viable rim of tumor [2]. Recent clinical studies of VDAs therefore combine treatment with cytotoxic drugs to target the better perfused tumor regions [3-5]. Crolibulin is a 4H-chromene analog that binds to the colchicine binding site and produces antivascular and apoptotic effects [6,7]. Here we report a combined DW-MRI and DCE-MRI biomarker that is suitable for assessing the spatially heterogeneous response of solid tumors to Crolibulin.Methods
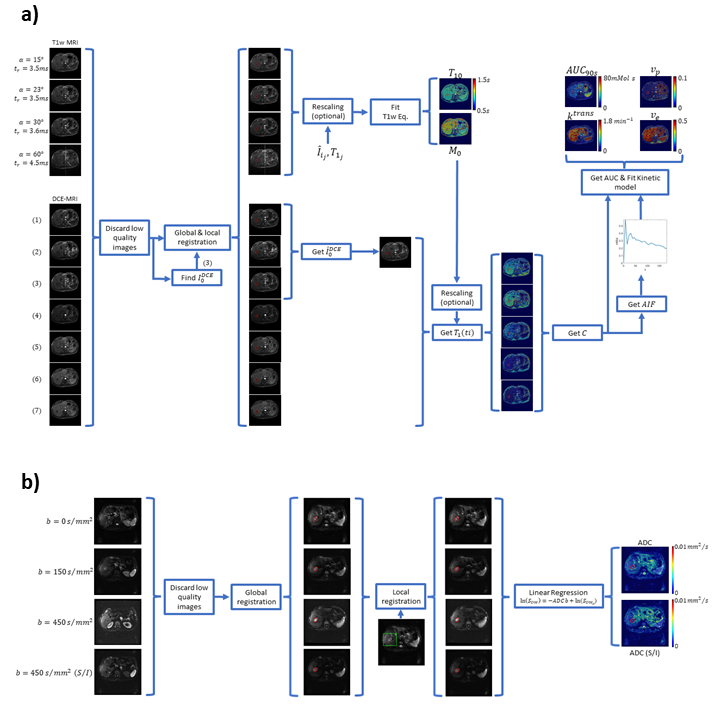
In an IRB-approved multi-site phase 1 clinical study, 11 subjects with advanced solid tumors were imaged by MRI at baseline and 2-3 days post-Crolibulin (13-24 mg/m2, infused over 4 h on a daily x 3, 21 day cycle). DW-MRI single-shot EPI images were acquired during a held-inhalation breathhold in 6 mm slices with isotropic diffusion weighting and b = 0, 150, 300, 450 s/mm2, and repeated with diffusion weighting applied in the superior/inferior direction. 4 pre-contrast 3D-GRE images (flip angles = 15°, 23°, 30° and 60°) were acquired for computing pre-contrast T1 maps, followed by a dynamic series of 24-30 3D-GRE volumes collected during repeated “held exhalation” breath-holds with a temporal resolution of 16-18 seconds, 12 slices reconstructed to a matrix size of 256 x 256, slice thickness = 5 mm, TR = 5.0 ms, TE = 2.1 ms, and α=30°. DW-MRI and DCE-MRI images were co-registered intra-visit and inter-visit using rigid and elastic registration as per the methodology depicted in Figure 1. Pre-contrast T1 and M0 maps, together with the DCE-MRI images, were used to calculate voxelwise gadolinium concentrations that were fitted to an Extended Tofts Model to extract model parameters Ktrans (reflective of perfusion or microvascular permeability), Ve (extracellular extravascular volume fraction), and Vp (plasma volume fraction) using the method presented by Murase [8] (Figure 1). Area-Under-the-Curve of gadolinium at 90 s was also computed (AUC90s). Maps of Apparent Diffusion Coefficient of water (ADC) with isotropic and superior-inferior (S/I) weighting of diffusion were obtained by fitting the diffusion-weighted images to the signal equation (S=S0 e-b ADC) (Figure 1).Results
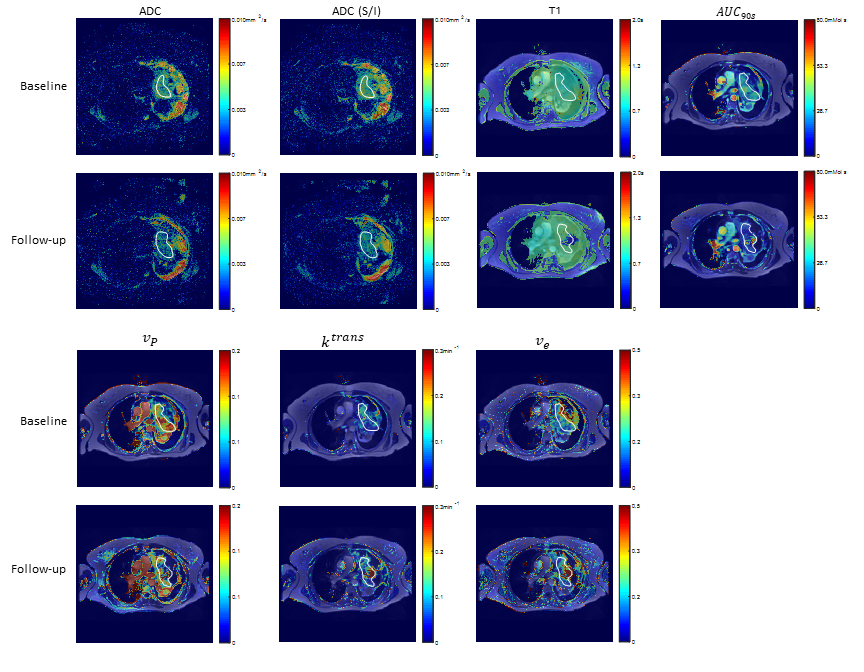
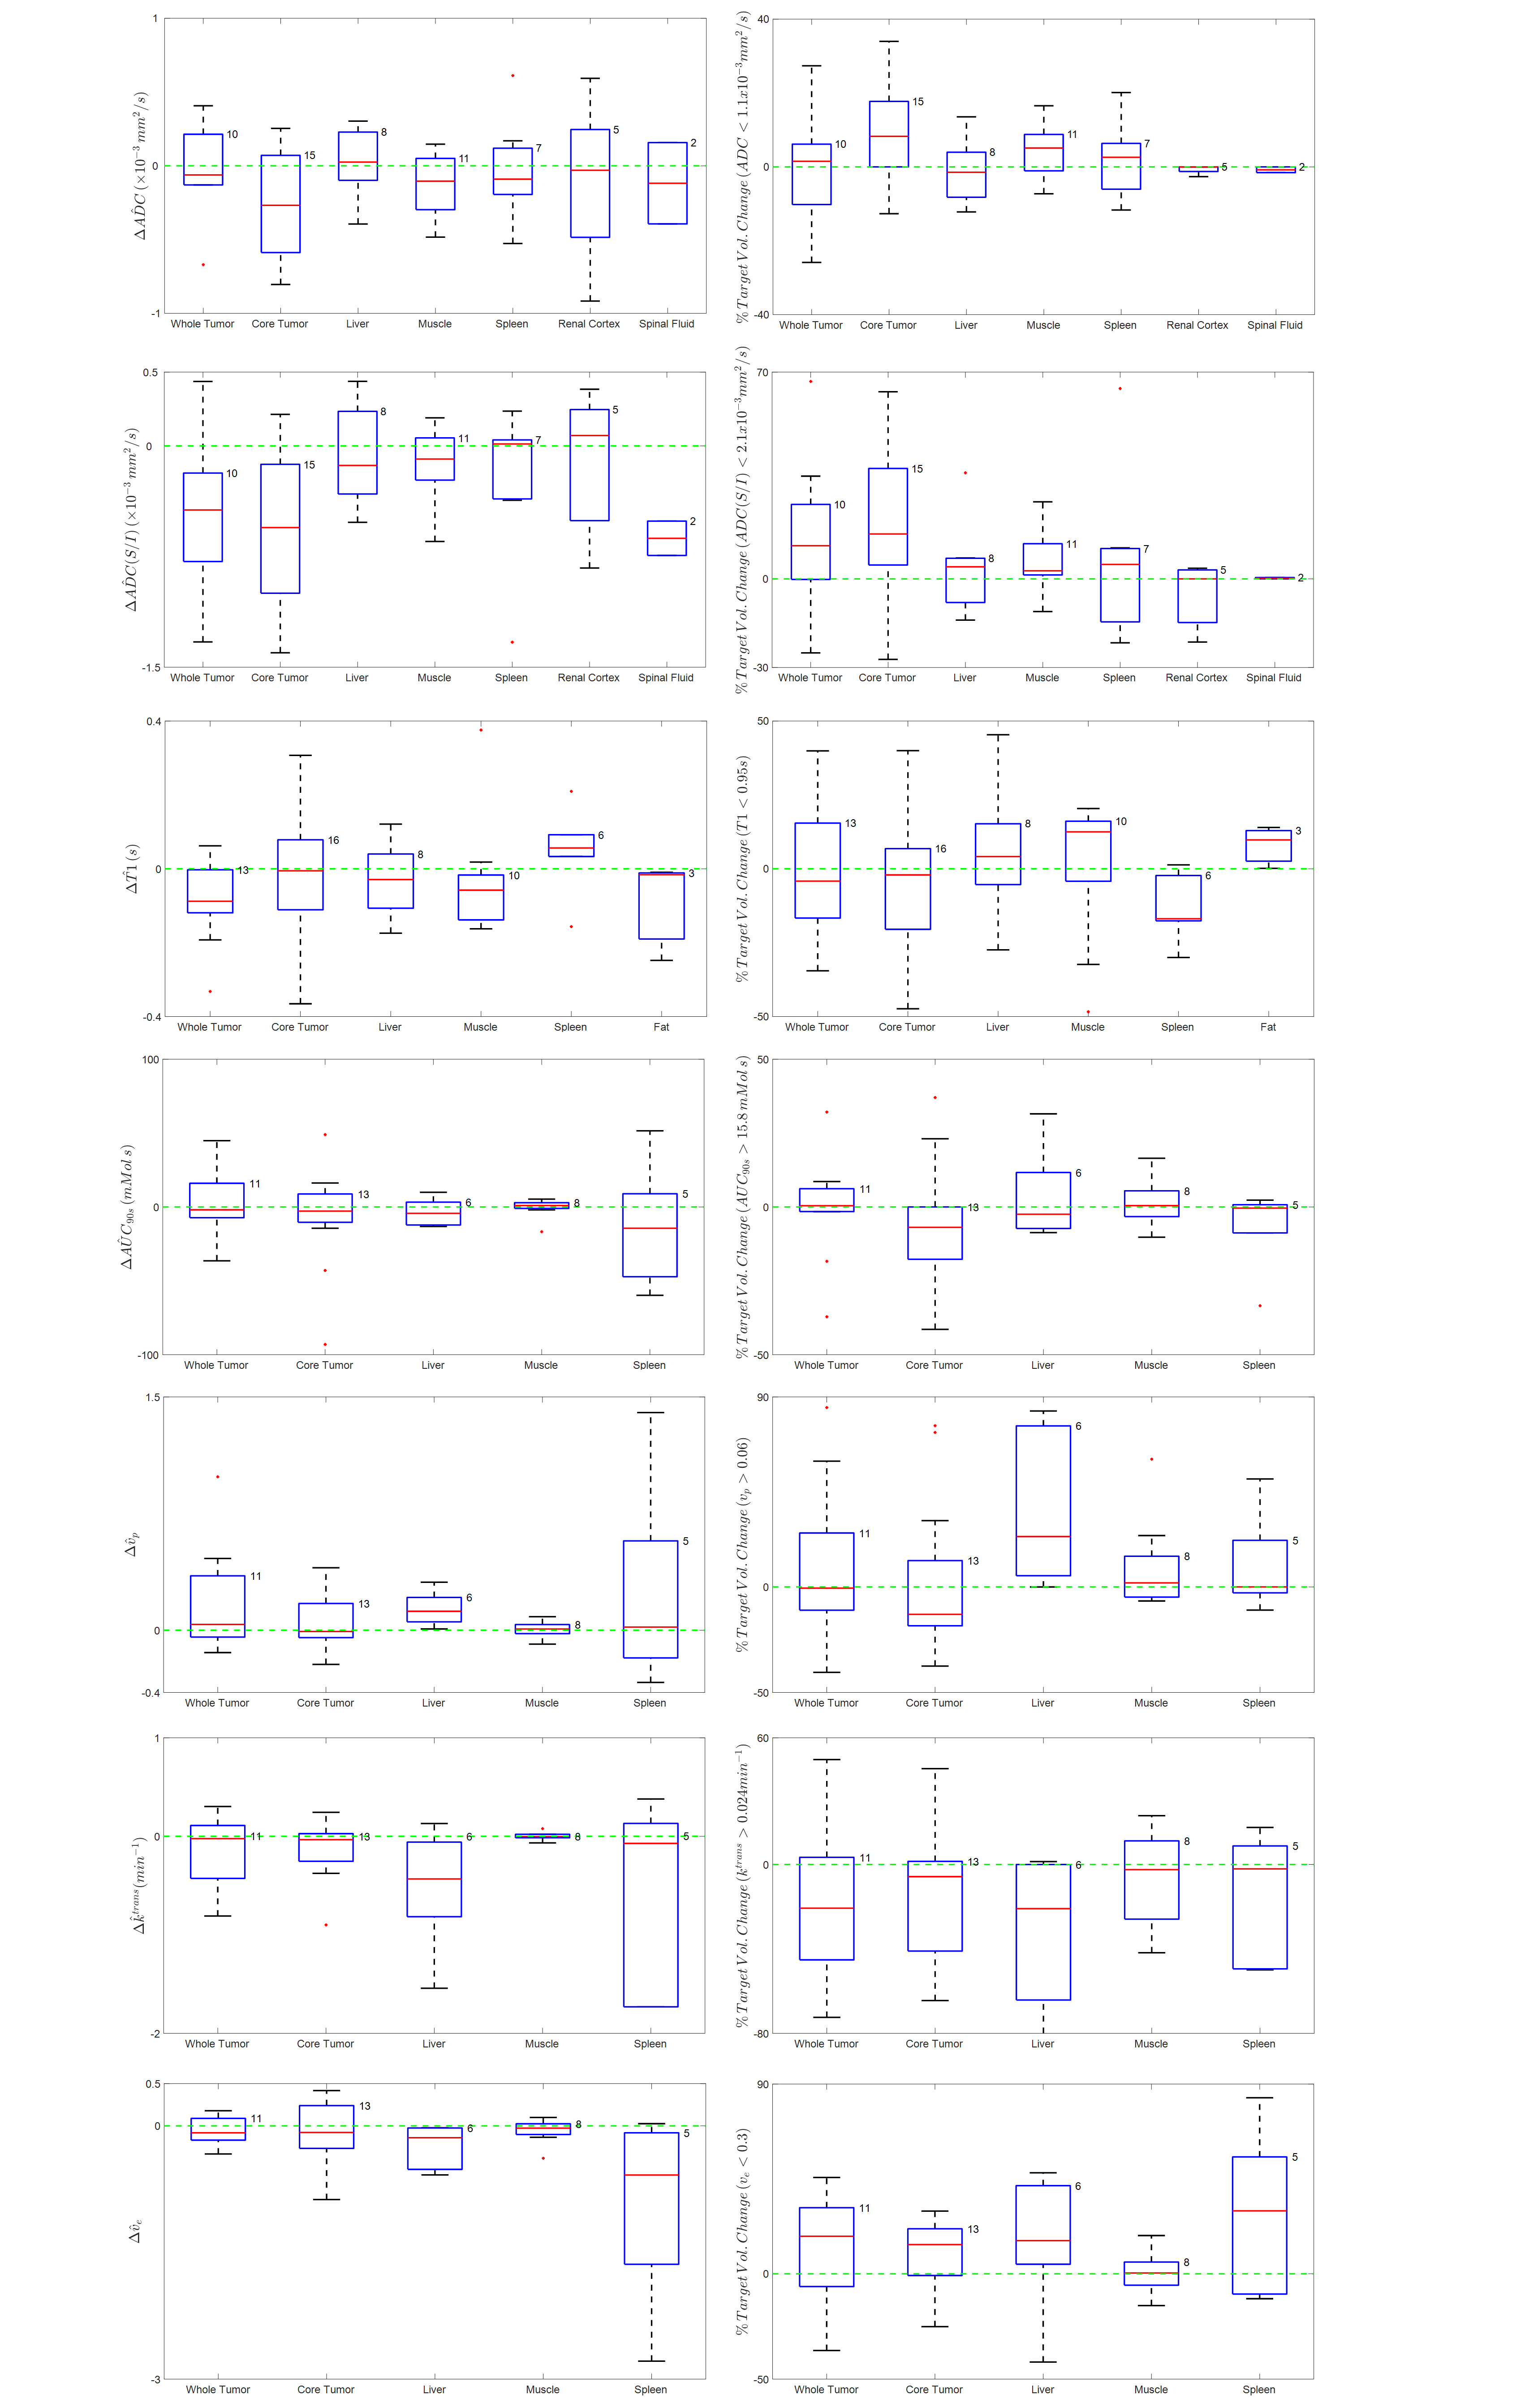
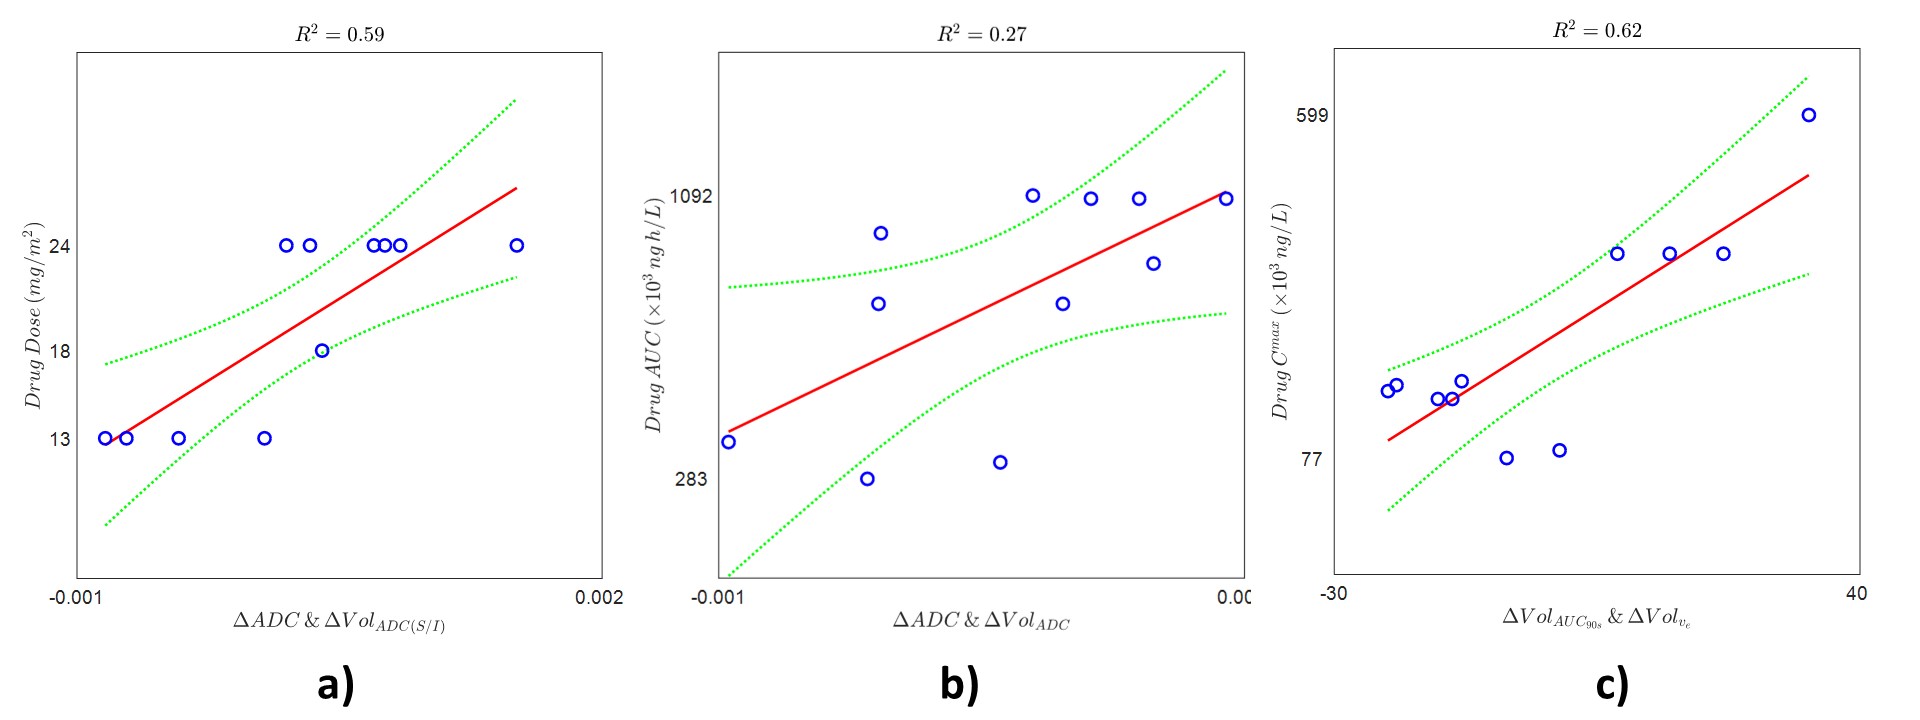
An example of the quantitative parameters maps before and post-treatment of a patient with a malignant mass in the lung is shown in Figure 2. A trend towards lower values of tumor ADC, AUC90s, Vp, Ktrans, and Ve are observed in this tumor. The decrease in ADC may be indicative of cell swelling following vascular destruction by the drug. Mean changes in the values of these quantitative parameters at follow-up relative to baseline values are shown in the left column of Figure 3 for whole tumor and selected normal tissues. In addition to whole-tumor analysis, we have also examined changes in the values of ADC, AUC90s, Vp, Ktrans, and Ve in only voxels that were above or below histogram thresholds that were identified iteratively to maximize correlation [9]; these results are shown in the right column of Figure 3. A decrease in mean ADC (isotropic) and ADC (S/I) at follow-up relative to baseline are observed, while changes in normal tissue ROIs were generally smaller. The decrease in ADC was also greater in the tumor core compared with the whole tumor. Changes in Vp, Ktrans, and Ve in liver and spleen were larger than in muscle, reflecting either sensitivity to the drug or the fact that a two-compartment model with single AIF does not adequately describe tracer kinetics in these tissues. In addition to univariate analysis we also investigated correlations of changes in the tumor core of all possible pairs of parameters with drug dose, drug AUC, and drug Cmax in each subject. Mean change in ADC combined with histogram-thresholded change in ADC (S/I) correlated highest to Crolibulin dose (Figure 4a), mean change in ADC combined with histogram-thresholded change in ADC correlated highest to Crolibulin AUC (Figure 4b), and histogram-thresholded change in AUC90s combined with histogram-thresholded change in Ve correlated highest to Cmax (Figure 4c).Conclusions
Changes in ADC, AUC90s, Vp, Ktrans, and Ve are suggestive of cell swelling and reduction in tumor vascularization following Crolibulin treatment. Combinations of changes in these quantitative MRI parameters were identified that can inform drug dosing in future clinical studies of Crolibulin in combination with a cytotoxic drug.Acknowledgements
No acknowledgement found.References
1. Ji YT, Liu YN, Liu ZP. Tubulin colchicine binding site inhibitors as vascular disrupting agents in clinical developments. Current Medicinal Chemistry, 2015;22(11):1348-60.
2. Evelhoch JL, LoRusso PM, He Z, DelProposto Z, Polin L, Corbett TH, Langmuir P, Wheeler C, Stone A, Leadbetter J, Ryan AJ, Blakey DC, Waterton JC. Magnetic resonance imaging measurements of the response of murine and human tumors to the vascular-targeting agent ZD6126. Clinical Cancer Research, 2004;10(11):3650-7.
3. Gramza AW, Balasubramaniam S, Fojo AT, Ward J, Wells SA. Phase I/II trial of crolibulin and cisplatin in solid tumors with a focus on anaplastic thyroid cancer: Phase I results. Journal of Clinical Oncology, 2013;31(15_suppl):6074-.
4. Blay JY, Papai Z, Tolcher AW, Italiano A, Cupissol D, Lopez-Pousa A, Chawla SP, Bompas E, Babovic N, Penel N, Isambert N, Staddon AP, Saada-Bouzid E, Santoro A, Franke FA, Cohen P, Le-Guennec S, Demetri GD. Ombrabulin plus cisplatin versus placebo plus cisplatin in patients with advanced soft-tissue sarcomas after failure of anthracycline and ifosfamide chemotherapy: a randomised, double-blind, placebo-controlled, phase 3 trial. The Lancet Oncology, 2015;16(5):531-40.
5. Nishio M, Satouchi M, Horiike A, Horio Y, Sunaga Y, Ecstein-Fraisse E, Hida T. Phase 1 study of ombrabulin in combination with docetaxel and cisplatin in Japanese patients with advanced solid tumors. Japanese Journal of Clinical Oncology, 2018;48(4):322-8.
6. Kasibhatla S, Gourdeau H, Meerovitch K, Drewe J, Reddy S, Qiu L, Zhang H, Bergeron F, Bouffard D, Yang Q, Herich J, Lamothe S, Cai SX, Tseng B. Discovery and mechanism of action of a novel series of apoptosis inducers with potential vascular targeting activity. Molecular Cancer Therapeutics, 2004;3(11):1365-74.
7. Gourdeau H, Leblond L, Hamelin B, Desputeau C, Dong K, Kianicka I, Custeau D, Boudreau C, Geerts L, Cai SX, Drewe J, Labrecque D, Kasibhatla S, Tseng B. Antivascular and antitumor evaluation of 2-amino-4-(3-bromo-4,5-dimethoxy-phenyl)-3-cyano-4H-chromenes, a novel series of anticancer agents. Molecular Cancer Therapeutics, 2004;3(11):1375-84.
8. Murase K. Efficient method for calculating kinetic parameters using T1-weighted dynamic contrast-enhanced magnetic resonance imaging. Magnetic Resonance in Medicine, 2004;51(4):858-62.
9. Chenevert TL, Malyarenko DI, Galban CJ, Gomez-Hassan DM, Sundgren PC, Tsien CI, Ross BD. Comparison of Voxel-Wise and Histogram Analyses of Glioma ADC Maps for Prediction of Early Therapeutic Change. Tomography, 2019;5(1):7-14.
Figures