4741
Optimizing TSE-T2WI MR imaging of esophageal cancer at 3T: evaluating the effects of chemical shift FS, Dixon and BLADE techniques to image quality1Department of Imaging Diagnosis, National Cancer Center/Cancer Hospital, Chinese Academy of Medical Sciences, Beijing, China, 2Diagnostic Imaging, Siemens Healthcare Ltd, Beijing, China
Synopsis
This study evaluated the effects of chemical shift fat saturation (FS), Dixon and BLADE techniques to image quality in high-resolution imaging of esophageal cancer using a two-dimensional turbo spin echo (TSE) sequence. After quantitative and subjective quality comparing, TSE-T2WI-CS got higher image quality than T2WI Dixon and T2WI BLADE sequences, which demonstrated certain advantages in the diagnosis of esophageal cancer, while T2WI Dixon and T2WI BLADE sequences also has some advantages respectively.
Introduction
Esophageal cancer is the eighth most common tumor in the world, and the incidence is increasing[1, 2]. Due to high spatial resolution and soft-tissue contrast, MRI plays an import role in the diagnosis of esophageal cancer[3,4]. But because the complexity of anatomical structure, the images are prone to imaging artifacts. So it possess great potential in clinical practice to improve image quality. The aim of this study was to evaluate the effects of chemical shift fat saturation (FS), Dixon and BLADE techniques to image quality in high-resolution imaging of esophageal cancer using a two-dimensional turbo spin echo (TSE) sequence.Methods
A total of 21 patients with esophageal cancer (20 males, 1 female, age 38~72 years, mean age, 59 years) underwent MR scan on a 3T MR system(MAGNETOM Prisma; Siemens Healthcare, Erlangen, Germany) with a 18-channel body coil. All patients underwent the high resolution T2WI imaging in axial plane with the following parameters: TSE-T2WI with chemical shift FS (TSE-T2WI-CS) techniques (TR=2320ms, TE=87ms, FOV=260mm, voxel size= 0.8x0.8x4.0mm); TSE-T2WI with Dixon technique (TR=2340ms, TE=92ms, FOV=400mm, voxel size= 1.2x1.3x5.0mm); TSE-T2WI with a BLADE k-space filling technique (TR=4650ms, TE=83ms, FOV=380mm, voxel size=1.2x1.2x5.0mm). For quantitative analyses, the signal-to-noise ratios (SNRs) and contrast-to-noise ratios(CNRs) of the esophageal lesions were calculated. Circular ROIs were placed within the area of lesions and muscles, and airs on the same layer of all sequences. The SNR and CNR were calculated according to the following equation: SNR(lesion)=SI(lesion)/SD(noise); SNR(muscle)=SI(muscle)/SD(noise); CNR=SNR(lesion)-SNR(muscle); where SI is the signal intensity of target tissue or lesions and muscle, and SD is the standard deviation of background air. For qualitative analysis, two radiologists (with 10 years of radiology diagnosis experience) independently assessed each sequence blindedly based on the following criteria: (1) overall image quality; (2)tumor detail; (3) esophageal boundaries; (4) artifacts. A five point Likert-type scale was referenced to score these categories (1 = very poor, 2 = poor, 3 = moderate, 4 = good, 5 = excellent)[5]. The inter-reader agreement for image quality between the two radiologists was assessed by Weighted Kappa statistics.The differences of SNRs and CNRs of the three sequences were analyzed using a one-way ANOVA test with LSD as a pairwise comparison method.Results
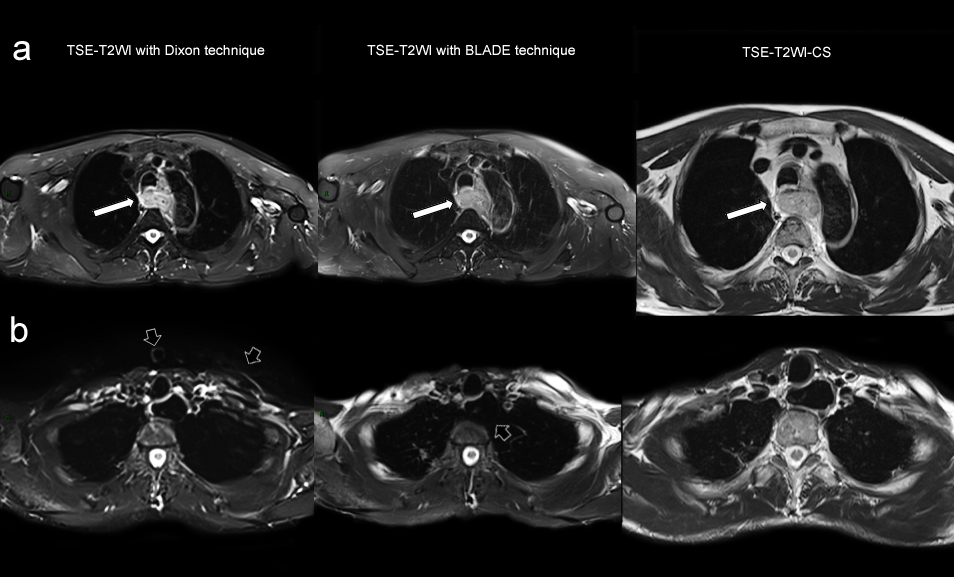
Examples of the images of the TSE-T2WI with Dixon, TSE-T2WI BLADE and TSE-T2WI-CS sequence were shown in Figure 1. There was no significant difference in SNR among the three groups (p=0.256). CNR of TSE-T2WI-CS was significantly higher than T2WI Dixon (p=0.000) and T2WI BLADE (p=0.008); and CNR of T2WI BLADE is significantly higher than that of T2WI Dixon (p=0.008). For qualitative analysis, TSE-T2WI-CS scored significantly higher than T2WI Dixon and T2WI BLADE on the overall image quality (p=0.008 and 0.001, respectively), the sharpness of the esophageal boundaries(p=0.000 and 0.000, respectively) and the artifacts(p=0.026 and 0.000, respectively). But on the details of the tumor, there was no statistical difference between TSE-T2WI-CS and T2WI BLADE sequence(p=0.556); both of them got significantly higher score than T2WI Dixon sequence(p=0.001 and 0.000, respectively). Furthermore, T2WI Dixon is scored higher on artifacts(p=0.007), lower on tumor details(p=0.000) than T2WI BLADE sequence, and the deifference on the overall image quality and the sharpness of the esophageal boundaries of these two sequences were not statistical significant (p=0.544 and 0.453, respectively).Discussion
TSE-T2WI-CS got higher image quality than T2WI Dixon and T2WI BLADE sequences, which demonstrated certain advantages in the diagnosis of esophageal cancer, while T2WI Dixon and T2WI BLADE sequences also has some advantaTSE-T2WI-CS sequence got better image quality than T2WI Dixon and T2WI BLADE sequences for esophageal cancer. Its feasibility of evaluate the extent of invasion and local lymph node metastasis of esophageal cancer remains to be further studied. However, due to the limited scan range of TSE-T2WI-CS, it cannot be used for observing the whole esophagus. Therefore, T2WI Dixon and T2WI BLADE sequences should be retained in the protocol. This study also indicated that while the CNR and tumor detail of T2WI BLADE scored higher than that of T2WI Dixon sequence, its artifacts got heavier too. It was observed in the study that, especially for the upper segment of esophagus, the influence of artifacts was greater, which might be detrimental to diagnosis. T2WI Dixon sequence got less artifacts, and it provided a wide range that could include the whole length of esophagus, which is also practical.Conclusion
TSE-T2WI-CS got higher image quality than T2WI Dixon and T2WI BLADE sequences, which demonstrated certain advantages in the diagnosis of esophageal cancer, while T2WI Dixon and T2WI BLADE sequences also has some advantages respectively.Acknowledgements
No Acknowledgement found.References
1. Enzinger PC, Mayer RJ (2003) Esophageal cancer. N Engl J Med 349:2241–2252
2. van Hagen P, Hulshof MC, van Lanschot JJ et al (2012) Preoperative chemoradiotherapy for esophageal or junctional cancer. NEngl J Med 366:2074–2084
3.van Rossum P, van Hillegersberg R, LeverImaging FM et al (2013)Strategies in the management of oesophageal cancer: what’s the role of MRI? Eur Radiol 23:1753–1765
4.Tirumani H, Rosenthal MH, Tirumani SH et al (2015)Esophageal carcinoma: Current concepts in the role of imagingin staging and management.Canadian Association of Radiologists Journal 66:130-139
5. Li YM, Xia CC, Peng WL et al (2019)Dynamic contrast‑enhanced MR imaging of rectal cancer usinga golden‑angle radial stack‑of‑stars VIBE sequence: comparisonwith conventional contrast‑enhanced 3D VIBE sequence. Abdominal Radiology
Figures