4740
Whole volume histogram analysis of water diffusion predicts response to induction chemotherapy in patients with head and neck cancer1Department of Medical Imaging and Radiological Sciences, Chung Shan Medical University, Taichung, Taiwan, 2Department of Medical Imaging, Chung Shan Medical University Hospital, Taichung, Taiwan, 3Division of Medical Oncology, Department of Internal Medicine, Chung Shan Medical University Hospital, Taichung, Taiwan, 4Department of Radiation Oncology, Chung Shan Medical University Hospital, Taichung, Taiwan
Synopsis
Head and neck squamous cell carcinoma (HNSCC) is one of the most common cancers worldwide. While quantified ADC value has been demonstrated to reveal information on the tumor microstructure, the capbility of predicting treatment response is still controversial. This study aim to assess the ability of whole-volume histogram analysis of water diffusion to predict response to induction chemotherapy in patients with HNSCC using multishot readout-segmented MRI. Our findings indicate that the ΔminADC and ΔADC25 values, could be potential biomarkers for predicting early response to induction chemotherapy in patients with HNSCC, which may facilitate the determination of further therapeutic strategy.
Introduction
Head and neck squamous cell carcinoma (HNSCC), one of the most common cancers worldwide, could be associated with increasing consumption of alcohol, tobacco or betel quid [1,2]. While the significance of induction chemotherapy to patients with HNSCC remains under investigation, a meta-analysis study indicated that adding chemotherapy to the patients at an appropriate timing could improve their survival [3]. Recently, quantified apparent diffusion coefficient (ADC) value derived using diffusion weighted imaging (DWI) protocol has been demonstrated to reveal information on the tumoral microstructure, as a potential biomarker for response assessment in HNSCC patients. However, some previous studies indicated poor differentiation of responders from non-responders after the treatment using mean ADC value [4], probably due to limited capability of characterizing tumor heterogeneity using a conventional region of interest (ROI) approach [5]. In addition, poor image quality, such as geometric distortion at air-tissue interfaces, was frequently obtained in the conventional EPI images. As a result, the purpose of this study is to assess the ability of whole-volume histogram analysis of water diffusion to predict response to induction chemotherapy in patients with HNSCC using multishot readout-segmented MRI.Methods
A total of 19 patients with advanced head and neck squamous cell carcinoma were enrolled in this study. MRI examinations were performed on the patients before and after the first cycle of induction chemotherapy at a 3.0T MR scanner (Magnetom Skyra, Siemens Healthcare, Erlangen, Germany) with a 20-channel head and neck coil. In addition to other conventional MR imaging protocols, a multishot readout-segmented EPI was acquired with: TR/TE = 5800/63 ms , FOV = 230x230mm², matrix size = 160x160 (zero-filled to 320x320), slice thickness = 5 mm, number of slices = 32 ,iPAT = 2 , bandwidth = 919Hz/Px , b value = 0, 800s/mm². All images in our study have been accurately registered first, and then ADC maps were calculated using signal intensities of the corresponding DWI images. Manual ROIs covering the whole tumor volume were selected, excluding necrotic and cystic portions, on DWI images by a radiologist according to its corresponding regions in the T2-weighted images. Afterwards, the mean, median, 25th percentile (ADC25), 75th percentile (ADC75), minimum, maximum, skewness, kurtosis and entropy within the whole volume were derived using histogram analysis. And delta (Δ) change ratios of the above features were generated by calculating the difference of the two examinations and then divided by the prior [e.g. ΔADC = (posttreatment ADC−pretreatment ADC)/pretreatment ADC]. Moreover, patients were stratified as responders (n = 15) and non-responders (n = 4) according to the clinical outcome. Finally, a nonparametric Mann–Whitney U test was used to compare the differences of the extracted histogram features between these two groups, and a receiver operating characteristic (ROC) curve analysis was performed to obtain the optimal cut-off value for the response assessment.Results
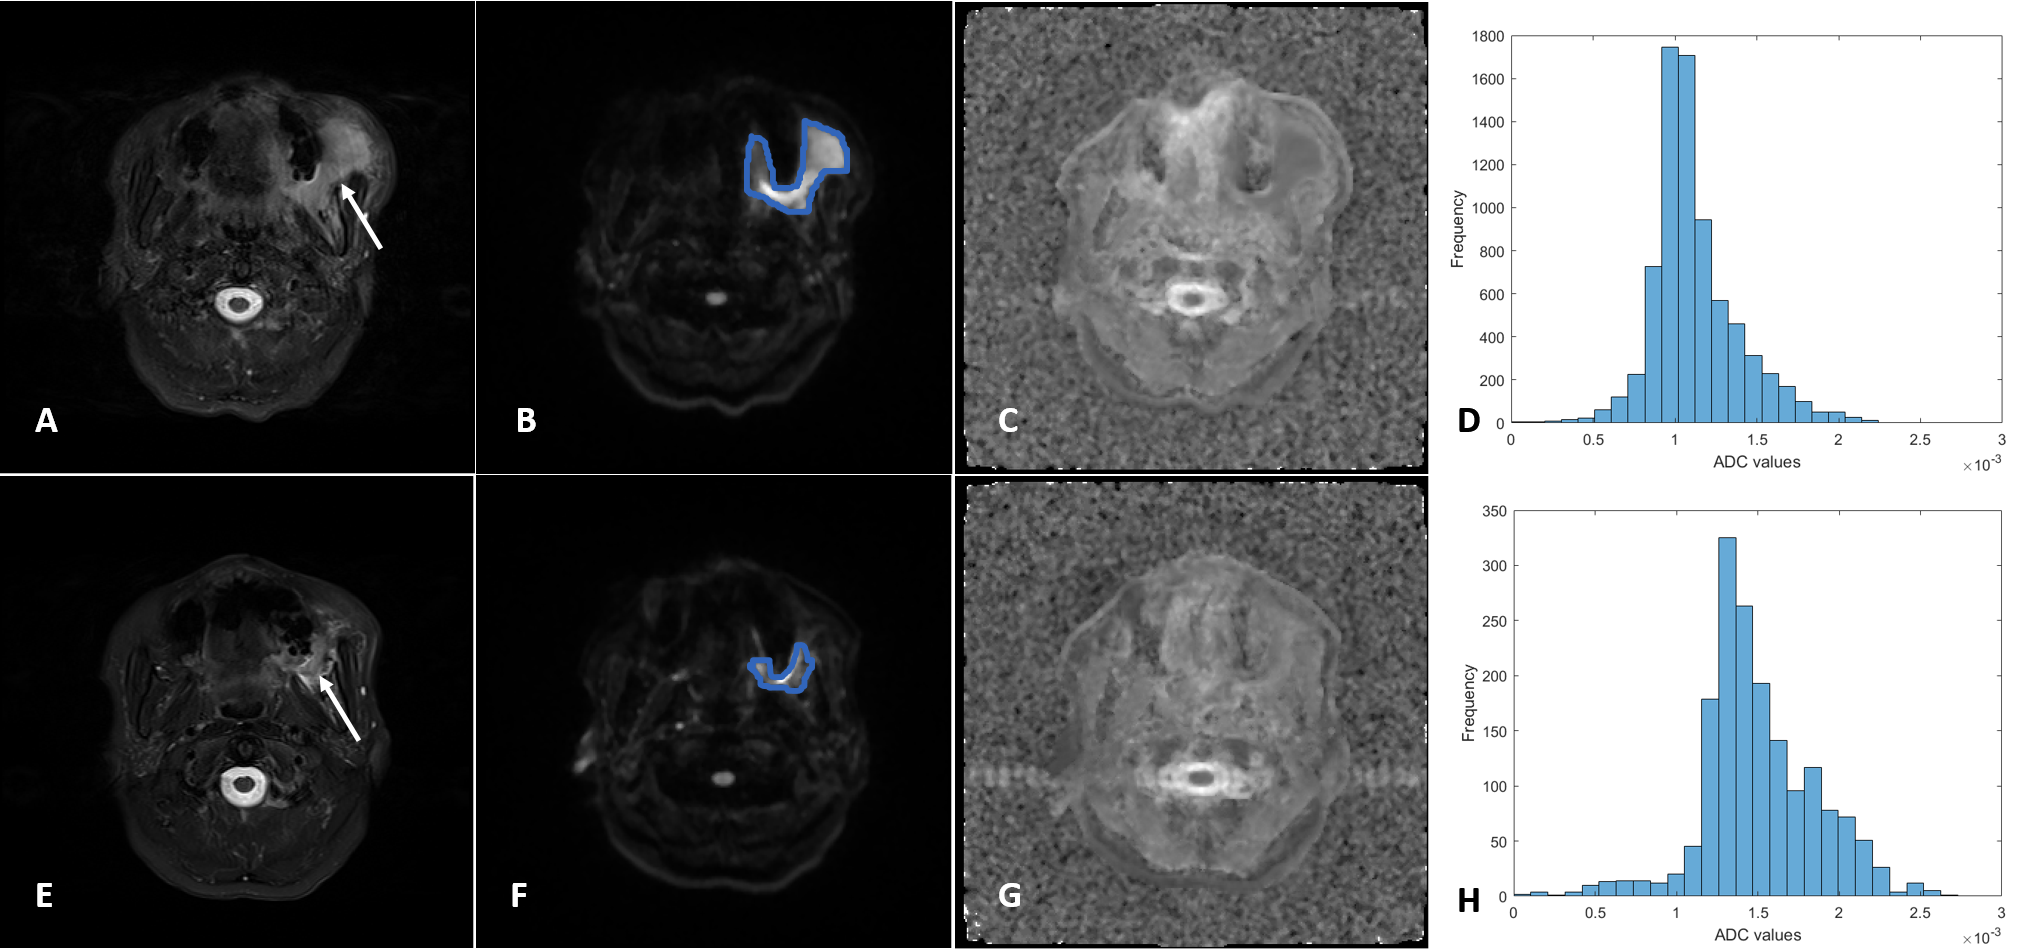
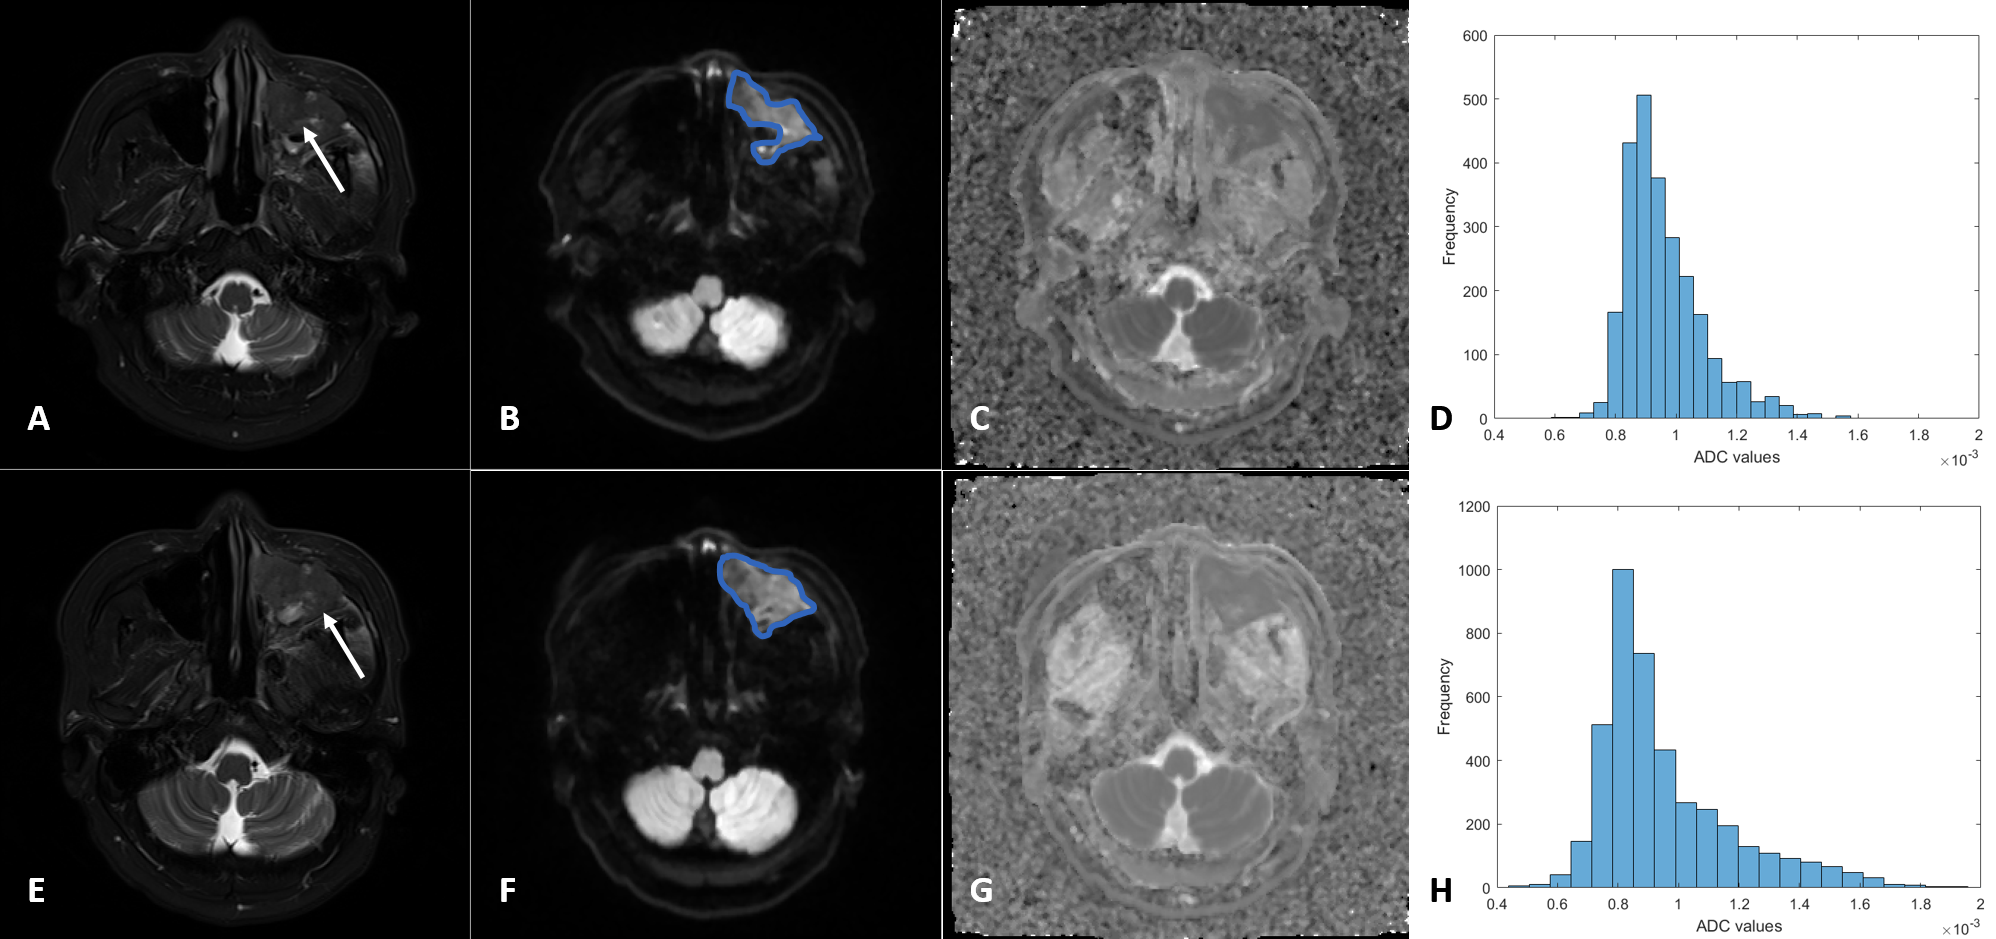
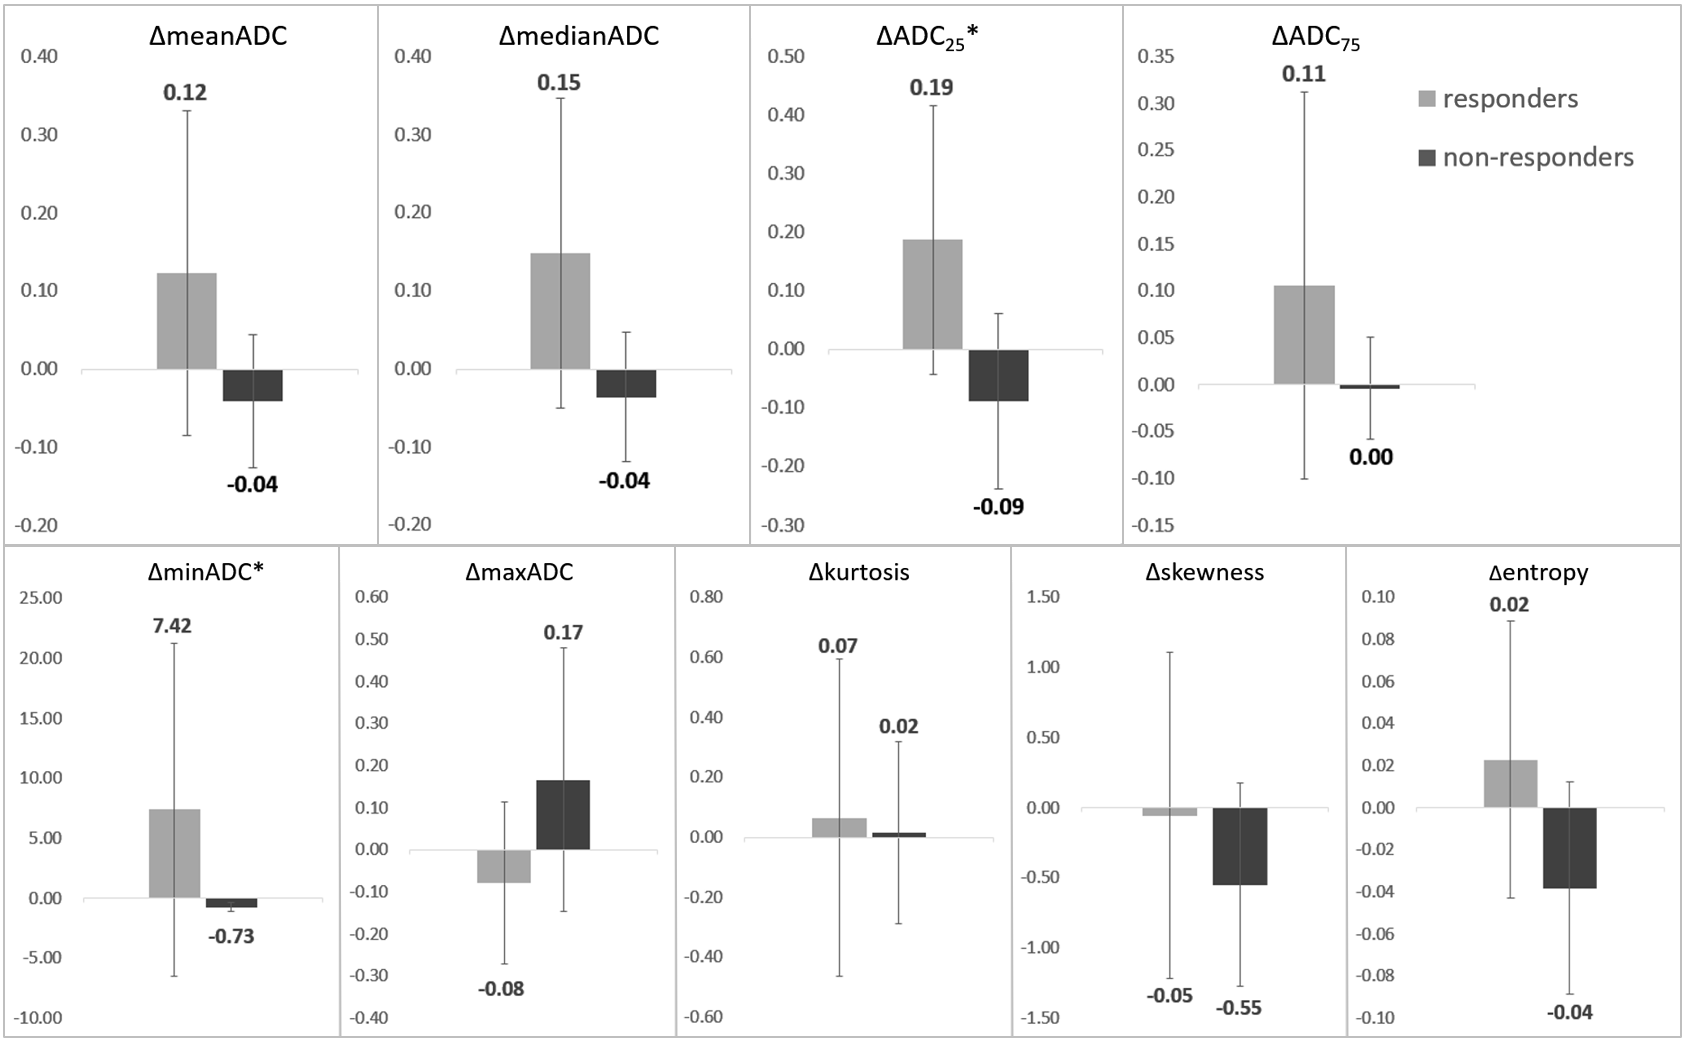
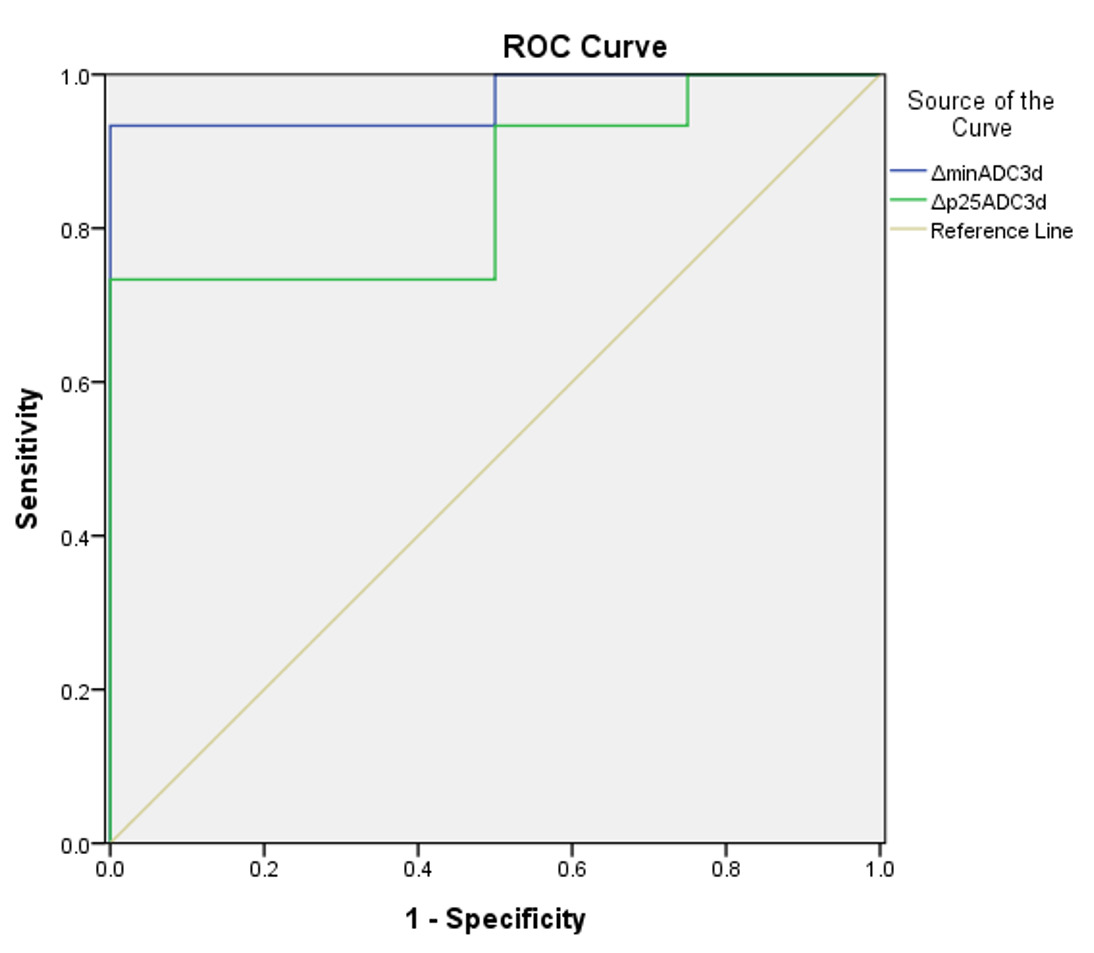
Figure 1 and 2 are two representative cases of responders and non-responders, including the T2-weighted image, DWI image, ADC map, and the ADC histogram acquired before (A-D) and after (E-H) the chemotherapy, respectively. Results of the Mann–Whitney U test of the histogram features between the two groups are shown in Figure 3. ΔminADC values of the responders were significantly higher than non-responders (7.42±13.88 versus -0.73±0.36; p < 0.01); ΔADC25 values of the responders were significantly higher than non-responders (0.19±0.23 versus -0.09±0.15; p < 0.05). Furthermore, results of ROC analysis are shown in Figure 4, indicating good predictions of treatment responsiveness of ΔminADC (AUC=0.967) and ΔADC25 (AUC=0.850), yielding a sensitivity of 93.3% and a specificity of 100%, and a sensitivity of 73.3% and a specificity of 100% to differentiate responders and non-responders, respectively.Discussion
Our preliminary study demonstrated the feasibility of using ADC histogram analysis to predict response to induction chemotherapy in patients with HNSCC. Among the extracted features, ΔminADC and ΔADC25 values could provide better performance in differentiating responders from non-responders after induction chemotherapy, probably because of an elevated water diffusion resulting from lower cellularity in the responsive tumorous regions. In addition, no significant differences were found in the delta change ratios of mean ADC and tumor volume between two groups, which emphasizes the possible limitation of using conventional comparisons of the mean ADC values. In conclusion, this study indicates the important role of whole volume histogram analysis of water diffusion. The ΔminADC and ΔADC25 values, could be potential biomarkers for predicting early response to induction chemotherapy in patients with HNSCC, which may facilitate the determination of further therapeutic strategy.Acknowledgements
This study was supported by the Ministry of Science and Technology, Taipei, Taiwan (MOST 108-2221-E-040-00MY3).References
1. Huang CC, et al, Investigating the associationbetween alcohol and risk of head and neck cancer in Taiwan. Sci Rep 2017, 7:9701. Doi: 9710.1038/s41598-41017-08802-41594
2. Chang CC, et al, Investigating the association between diet and risk of head and neck cancer in Taiwan. Oncotarget 2017, 8:98865-98875
3. Vokes EE, Induction chemotherapy for head and neck cancer: recent data. Oncologist 2010;15 Suppl 3:3-7
4. Payabvash S, Quantitative diffusion magnetic resonance imaging in head and neck tumors. Quant Imaging Med Surg 2018, 8(10):1052-65
5. Just N, Improving tumor heterogeneity MRI assessment with histogram. British Journal of Cancer 2014,111:2205-13
Figures