4738
Comparison of tumor cellular-interstitial water exchange rates measured by DCE-MRI and diffusion time-dependent diffusion kurtosis imaging
Jin Zhang1, Karl Kiser1, Ayesha Bharadwaj Das1, Chongda Zhang1, and Sungheon Gene Kim1
1New York University School of Medicine, New York, NY, United States
1New York University School of Medicine, New York, NY, United States
Synopsis
Cellular-interstitial water exchange rate is an important property of tumor, potentially associated with tumor aggressiveness and treatment response. It is not trivial to measure the water exchange rate, not to mention the challenges in measuring it at a high spatial resolution. In this study, we use the 3D-UTE-GRASP method1 to generate water exchange rate maps and compare them with those measured using diffusion time-dependent diffusion kurtosis imaging2.
Introduction
Water exchange rate (τex) may indicate tumor microstructural changes as well as the cellular metabolism that is related to tumor treatment response. Previously, we proposed a T1-weighted dynamic contrast enhancing (DCE)-MRI method3 to measure tumor intracellular water life time (τi) using more than one flip angle during the dynamic scan. In this study, we utilized the proposed method to map the water exchange rate parameter of the whole tumor at an isotropic high resolution. The DCE-MRI measured water exchange rate was compared with that from diffusion time-dependent diffusion kurtosis imaging (tDKI) measurement2.Methods
Six to eight-week-old C57BL6 mice (n = 3) with GL261 mouse glioma models were used for this study. MRI experiments were performed on a Bruker 7T micro-MRI system, with 1H four-channel phased array receive-only MRI coil. DCE-MRI acquisition with double flip angle (DFA) acquisition was used in order to reduce the uncertainty in estimation of the intracellular water lifetime (τi)3. Pre contrast T1 mapping was obtained with 3D-UTE-GRASP1 sequence (TR = 4 ms and TE = 0.028 ms) combined with three flip angles (8o, 2o, and 12o)4. Both the DCE-MRI and T1 measurement has image matrix size = 128x128x128, field of view (FOV) = 20x20x20 mm and the spatial resolution was 0.156x0.156x0.156 mm. DCE-MR images were reconstructed to have a temporal resolution of T = 5s/frame. The arterial input function (AIF) was estimated from multiple vessel voxels using the Principal Component Analysis (PCA) method reported previously3. The two compartment exchange model5 (2CXM) and three site two exchange water exchange model6 (3S2X) were used for DCE-MRI pharmacokinetic model analysis. Five parameters, interstitial space volume fraction (ve), vascular space volume fraction (vp), blood flow (Fp), permeability surface area product (PS) and intracellular water life time (τi) were estimated from the model fit. The water exchange rate τex = τi ve was computed from the estimated pharmacokinetic parameters. To cross-validate the estimated τex of tumor, tDKI method2 was implemented with diffusion times 200/400/600/800 ms and b-value of 200/500/1000/1500/2000/3000. The data analysis of tDKI for τex estimation was performed for the slice at the tumor center with slice thickness 1.2 mm and image matrix 80x80 and FOV=20 x 20 mm. Voxel size was 0.25 x 0.25 x 1.2 mm. The τex data from 8 slices (1.25 mm =0.156 mm x 8) of DCE-MRI measurement was compared with that from tDKI measurement from one slice. The mice were treated in strict accordance with the National Institutes of Health Guide for the Care and Use of Laboratory Animals, and this study was approved by the Institutional Animal Care and Use Committee.Results
Figure 1 shows the 3D rendering of the τex map of a tumor along with cross-sectional images in sagittal/coronal/axial slices. Figure 2 shows examples of τex maps generated from tDKI method (1 slice with voxel size 0.25x0.25x1.2mm) and DCE-MRI method (8 slices with voxel size 0.156x0.156x0.156 mm). Figure 3 shows comparison of τex between the two methods for the three animals. It can be observed that τex from tDKI method has smaller inter quartile range (IQR) possibly due to the large voxel size and a small number of voxels. However, our preliminary result shows that the τex estimated from the two methods are within a comparable range of each other.Discussion and Conclusion
In this study, we demonstrated the feasibility that the water exchange rate can be measured for whole tumor with the 3D-UTE-GRASP method with a 3D isotropic high resolution as well as tDKI measurement. Further study is warranted to investigate how each method can be used to characterize the tumor characteristics related to the water exchange rate in a complementary way.Acknowledgements
NIH R01CA160620, NIH R01CA219964, P41EB017183, NIH/NCI 5P30CA016087References
- J. Zhang, L. Feng, R. Otazo and S. Kim, MRM, 2019 Jan;81(1):140-152
- J. Zhang and S. Kim, ISMRM 2019 power poster
- J. Zhang and S. Kim, NMR Biomed. 2019 Nov;32(11):e4135.
- J. Zhang, K. Kiser, and S. Kim, submitted to ISMRM 2020
- S. P. Sourbron, D. L. Buckley. Phys Med Biol 2012;57(2):R1-33.
- H. M. McConnell. J Chem Phys 1958;28(3):430-431.
Figures
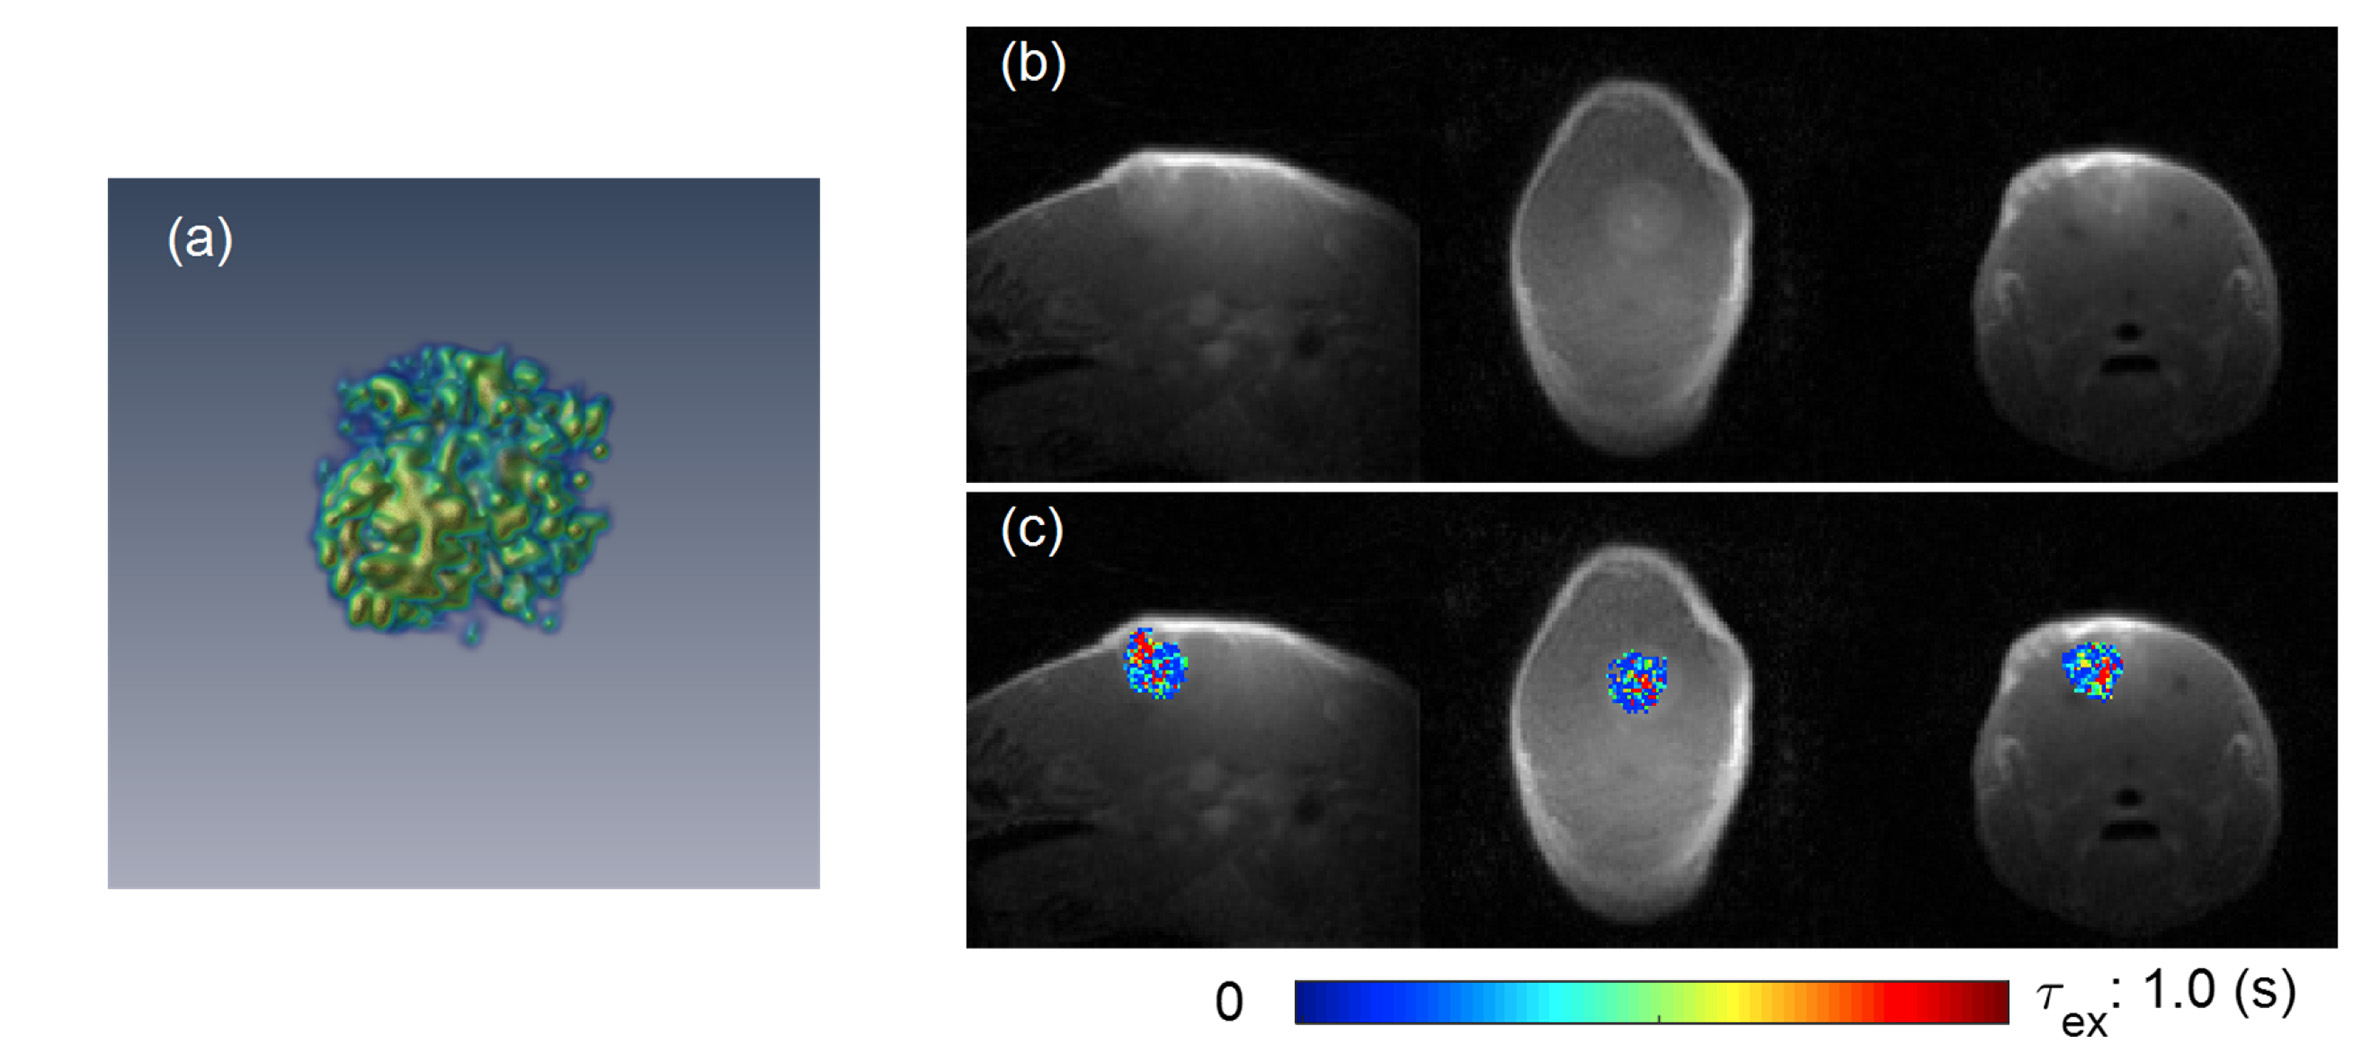
Figure 1. (a) 3D rendering of tumor τex map. (b) Tumor center
slices in mid-sagittal/coronal/axial directions. (c) Tumor τex maps in
mid-sagittal/coronal/axial directions.
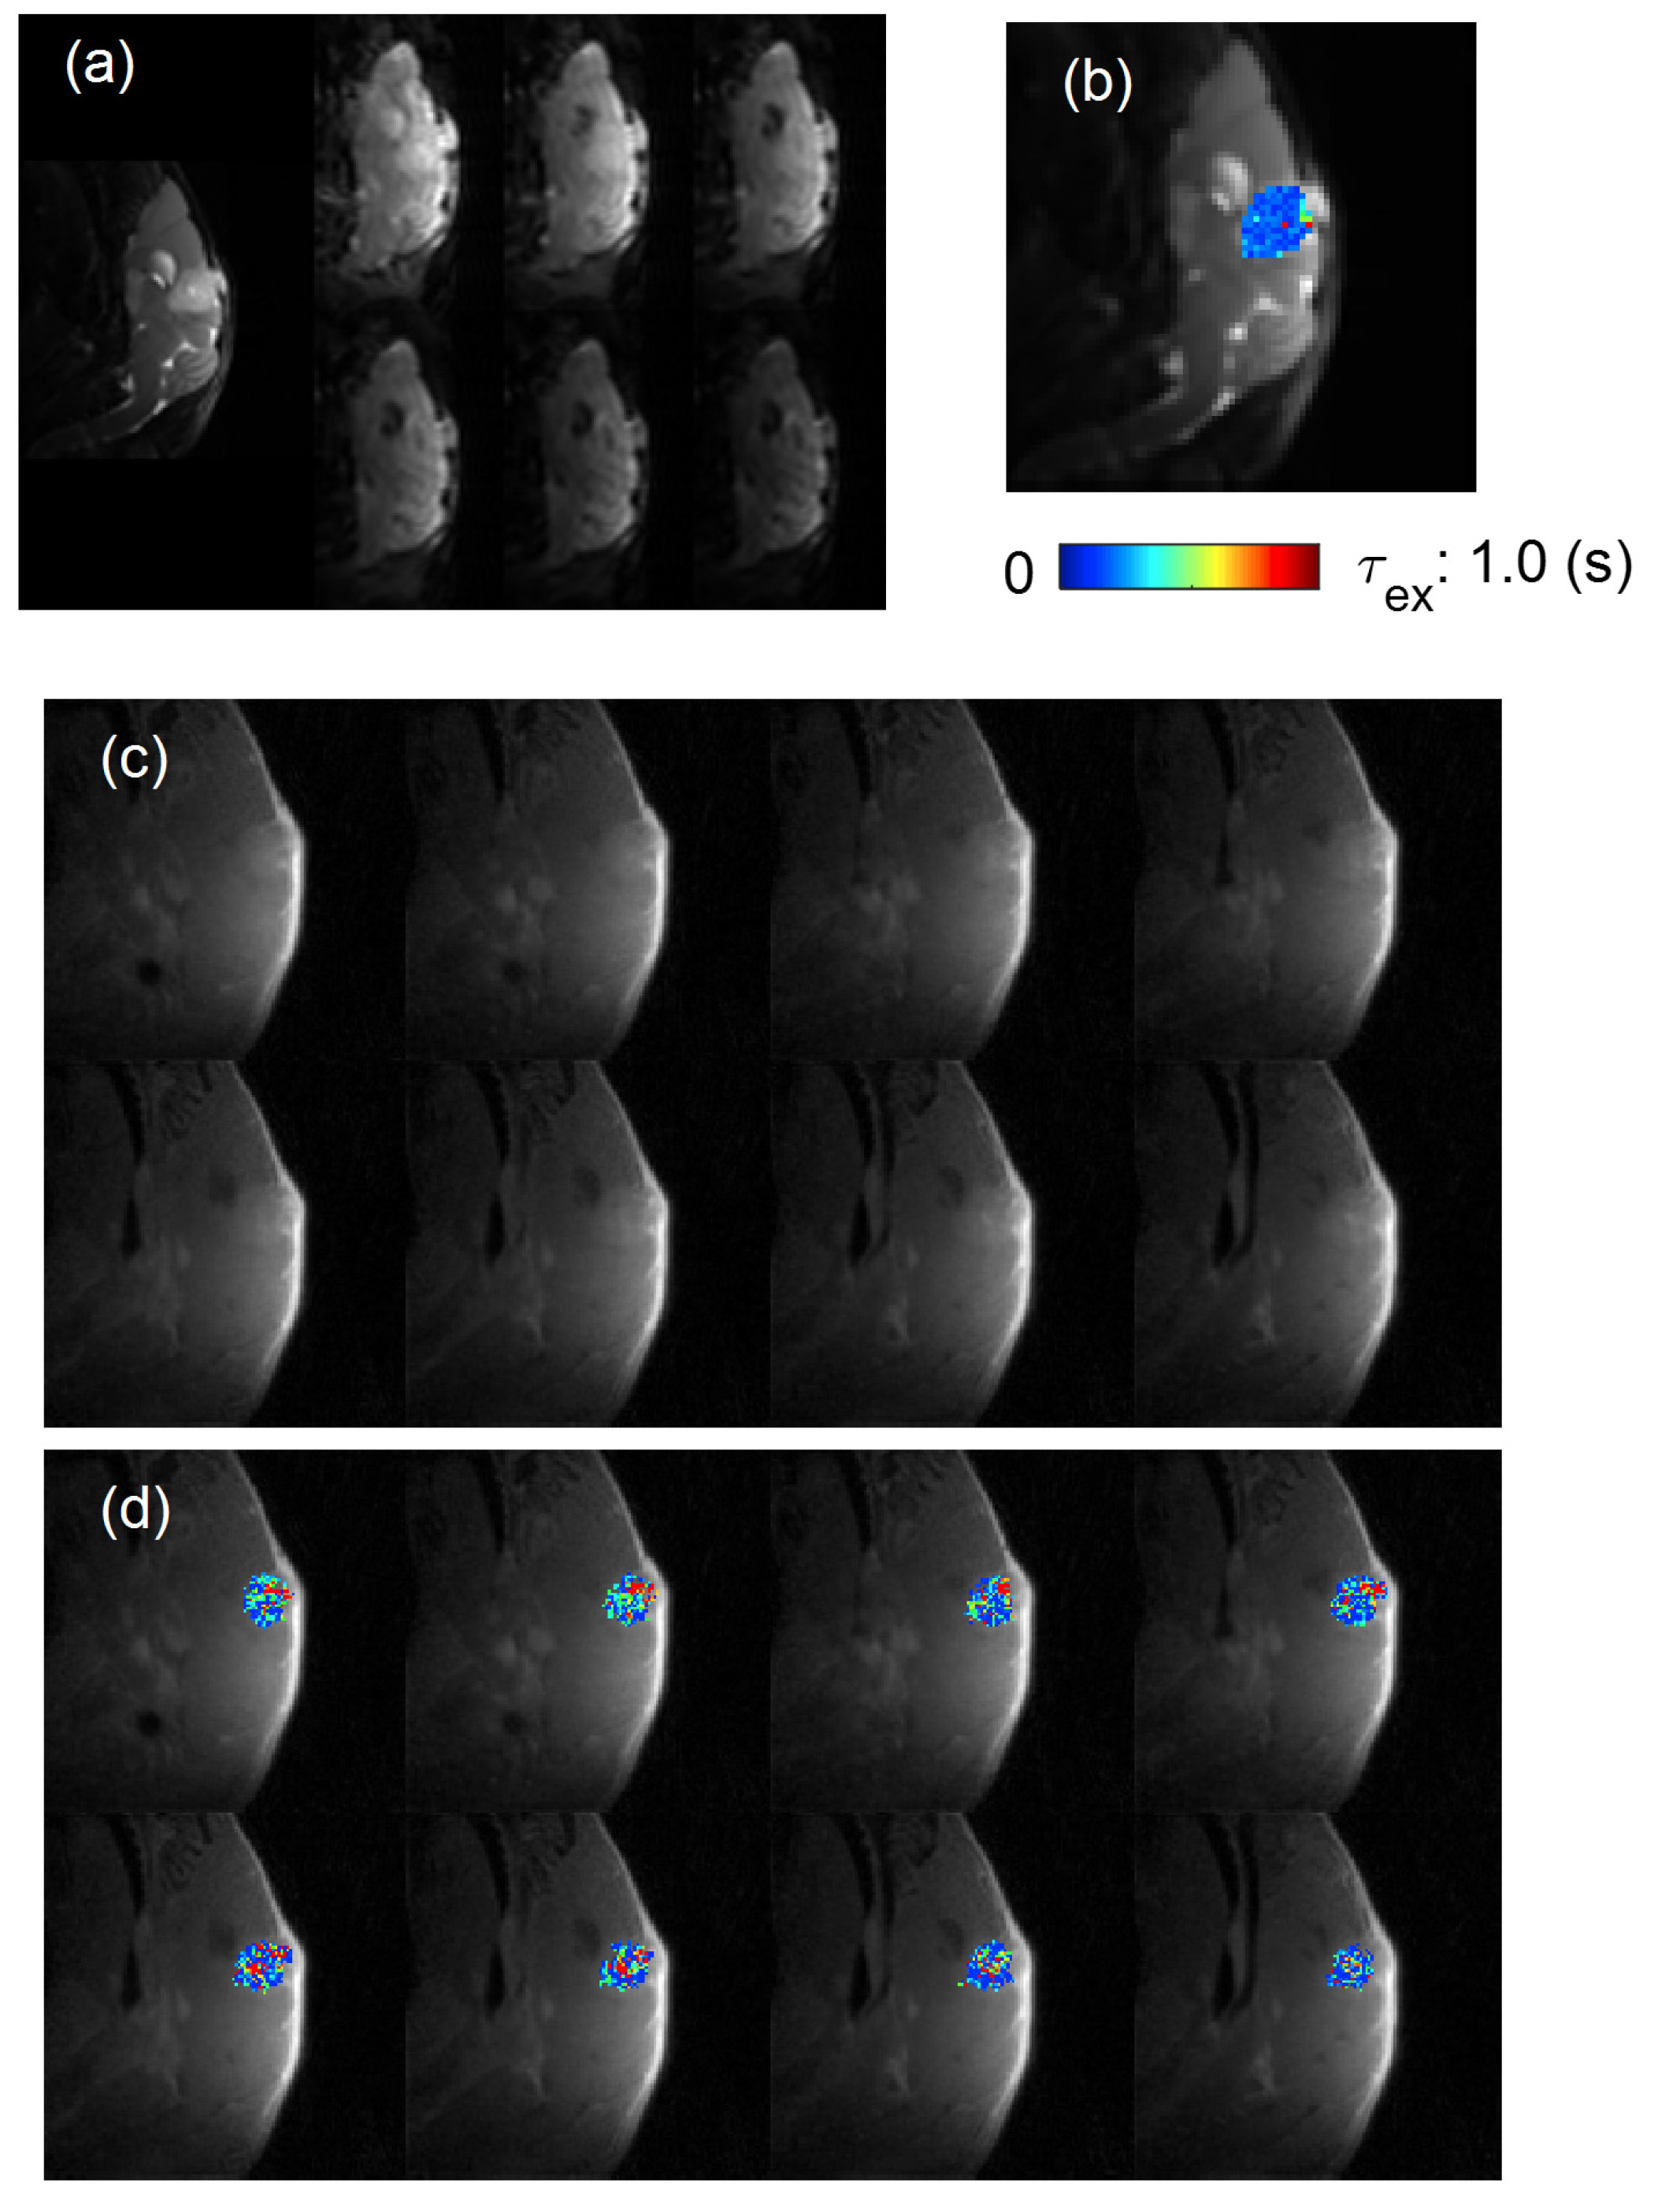
Figure 2. (a) RARE image of tumor center slice (1.2 mm
thickness) in sagittal direction and images of b-value = 200, 500, 1000, 1500, 2000, and 3000 for diffusion time =
200 ms. (b) tDKI estimated τex map. (c) DCE-MRI
slices (8 slices with 0.156 mm slice thickness) matching the slice in (a). (d)
DCE-MRI estimated τex maps.
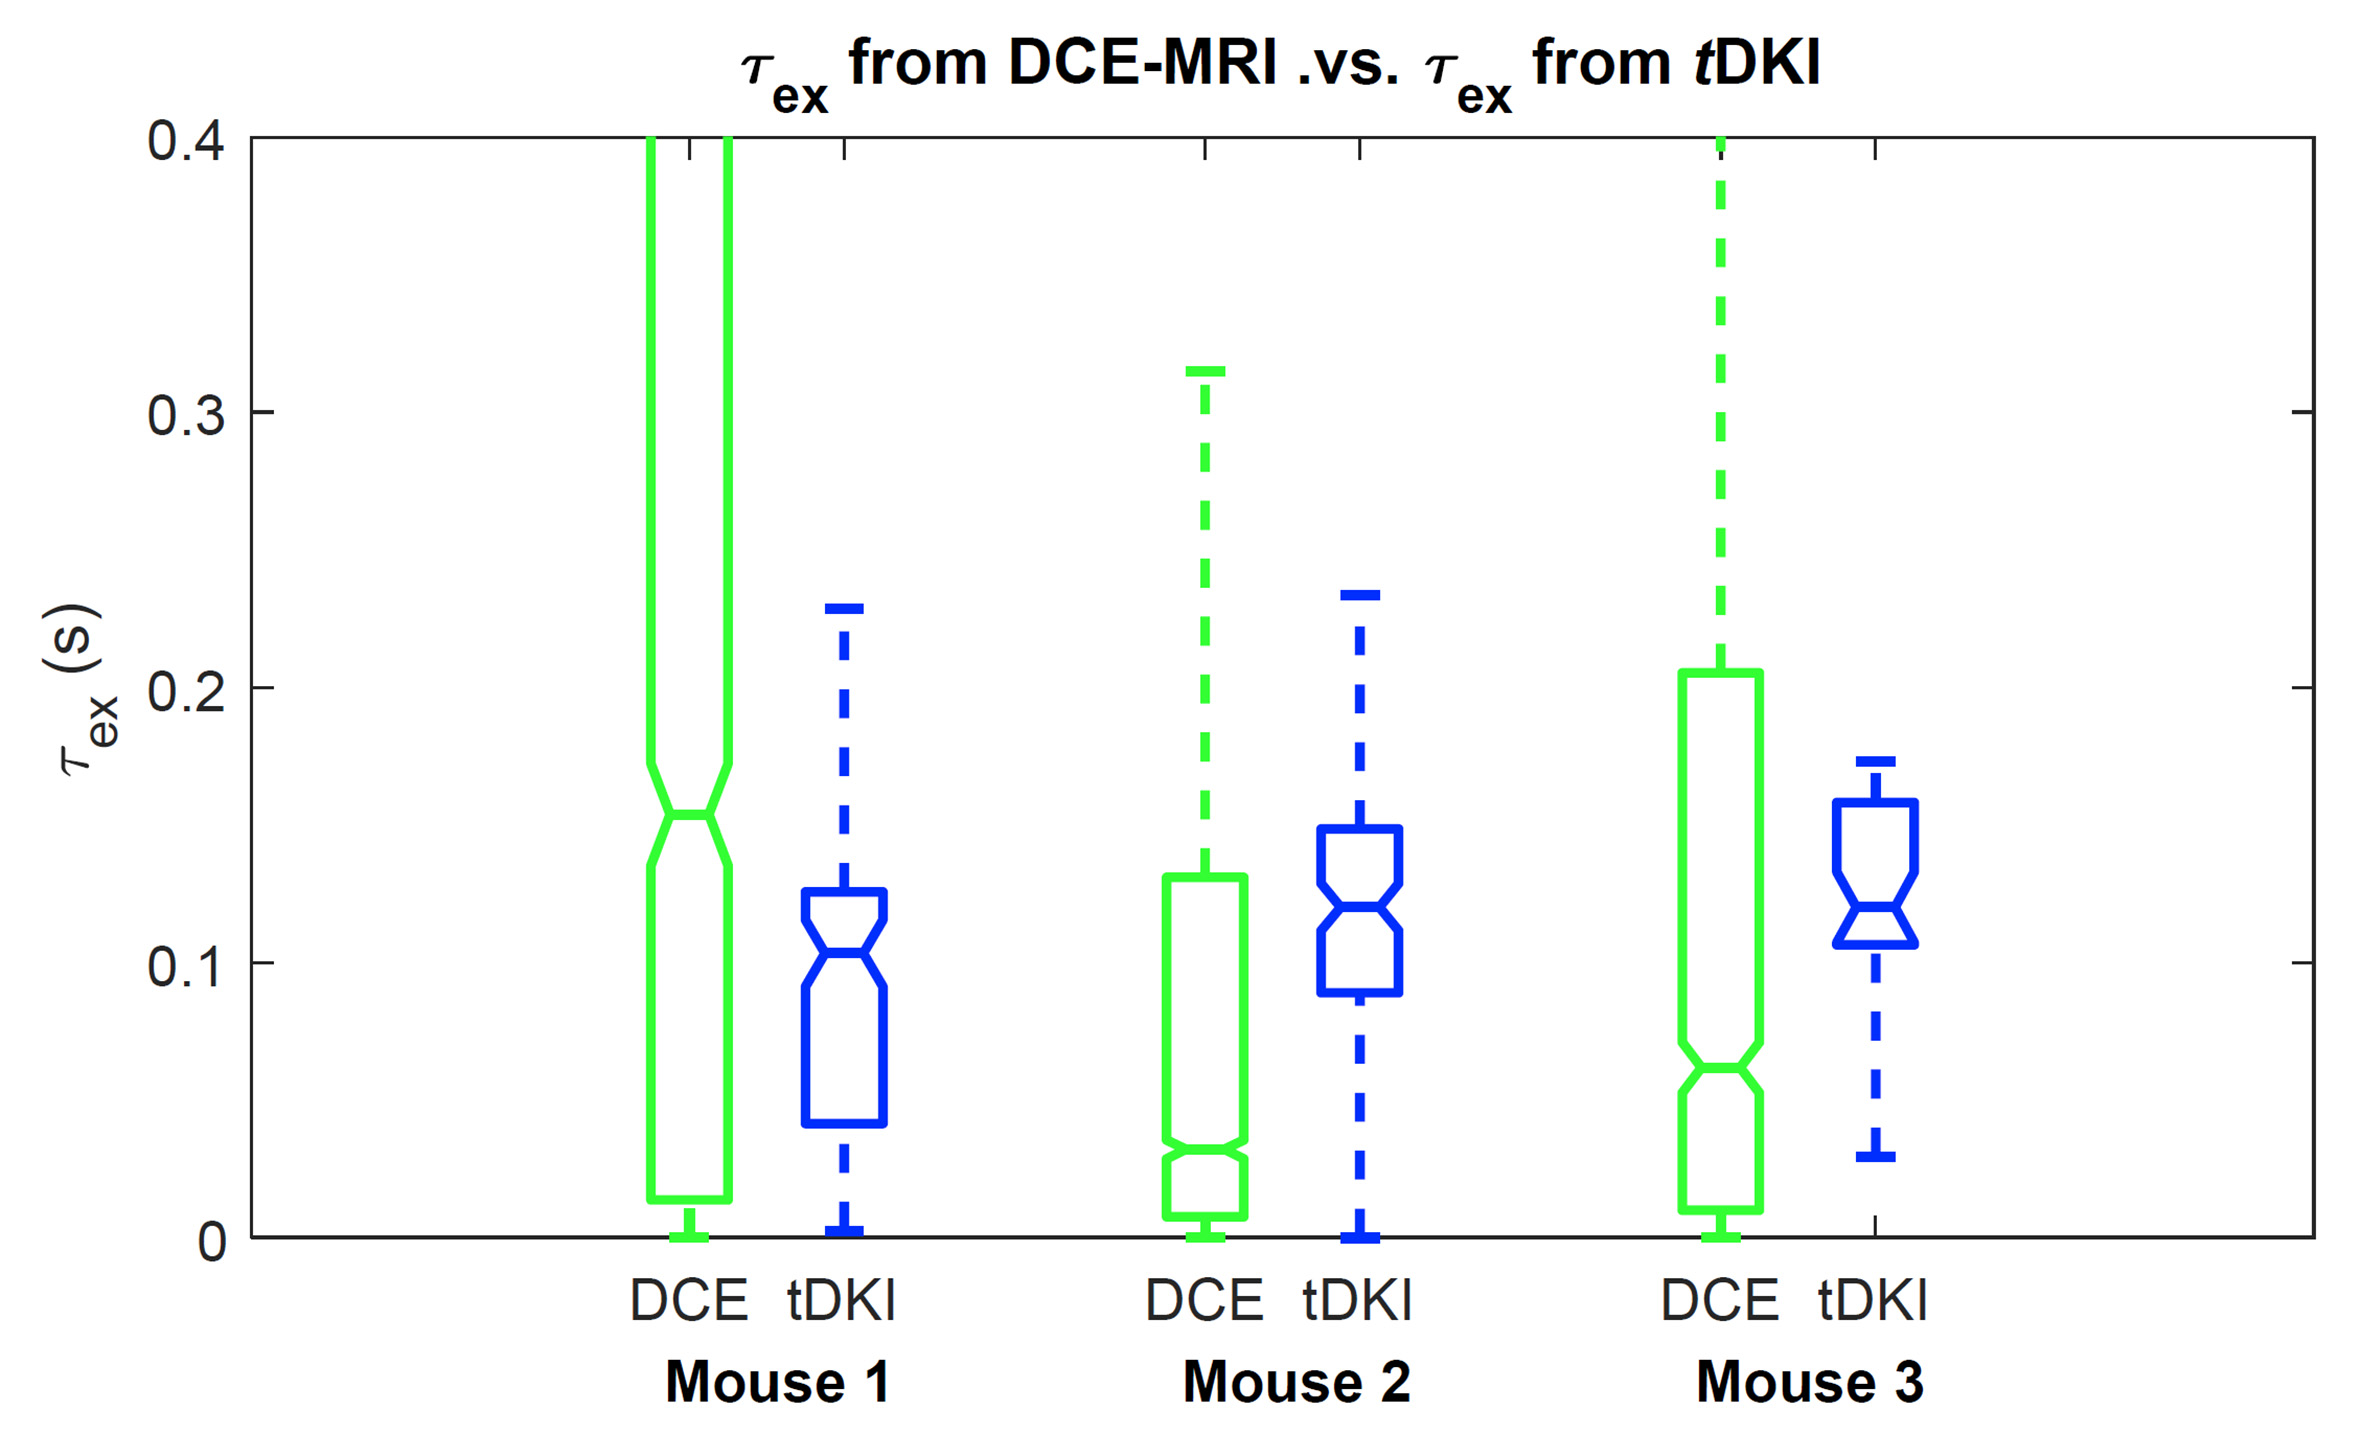
Comparison of τex measurement between the two methods for the three animals.