4737
Accuracy and precision of preclinical renal T2 mapping using monoexponential fitting and dictionary matching methods1ISR-Lisboa/LARSyS and Department of Bioengineering, Instituto Superior Técnico – Universidade de Lisboa, Lisbon, Portugal, 2Berlin Ultrahigh Field Facility (B.U.F.F.), Max Delbrück Center for Molecular Medicine in the Helmholtz Association, Berlin, Germany
Synopsis
Parametric mapping of T2* and T2 can be used to evaluate renal blood oxygenation. Efficient T2 mapping can be performed using a multi spin-echo sequence and fitting the pixel-wise signal with a monoexponential model although known to introduce T2 bias, or by matching it to pre-computed Echo Modulation Curves, accounting for all echo pathways. A Monte Carlo simulation was performed using a numerical kidney phantom to evaluate accuracy and precision of both approaches under the influence of noise. The results demonstrated an improved T2 accuracy using the EMC method compared to monoexponential fits and low dependence on tissue-type.
Introduction
Insufficient oxygen-supply (hypoxia) to the kidney is thought to be an important factor in developing acute and chronic kidney diseases1. T2* mapping is frequently used to provide relevant information on renal blood oxygenation2. Quantitative estimation of blood oxygenation requires removing the contribution of T2 from T2*. Multi spin-echo (MSE) sequences have been prescribed for efficient T2 mapping, performed by fitting the pixel-wise signal with the T2 decay monoexponential model. However, some pitfalls are present when using MSE due to strong signal contamination3. Several approaches have been suggested to minimize this, such as removing the first or odd-numbered echoes or adding an offset parameter, but neither completely eliminates T2 bias4. Recently, dictionary-based methods have been suggested to improve T2 accuracy, accounting for the stimulated echoes and effective B1+ field3. The use of dictionary-based methods is still fairly novel and its application to kidney T2 mapping has not yet been explored. We propose to compare both T2 estimation methods in the kidney.Methodology
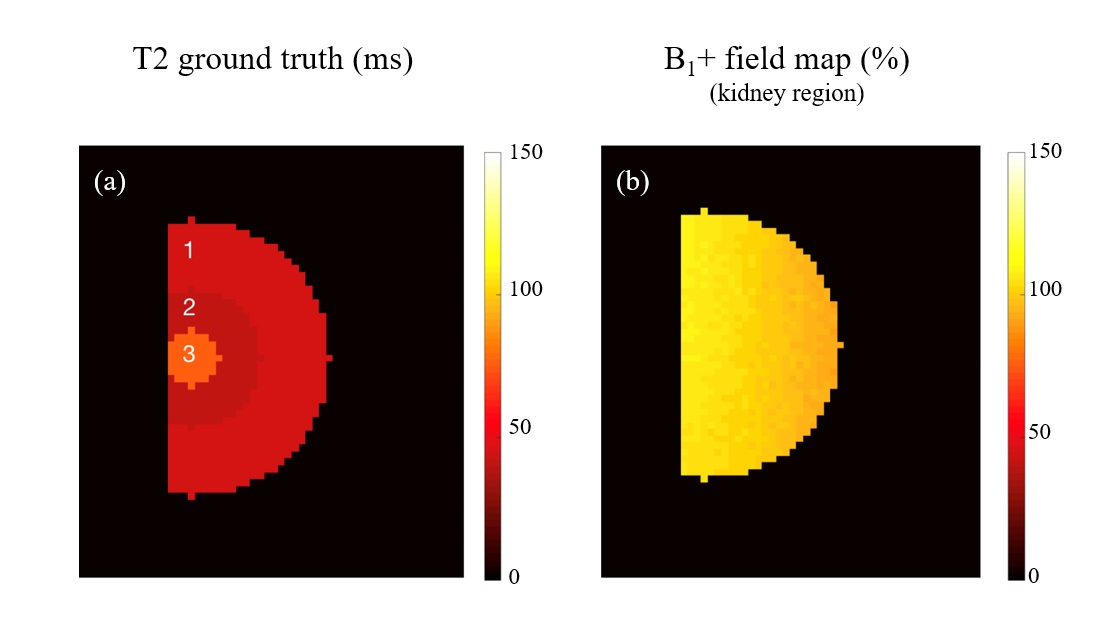
A numerical kidney phantom was generated considering three tissues: Inner Medulla (IM), Outer Medulla (OM) and Cortex (CTX), assuming a fixed T1 = 1300 ms5 and varying T2 2 and proton density6 (CTX = 40 ms / 80; OM = 45 ms / 84 and IM = 75 ms / 88). T1/T2 and protocol parameters typical for kidney imaging of a Wistar rat on a 9.4T small animal scanner (Bruker Biospec, Ettlingen, Germany) with a transreceiver birdcage coil were considered for the simulations. B1+ map computed using the double flip angle method7,8 was then considered in simulation work. The Echo Modulation Curves (EMC) dictionary was computed using the Extended Phase Graph (EPG)9 and used to simulate the T2-weighted signal. EMC dictionary considered an MSE sequence: 90º excitation and 12 (dTE = 10 ms) consecutive 180º refocusing pulses, a T2 range of [10:1:150] ms and a B1+ range of [60:10:140]% 10,11. Averaged Signal-to-Noise ratio (SNR) of 60 was simulated for the first echo in the IM tissue. Monte Carlo simulation with 100 noise-adding instances was performed. T2 maps were computed for each repetition with: the monoexponential fit with all echoes and without the first echo and dictionary matching. For the monoexponential fitting methods, MATLAB’s function with the “Trust Region algorithm” was used to fit to the function S(t) = S0exp(-t/T2), where S0 represents equilibrium magnetization (initialized with each pixel’s maximum signal) and T2 initialized with the echo time corresponding closest to 37% of the maximum. Averaged T2 maps and standard deviation across repetitions were calculated. T2 accuracy (absolute error relative to ground truth) and precision (standard deviation divided by the mean value) were evaluated to compare all methods. Simulations were carried out using MATLAB in a MacBook Pro (Intel Core i5, 2.3 GHz; RAM = 8 GB). Pixel-wise T2 estimation with the monoexponential fit took 35.27s, while EMC took 0.15s per image.Results
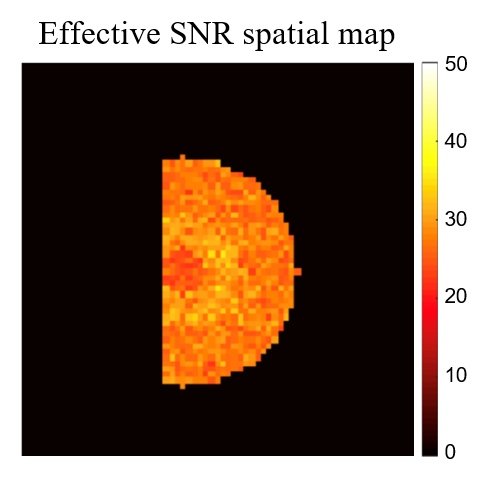
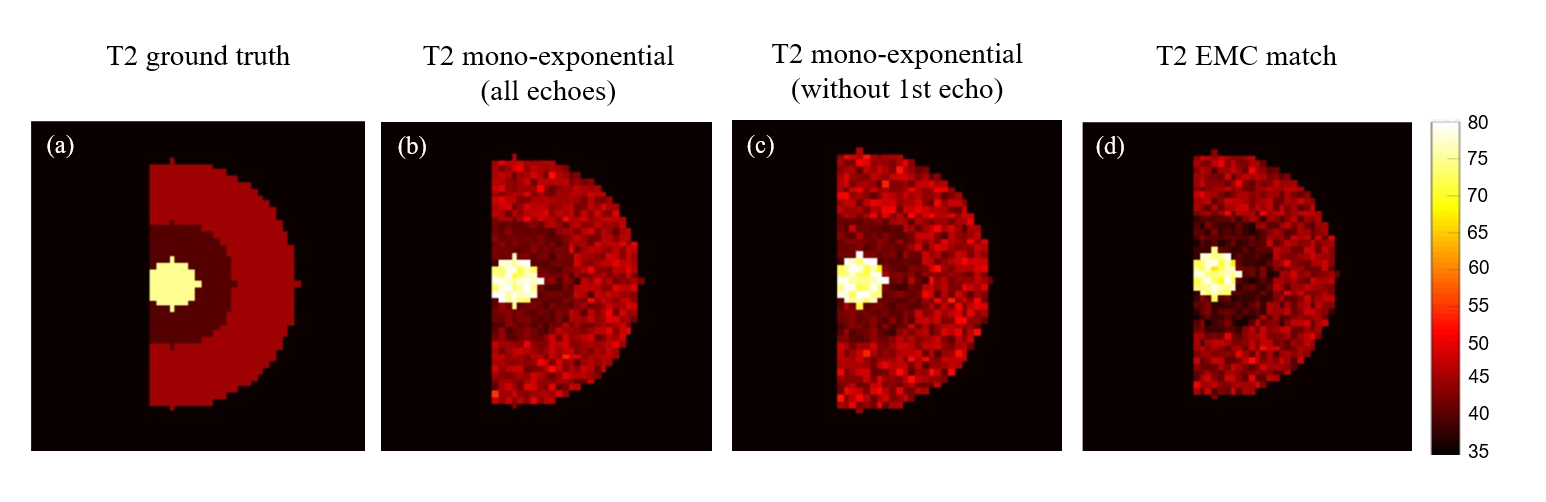
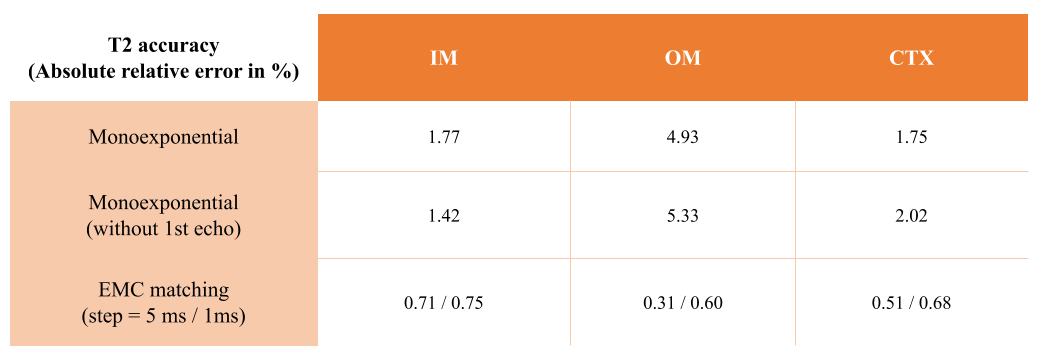
Figure 1 shows the numerical kidney phantom and spatial B1+ field distribution. Effective spatial SNR map is shown in Figure 2, and can be seen to depend on the intrinsic B1+ spatial distribution. T2 maps obtained with each method are shown in Figure 3. A slight T2 overestimation is noticeable with both monoexponential fitting methods compared to ground truth and the T2 EMC map, in accordance to previous findings3,4.T2 accuracy and precision calculated per tissue and per method are summarized in Figure 4 and 5. T2 accuracy improved using the EMC method compared to monoexponential fitting, with a decreased error for all tissue-types (IM: 0.75% vs 1.77%, OM: 0.60% vs 4.93% and CTX: 0.68% vs 1.75%). Only a slight difference between the two monoexponential methods was noticeable, due to similar signal intensities observed for the first and second echoes. No major differences were seen in T2 precision between all methods (Figure 5). Slight increase in T2 precision (lower coefficient) was observed with T2 EMC with a smaller step resolution (1 ms). This was expected since the T2 range of values that can be estimated with EMC is intrinsically confounded by the computed dictionary resolution; the smaller the step, the wider the estimation range.Discussion and conclusions
Overall, T2 accuracy was improved with a dictionary-based method compared to monoexponential, in agreement with previous findings3. T2 estimation with monoexponential was slightly overestimated and less robust to tissue-type and B1+ variations. While an MSE protocol with consecutive 180º pulses based on an ex-vivo preclinical protocol was considered. In other applications where T2 mapping is required over longer periods, excessive use of consecutive 180º pulses would be less advisable due to specific absorption rate (SAR) tissue-deposition. Thus, reducing flip angle amplitudes is commonly performed, thus increasing signal contamination and further worsen T2 monoexponential accuracy. Aspects such as slice profile and constraining T2 dictionary search to restricted B1+ values should be explored in future work. In summary, both methods present pros and cons that should be considered. T2 monoexponential methods may be easier to implement. However, dictionary-based methods enabled a more robust and time-efficient T2 mapping with potential simultaneous B1+ estimation10,11, although requiring knowledge of the acquisition parameters and RF characteristics.Acknowledgements
Portuguese Foundation for Science and Technology (FCT - UID/EEA/50009/2019) and POR Lisboa 2020 (LISBOA-01-0145-FEDER-029686). German Research Council (DFG; Collaborative Research Centre SFB 1365 Renoprotection). German Ministry for Education and Research (BMBF; Grant VIP 03P00081).References
1 Singh P, Ricksten SE, Bragadottir G, et al. Renal oxygenation and haemodynamics in acute kidney injury and chronic kidney disease. Clin Exp Pharmacol Physiol. 2013; 40:138-147.
2 Pohlmann A, Arakelyan K, Hentschel J, Cantow K, Flemming B, Ladwig M, Waiczies S, Seeliger E, Niendorf T. Detailing the relation between renal T2* and renal tissue pO2 using anintegrated approach of parametric magnetic resonance imaging and invasive physiologicalmeasurements. Invest Radiol. 2014; 49:, 547-560.
3 Ben-Eliezer N, Sodickson D K, Block K T. Rapid and accurate T2 mapping from multi-spin-echo data using Bloch-simulation-based reconstruction. Magn Reson Med, 2015; 73: 809-817.
4 McPhee KC, Wilman AH. Limitations of skipping echoes for exponential T2 fitting. J Magn Reson Imaging. 2018; 48:1432–1440.
5 Kierulf-Lassen C, Nielsen PM, Qi H, Damgaard M, Laustsen C, Pedersen M, Krag S, Birn H, Norregaard R, Jespersen B. Unilateral nephrectomy diminishes ischemic acute kidney injury through enhanced perfusion and reduced pro-inflammatory and profibrotic responses. PLoS ONE. 2017; 12(12): e0190009.6 Brix G, Schard LR, Lorenz WJ. Evaluation of proton density by magnetic resonance imaging: phantom experiments and analysis of multiple component proton transverse relaxation. Physics in Medicine Biology. 1990; 35(1): 53-66.
7 Akoka S, Franconi F, Seguin F, Le Pape A. Radiofrequency map of an NMR coil by imaging. Magn Reson Imaging. 1993; 11:437-441.
8 Insko EK, Bolinger L. Mapping of the radiofrequency field. J Magn Reson. 1993; 103:82-85.
9 Weigel, M. Extended phase graphs: Dephasing, rf pulses, and echoes - pure and simple. JMRI, 41:266–295, 2015.
10 Santos N, Teixeira R, Hajnal J and Nunes RG. Assessing the accuracy of T2 and B1 maps estimated from multi-echo spin echo MRI sequences using extended phase graph signal predictions. In the proceedings of 24th ISMRM, Singapore, 2016.
11 Freitas AC, Sousa I, Gaspar AS, Teixeira R PAG, Hajnal J and Nunes RG. Improving T2 and B1 parametric estimation in the brain with multi spin-echo MR and fusion bootstrap moves solver (FBMS). In proceedings of 27th ISMRM, Montreal 2019.
Figures