4736
Quantifying heterogeneity in DW-MRI and DCE-MRI data of breast cancer for the prediction of treatment response: Preliminary results1University of Texas at Austin, Austin, TX, United States, 2University of Alabama at Birmingham, Birmingham, AL, United States
Synopsis
We investigate multiparametric analysis of DW- and DCE-MRI data to identify tumor subregions indicative of response in breast cancer patients undergoing neoadjuvant therapy (NAT). The analysis showed significant increases in low vascular perfusion, low cellularity subregions early in the course of NAT for patients who achieved pathological complete response and significant decreases in high vascular perfusion, high cellularity subregions on the border with parenchyma. High-dimensional analysis of multimodal MRI data can be utilized to identify subregions of response within patients and these characterizations of intratumoral heterogeneity can potentially be used to guide therapy for improved patient outcome.
Introduction
Early measures of response to neoadjuvant therapy (NAT) could provide an opportunity to replace an ineffective treatment with an alternative regimen, thereby potentially improving outcomes and curtailing unnecessary toxicities. Initial changes in intratumoral cellular and vascular heterogeneity after treatment could serve as early indicators of treatment response and allow for guidance and optimization of treatment plans for improved patient outcome. Habitat imaging1 is an emerging approach in oncology to characterize intratumoral heterogeneity through high-dimensional analysis of multimodal MRI data. We investigate multiparametric analysis of vascular and cellular characteristics derived from dynamic contrast-enhanced MRI (DCE-MRI) and diffusion-weighted MRI (DW-MRI) to identify discrete tumor habitats of response in breast cancer patients receiving NAT.Methods
DW- and DCE-MRI AcquisitionWomen with stage II/III triple negative breast cancer (N=7) were scanned using 3T Siemens Skyra equipped with 8- or 16- channel receive double breast coil (Sentinelle, Invivo), at four time points during the course of NAT: prior to treatment (t1), following one round of therapy (t2), midpoint prior to altering therapeutic regimens (t3), and following one cycle of new therapeutic regimens (t4). Pathological complete response (pCR) and non-pCR was determined at the time of surgery. DW-MRI was acquired with an echo-planar, monopolar spin echo sequence with a matrix size of 128 × 128, FOV of 256 × 256 mm, TR/TE = 3000/52 ms, b-values = 200 and 800 s/mm2, and a GRAPPA acceleration factor of 2. DCE-MRI data was collected with a matrix size of 192 × 192, FOV of 256 × 256 mm, TR/TE = 7.02/4.6 ms, α = 6º, and a GRAPPA acceleration factor of 2, allowing each 10-slice volume to be collected every 7.27 s for 8 minutes. After acquisition of the first minute of dynamic scans, a catheter placed within an antecubital vein delivered 10 mL of Gadavist (Bayer, Whippany, NJ) at 2 mL/sec via power injector.
DW- and DCE-MRI Processing and Identifying Tumor Habitats
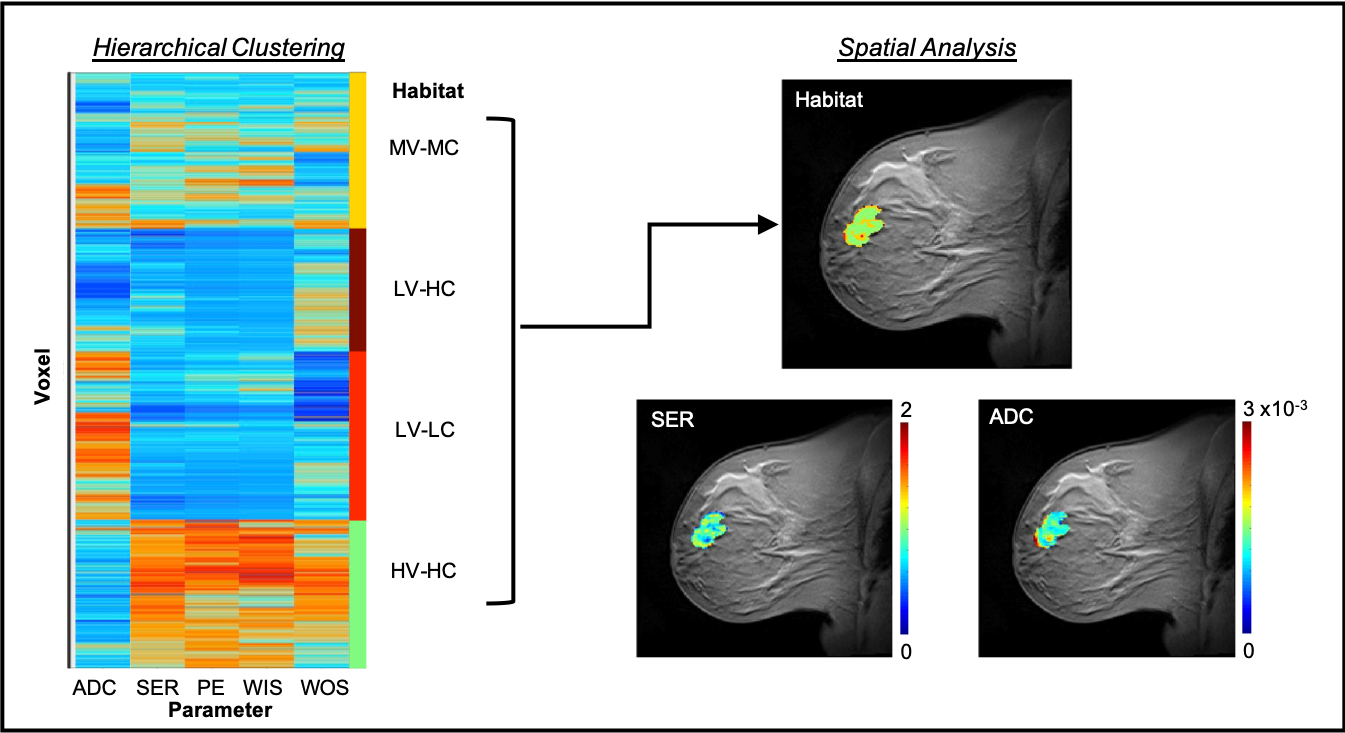
DW-MRI data was interpolated to DCE-MRI spatial resolution and the apparent diffusion coefficient (ADC) values were quantified for every voxel. Four semi-quantitative parameters were calculated from DCE-MRI data for each voxel: percent enhancement (PE), signal enhancement ratio (SER), wash-in slope (WIS), and wash-out slope (WOS). A fuzzy c-means algorithm was used to automatically segment tumor regions-of-interest (ROIs) using background subtracted DCE-MRI data.2 The ADC, PE, SER, WIS and WOS maps were then pooled together across patient scans to identify distinct tumor habitats, using hierarchical clustering (non-spatial) of tumor voxel data.
Spatial Analysis of Intratumoral Heterogeneity
For each patient visit, the identified habitats were mapped back into the spatial domain and a neighborhood analysis was performed3 to quantify the size of individual habitats and borders between habitats and surrounding parenchyma. The habitat and border sizes were then normalized by total tumor volume. Normalized values were averaged across patient groups (pCR and non-pCR) and statistical differences between pCR and non-pCR patients across visits was assessed using a two-sample t-test.
Results
The dendrogram resulting from hierarchical clustering of MRI data (Figure 1) was cut, based on dendrogram height, to yield four distinct tumor subregions: high vascular perfusion-high cellularity (HV-HC), medium vascular perfusion- medium cellularity (MV-MC), low vascular perfusion-high cellularity (LV-HC), and low vascular perfusion-low cellularity (LV-LC). No statistically significant differences were observed in habitat sizes or border sizes at baseline (t1) between pCR and non-pCR patients (p>0.05). After one round of therapy at t2, a significant decrease in the size of parenchyma and HV-HC borders was observed in pCR patients compared to non-pCR patients (p=0.03), a trend which was also observed at t3 (p=0.01). Additionally, a significant increase in the size of LV-LC habitats was observed at t2 in pCR patients compared to non-pCR patient (p<0.01) a difference which continued at t3 (p=0.05).Discussion & Conclusion
These preliminary results demonstrate that habitat imaging analysis of DW- and DCE-MRI data can yield tumor subregions that are indicative of therapeutic response early in the course of NAT. After one round of therapy, patients with pCR demonstrated decreases in identified high vascular perfusion, high cellularity habitats adjacent to breast parenchyma, i.e. at the edges of the tumor, as well as increases in the size of low vascular perfusion, low cellularity habitats. These characterizations of intratumoral heterogeneity can potentially be used to predict treatment response and guide therapy for patients with breast cancer. Future work will involve inter-visit registration of patient data to identify longitudinal changes in tumor spatial composition in response to therapy and improve models of tumor growth and evolution.Acknowledgements
CPRIT RR160005, NCI U01CA174706, U01CA142565, ACS RSG-18-006-01-CCE, and T32EB007507. The authors thank Stephanie L. Barnes for contributions to image processing software used in this research.References
1. Jardim-Perassi, B. V., Martinez, G. & Gillies, R. Habitat imaging of tumor evolution by magnetic resonance imaging (MRI). in Radiomics and Radiogenomics (eds. Li, R., Xing, L., Napel, S. & Rubin, D. L.) 115–120 (Chapman and Hall/CRC, 2019). doi:10.1201/9781351208277-7.
2. Chen, W., Giger, M. L. & Bick, U. A Fuzzy C-Means (FCM)-Based Approach for Computerized Segmentation of Breast Lesions in Dynamic Contrast-Enhanced MR Images1. Acad. Radiol. 13, 63–72 (2006).
3. Wu, J. et al. Intratumoral Spatial Heterogeneity at Perfusion MR Imaging Predicts Recurrence-free Survival in Locally Advanced Breast Cancer Treated with Neoadjuvant Chemotherapy. Radiology 172462 (2018) doi:10.1148/radiol.2018172462.
Figures