4734
Response Evaluation in Osteosarcoma: RECIST1.1 criteria Versus Intravoxel Incoherent Motion
Esha Baidya Kayal1, Devasenathipathy Kandasamy2, Kedar Khare3, Sameer Bakhshi4, Raju Sharma2, and Amit Mehndiratta1,5
1Centre for Biomedical Engineering, Indian Institute of Technology, Delhi, New Delhi, India, 2Radio Diagnosis, All India Institute of Medical Sciences, New Delhi, New Delhi, India, 3Department of Physics, Indian Institute of Technology, Delhi, New Delhi, India, 4Department of Medical Oncology, Dr. B.R. Ambedkar Institute-Rotary Cancer Hospital (IRCH), All India Institute of Medical Sciences, New Delhi, New Delhi, India, 5Department of Biomedical engineering, All India Institute of Medical Sciences, New Delhi, New Delhi, India
1Centre for Biomedical Engineering, Indian Institute of Technology, Delhi, New Delhi, India, 2Radio Diagnosis, All India Institute of Medical Sciences, New Delhi, New Delhi, India, 3Department of Physics, Indian Institute of Technology, Delhi, New Delhi, India, 4Department of Medical Oncology, Dr. B.R. Ambedkar Institute-Rotary Cancer Hospital (IRCH), All India Institute of Medical Sciences, New Delhi, New Delhi, India, 5Department of Biomedical engineering, All India Institute of Medical Sciences, New Delhi, New Delhi, India
Synopsis
Osteosarcoma (OS) is the most common primary malignant bone tumor in children and adolescents. Monitoring treatment response during chemotherapy might help in better and personalized therapeutic options improving overall therapeutic outcome. RECIST1.1 is the standard imaging based non-invasive treatment response evaluation criteria in solid tumors. Quantitative Intravoxel incoherent motion (IVIM) parameters and their histogram analysis were performed in Osteosarcoma in characterizing chemotherapy response with respect to RECIST1.1 criteria. IVIM parameters and its histogram analysis revealed clinically useful information in characterizing chemotherapy response in Osteosarcoma.
Purpose
Osteosarcoma (OS) is the most common primary malignant bone tumor in children and adolescents1. Five-year disease-free survival rate for localized OS is 60–70%, whereas disease free survival rate is less than 20% in patients presenting with metastasis1. Monitoring treatment response during chemotherapy might help in better and personalized therapeutic options improving overall therapeutic outcome2–5. RECIST1.1 is the standard imaging based non-invasive treatment response evaluation criteria in solid tumors6. Purpose was to investigate the quantitative Intravoxel incoherent motion (IVIM)7 parameters and their histogram analysis in characterizing chemotherapy response in Osteosarcoma with respect to RECIST1.1 criteria.Methods
IVIM dataset for twenty patients (n=30; Male:Female=22:8; Age=17.4±2.3years; Metastatic:localized=18:12) with Osteosarcoma were acquired. All patients underwent 3 cycles of neoadjuvant chemotherapy (NACT) at every 3 weeks. IVIM dataset were acquired at three time-points – pre-NACT (t0), after 1stNACT (t1) and after 3rdNACT (t2) using free breathing Spin Echo-Echo Planar imaging with varying gradient strengths at 11 b-values (0,10,20,30,40,50,80,100,200,800 sec/mm2). Tumor volume (in cc) at different time-points was determined separately using region of interest (ROI) drawn manually by an expert radiologist across the tumor on each b=800sec/mm2 DWI image (DWI800) with reference to the morphological T1W and T2W images at three time-points. Tumor-diameter (in cm) was measured at all three time-points using demarcated ROI having the maximum cross-sectional area of tumor. Changes in tumor-diameter across time were calculated and RECIST1.1 criteria6 was calculated as Complete-response (CR): total disappearance of tumor; Partial-response (PR): Minimum 30% decrease in tumor-diameter; Progressive-disease (PD): minimum 20% and 5 mm absolute increase in tumor-diameter; Stable-disease (SD): neither PR nor PD. Apparent diffusion coefficient(ADC) and IVIM parameters such as Diffusion coefficient(D), Perfusion coefficient(D*), Perfusion fraction(f) were estimated in tumor volume at different time-points (t0,t1&t2) using state-of –the art IVIM analysis methodology, bi-exponential model with Total Variation(TV) penalty function (BE+TV)8. It has been shown that BE+TV may be more reliable for IVIM analysis compared to voxel-wise fitting of the IVIM bi-exponential (BE) model8. Histogram analysis (mean, standard-deviation, skewness, kurtosis, entropy) was performed on quantitative parameters (ADC,D,D*&f) and compared with RECIST1.1 score. One-way ANOVA followed by Tukey post-hoc test was used to evaluate statistical significance (p<0.05) in parameters between response groups. Performance of significant parameters in identifying NACT response was assessed using Receiver-operating-characteristic curve (ROC) analysis at time-points t0 and t1. Quantitative parameters evaluation and histogram analysis was performed using an in-house built toolbox in MATLAB® (MathWorks Inc., v2017, Philadelphia, USA) and statistical analysis were performed using SPSS 16.0 software.Results
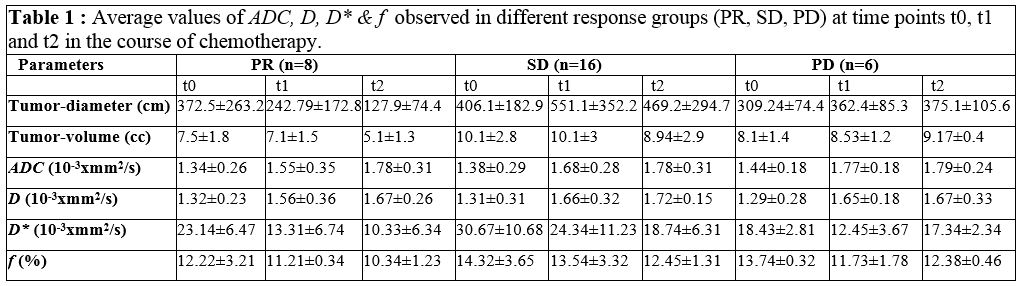
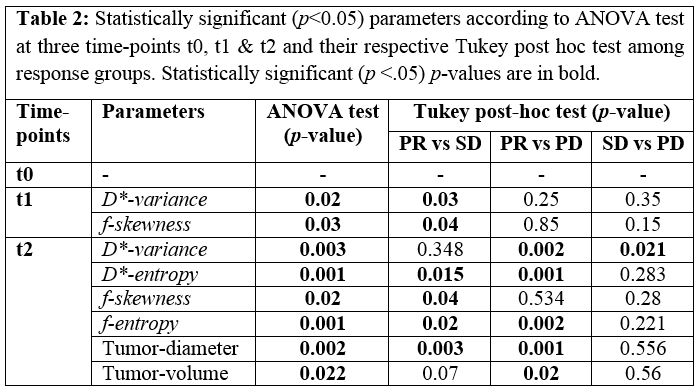
At t0, average tumor-diameter and tumor-volume in patient cohort were 9.48 ± 3.23 cm and 532.45 ± 518.77cc respectively and average ADC and D were observed as 1.39±0.3x10⁻³ mm2/s & 1.3±0.3 x10⁻³ mm2/s respectively and average D* and f were observed as 28.44±10.34x10⁻³ mm2/s & 13.95±2.83% respectively among all patients. According to RECIST1.1 criteria, 8 (27%), 16 (53%) and 6 (20%) patients were categorized as partial-responder (PRs), stable-disease (SD) and progressive-disease (PD) respectively. Tumor-diameter and tumor-volume significantly decreased in PR (~35% & ~55%), increased (~16% % ~45%) among PD group (~16% % ~45%) and did not change noticeably among SDs (~10% & ~4%) after chemotherapy. Average parameter values for different response groups at three time-points are depicted in Table1. During NACT, ADC and D significantly (p<10-3) increased (~25-30%) in all response groups. D* significantly decreased (p=0.009) among PRs after t1 and t2; while among SD group D* significantly reduced only after t2 (p=0.001); while among PDs it was almost stable (p>0.26). f showed decreasing trend (~12-17% respectively) in PR and SD groups and were almost stable in PD group. Figure1, Figure 2 & Figure3 illustrate parametric maps of representative patients each from PR, SD and PD group respectively at different time-points. According to ANOVA test statistically significant histogram parameters at time-points t0, t1 and t2 are represented in Table2. At time-point t1, variance of D* (p=0.02) and skewness of f (p=0.03) and at time-point t2, variance and entropy of D* (p=0.003,0.001) and skewness and entropy of f (p=0.02,0.001) were significantly different among response groups. D*-variance ((2.94 vs 4.45 and 6.87)x10-4), D*-entropy (7.45 vs 8.87 and 9.23), f-skewness (0.78 vs 1.23 and 1.1) and f-entropy (7.89 vs 9.21 ans 9.33) were lower among PRs than the SD and PD response groups after completion of chemotherapy. At t1, using ROC analysis D*-variance and f-skewness jointly showed AUC = 0.79 in classifying PR group (sensitivity=74%; specificity=72%) among all patients and AUC = 0.75 in classifying SD group (sensitivity=77%; specificity=75%) from rest of the patients.Discussion
Estimated ADC and D were in agreement with each other and their values showed increasing trends and overlapping values among different response groups during course of NACT were indication of reduced cellularity in tumor as expected after NACT2-5. Decreased perfusion parameters (D*, f) were observed among PR and SD groups that could be indication of reduced angiogenesis and were almost stable in PD group. Histogram parameters variance, entropy of D* and f indicating heterogeneity in angiogenesis pattern in tumor were also lower among PRs than that of SD and PD groups.Conclusion
Quantitative IVIM parameters evaluated using BE+TV method and their histogram analysis revealed clinically useful information in characterizing chemotherapy response in Osteosarcoma and may be benificial to explore further.Acknowledgements
No acknowledgement found.References
- Geller DS, Gorlick R. Osteosarcoma : A review of diagnosis , management , and treatment strategies. Clin Adv Hematol Oncol. 2010;8(10):705-718.
- Raymond A, Chawla S, Carrasco C, et al. Osteosarcoma chemotherapy effect: a prognostic factor. Semin Diagn Pathol. 1987;4(3):212-236.
- Jaffe N. Osteosarcoma: Review of the Past, Impact on the Future. The American Experience. In: Jaffe N, Bruland OS, Bielack S, eds. Pediatric and Adolescent Osteosarcoma. Boston, MA: Springer US; 2010:239-262. doi:10.1007/978-1-4419-0284-9_12
- Coffin CM, Lowichik A, Zhou H. Treatment effects in pediatric soft tissue and bone tumors: practical considerations for the pathologist. Am J Clin Pathol. 2005;123:75-90. doi:10.1309/H0D4VD760NH6N1R6
- Janeway KA, Grier HE. Sequelae of osteosarcoma medical therapy : a review of rare acute toxicities and late eff ects. Lancet Oncol. 2010;11(7):670-678. doi:10.1016/S1470-2045(10)70062-0
- Eisenhauer EA, Therasse P, Bogaerts J, et al. New response evaluation criteria in solid tumours: revised RECIST guideline (version 1.1). Eur J Cancer. 2009;45(2):228-247. doi:10.1016/j.ejca.2008.10.026
- Le Bihan D, Breton E, Lallemand D, Aubin M-L, Vignaud J, Laval-Jeantet M. Separation of diffusion and perfusion in intravoxel incoherent motion MR imaging. Radiology. 1988;168(2):497-505. doi:10.1148/radiology.168.2.3393671
- Kayal EB, Kandasamy D, Khare K, et al. Quantitative Analysis of Intravoxel Incoherent Motion ( IVIM ) Diffusion MRI using Total Variation and Huber Penalty Function. Med Phys. 2017;44(11):5489-5858. doi:10.1002/mp.12520
Figures
.
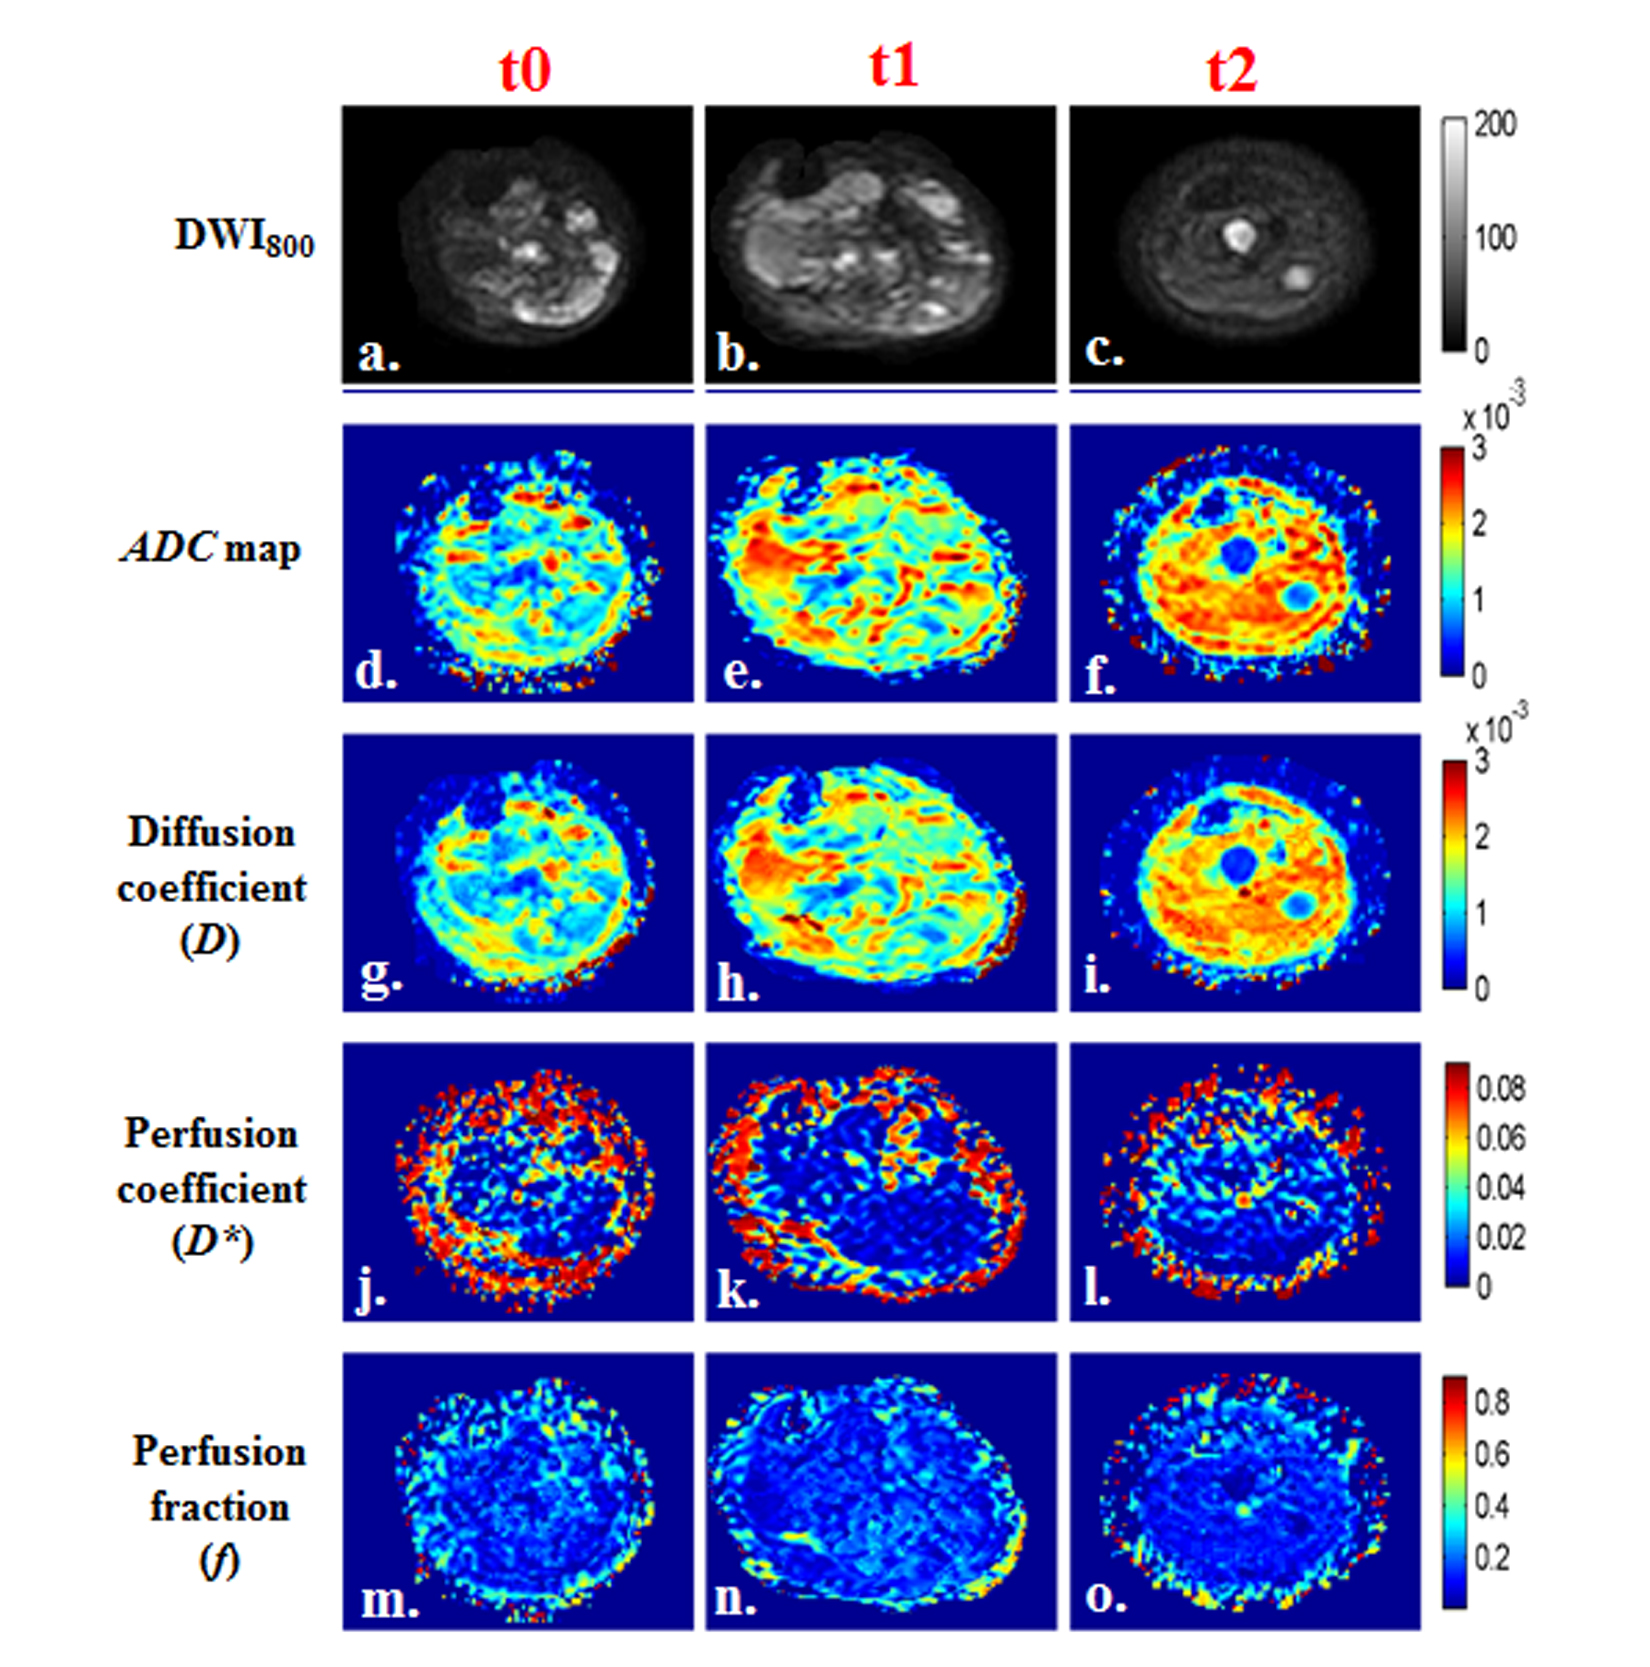
Figure
1: a-r) Images of a representative patient from PR
group (M,17 years) with OS in left femur and tumor-diameter was 10.4cm, 12.3cm
and 5cm at time points t0, t1 (Δ1:18.27% increment)
and t2 (Δ2:51.92% decrement)
respectively. a,b,c) DWI (b=800sec/mm2); d,e,f) Apparent diffusion
coefficient(ADC); g,h,i) Diffusion
coefficient (D); j,k,l) Perfusion
coefficient (D*); m,n,o) Perfusion
fraction (f) at time points t0, t1
and t2 respectively. Both ADC & D
in tumor demonstrated an increase; D* showed
a decrease; f did not show much
difference in tumor ROI after chemotherapy.
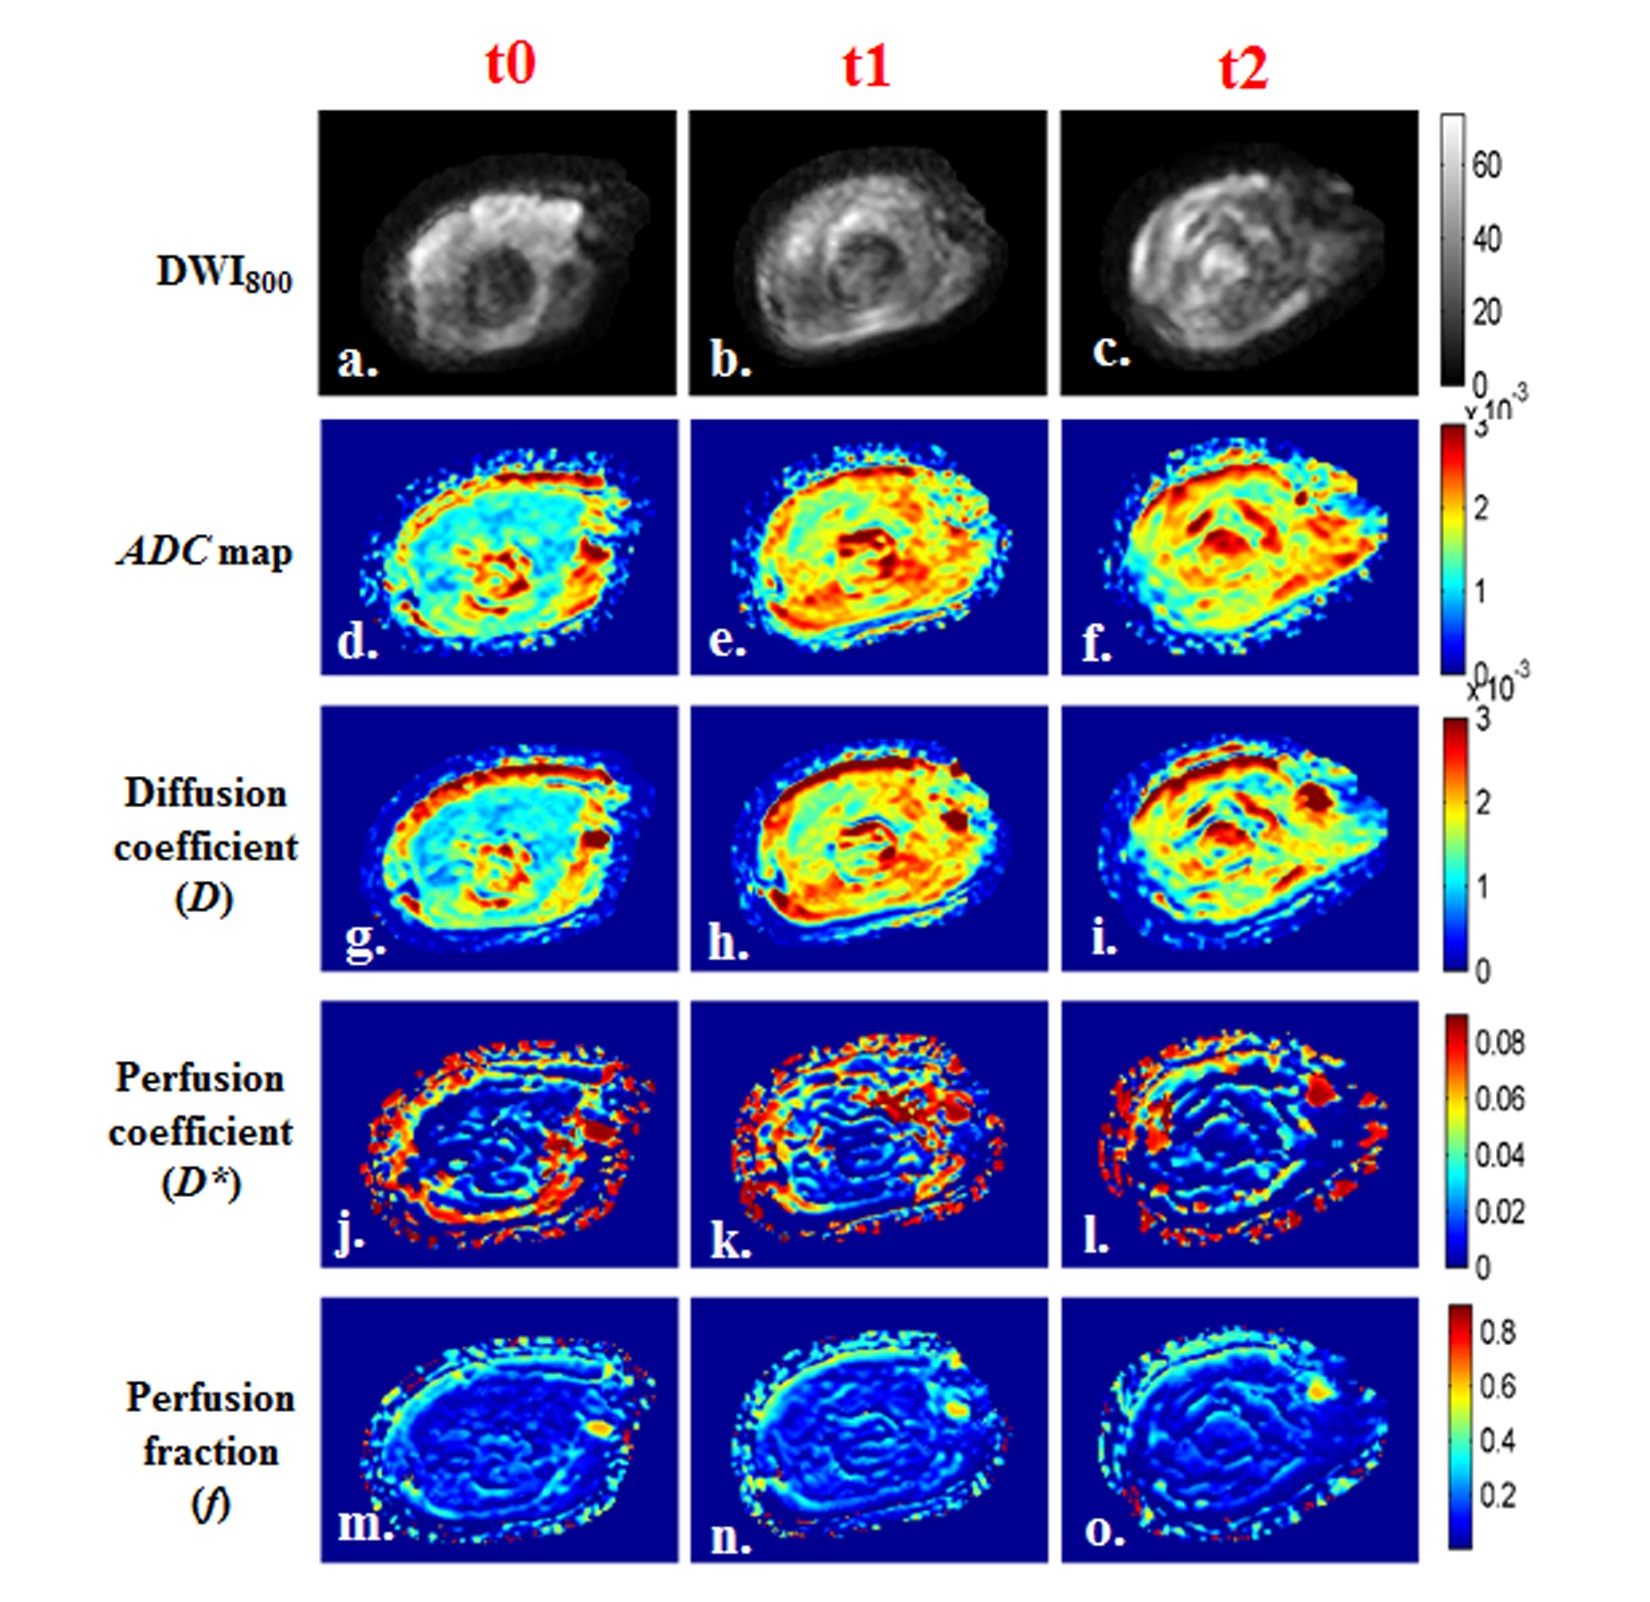
Figure
2: a-r) Images of a representative patient from SD
group (M, 14yrs) with OS in right femur. Tumor-diameter was 10.6cm, 8.8cm
and 7.8cm at time points t0, t1 (Δ1:16.98% decrement)
and t2 (Δ2:26.42% decrement)
respectively. a,b,c) DWI (b=800sec/mm2); d,e,f) ADC; g,h,i) Diffusion
coefficient (D); j,k,l) Perfusion
coefficient (D*); m,n,o) Perfusion
fraction (f) at time points t0, t1
and t2 respectively. Both ADC&D
in tumor demonstrated an increase; whereas D*
showed an increment at t1, followed by a decrease at t2; f did not show significant difference in tumor after chemotherapy.
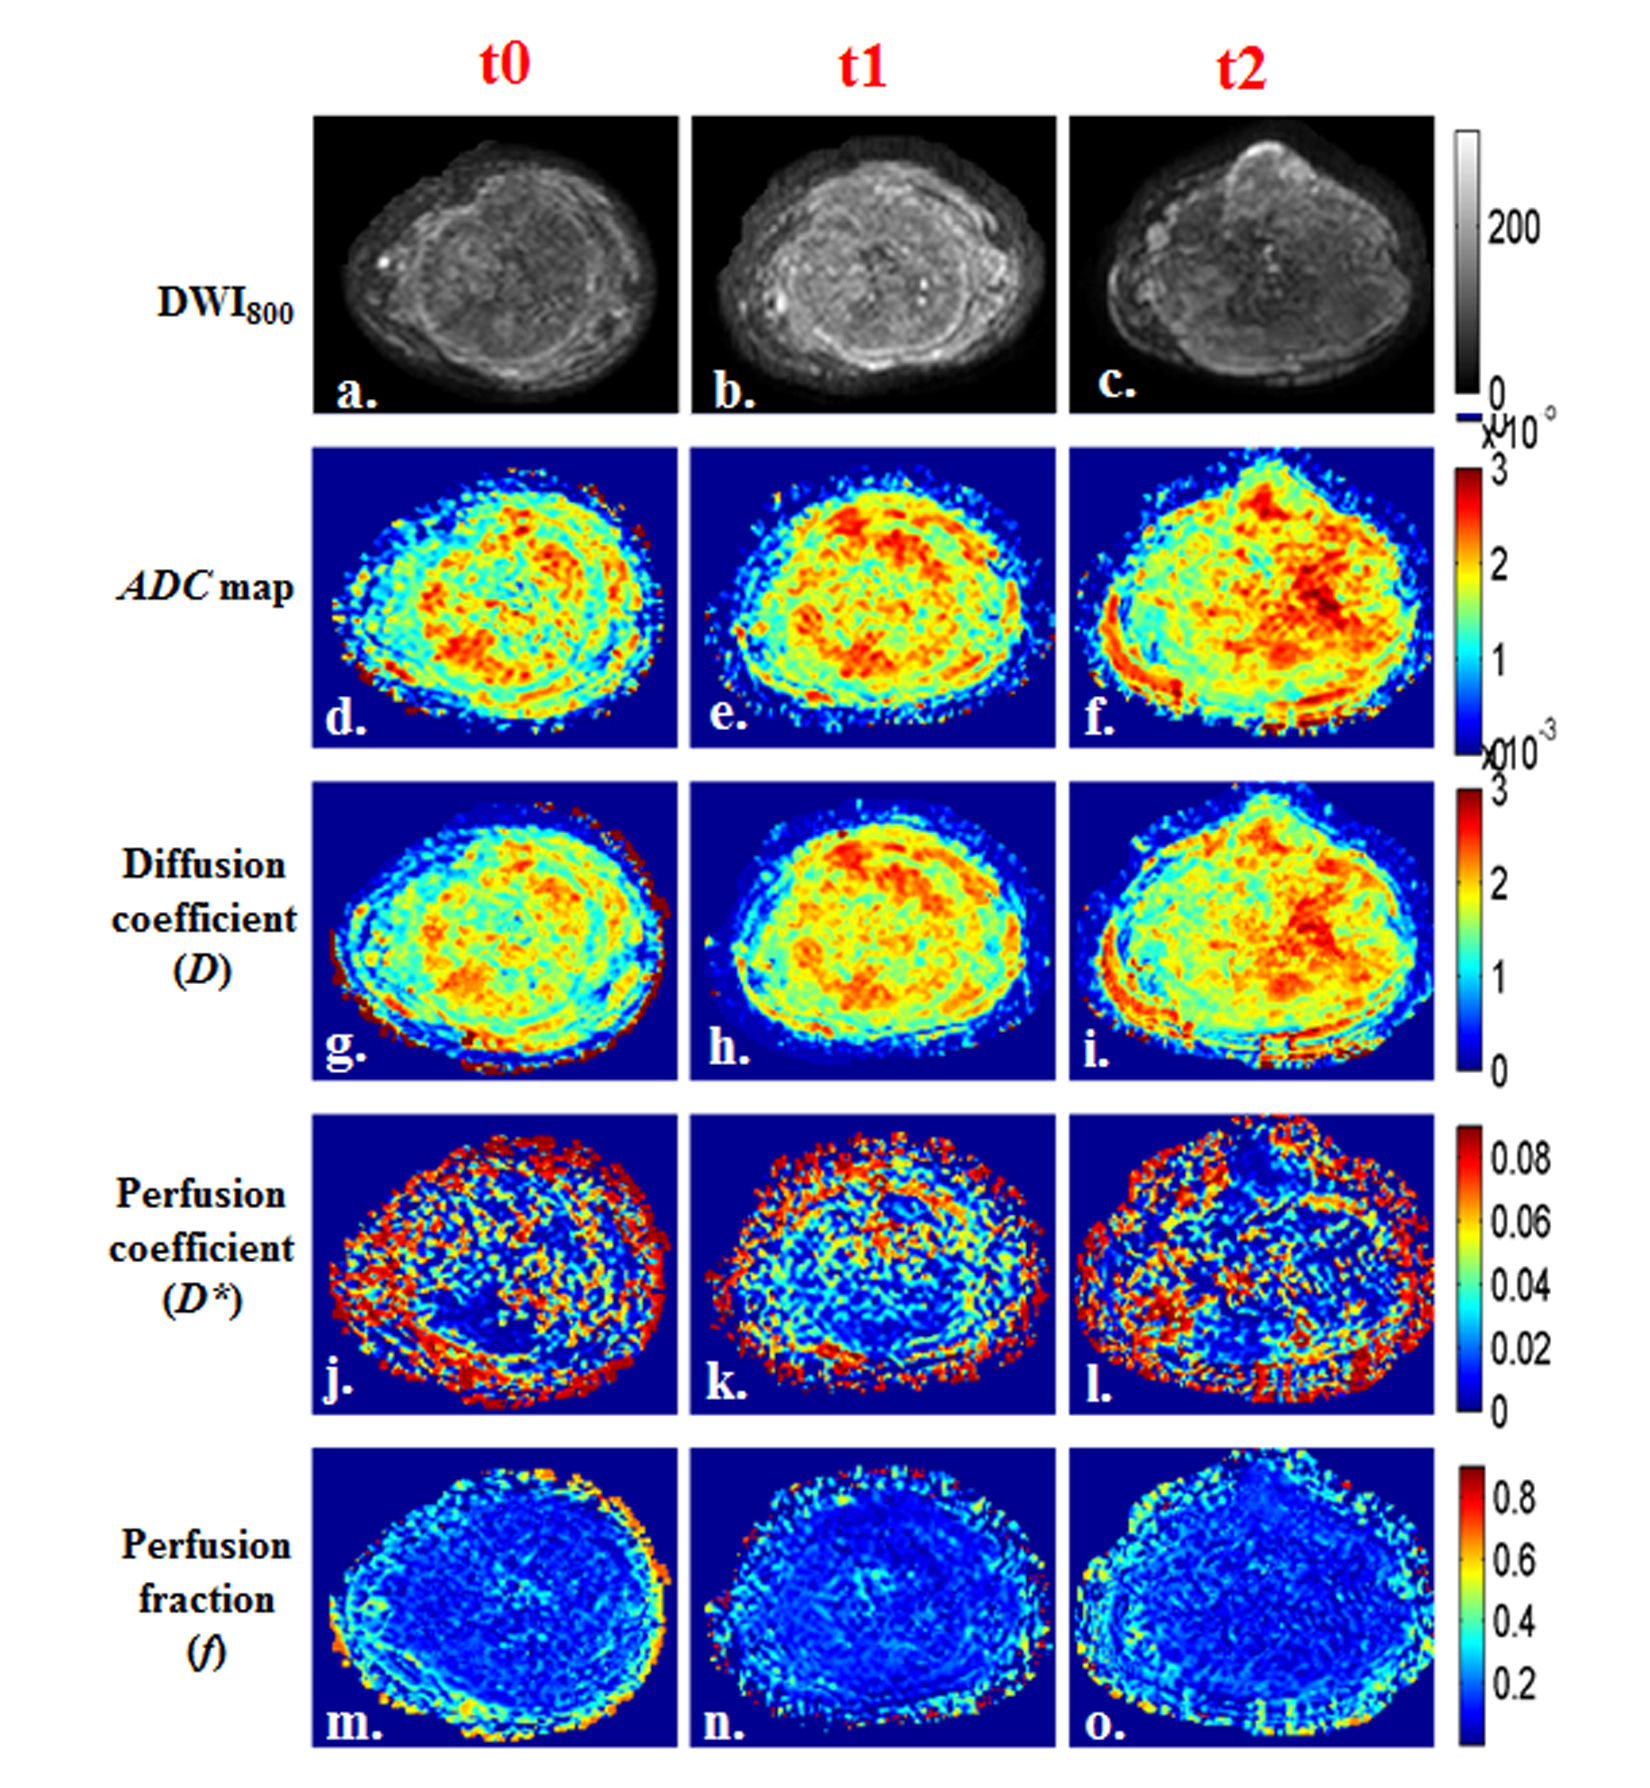
Figure
3: a-r) Images of a representative patient from PD
group (M, 18 years) with OS in right femur. Tumor-diameter was 11.8cm, 11cm
and 13.6cm at time points t0, t1 (Δ1:6.78% decrement)
and t2 (Δ2:15.25% increment)
respectively. a,b,c) DWI (b=800sec/mm2); d,e,f) Apparent diffusion coefficient (ADC); g,h,i) Diffusion
coefficient (D); j,k,l) Perfusion
coefficient (D*); m,n,o) Perfusion
fraction (f) at time points t0, t1
and t2 respectively. Both ADC&D
in tumor showed an increase; whereas D*
demonstrated increase; f did not show significant difference in tumor after chemotherapy.
.