4733
Oxygen-Enhanced MOLLI T1 Mapping during Chemoradiotherapy in Anal Squamous Cell Carcinoma1Institute of Biomedical Engineering, University of Oxford, Oxford, United Kingdom, 2Department of Oncology, Oxford University Hospitals Trust, Oxford, United Kingdom, 3Radiotherapy Department, Oxford University Hospitals NHS Foundation Trust, Oxford, United Kingdom, 4Department of Oncology, CRUK/MRC Oxford Institute for Radiation Oncology, Oxford, United Kingdom, 5Cancer Imaging, School of Biomedical Engineering & Imaging Sciences, King's College London, London, United Kingdom, 6Centre for Statistics in Medicine, NDORMS, University of Oxford, Oxford, United Kingdom
Synopsis
Early identification of patients in need of radiotherapy treatment intensification would allow tailored radiotherapy dose. We hypothesize that patients with poor vascularity or hypoxia will correlate with these patients, and T1 changes from oxygen-enhanced MRI could provide indications of tumour perfusion. We acquired T1-maps before and after 8-10 fractions of radiotherapy and examined whether the oxygen-enhanced MRI response relates to clinical outcome. There was a significant increase in tumour T1 across patients following chemoradiotherapy (p<0.001). Before chemoradiotherapy, OE-MRI showed no significant changes in tumour T1, however after receiving chemoradiotherapy, OE-MRI showed a significant decrease in tumour T1 (p<0.001).
Introduction
Anal squamous cell carcinoma has a local relapse rate of approximately 50% when node positive[1-3]. Early identification of the group of patients in need of radiotherapy treatment intensification would allow clinicians to tailor radiotherapy dose and prevent relapse. We hypothesize that patients with poor vascularity or hypoxia will correlate with those likely to be at risk of relapse, and T1 changes from oxygen-enhanced MRI could provide indications of tumour perfusion.The T1 of arterial blood is known to be altered by breathing increased inspired fraction of oxygen. By acquiring a T1-map both under normal conditions and while the patient is breathing an increased inspired fraction of oxygen, the changes in T1 could differentiate tumours with poor vascularity or hypoxia. We aim to quantify the changes in mean T1 between a T1-map acquired at diagnosis and again on fraction 8-10 of chemoradiotherapy and examine whether this oxygen-enhanced MRI response relates to clinical outcome.
Methods
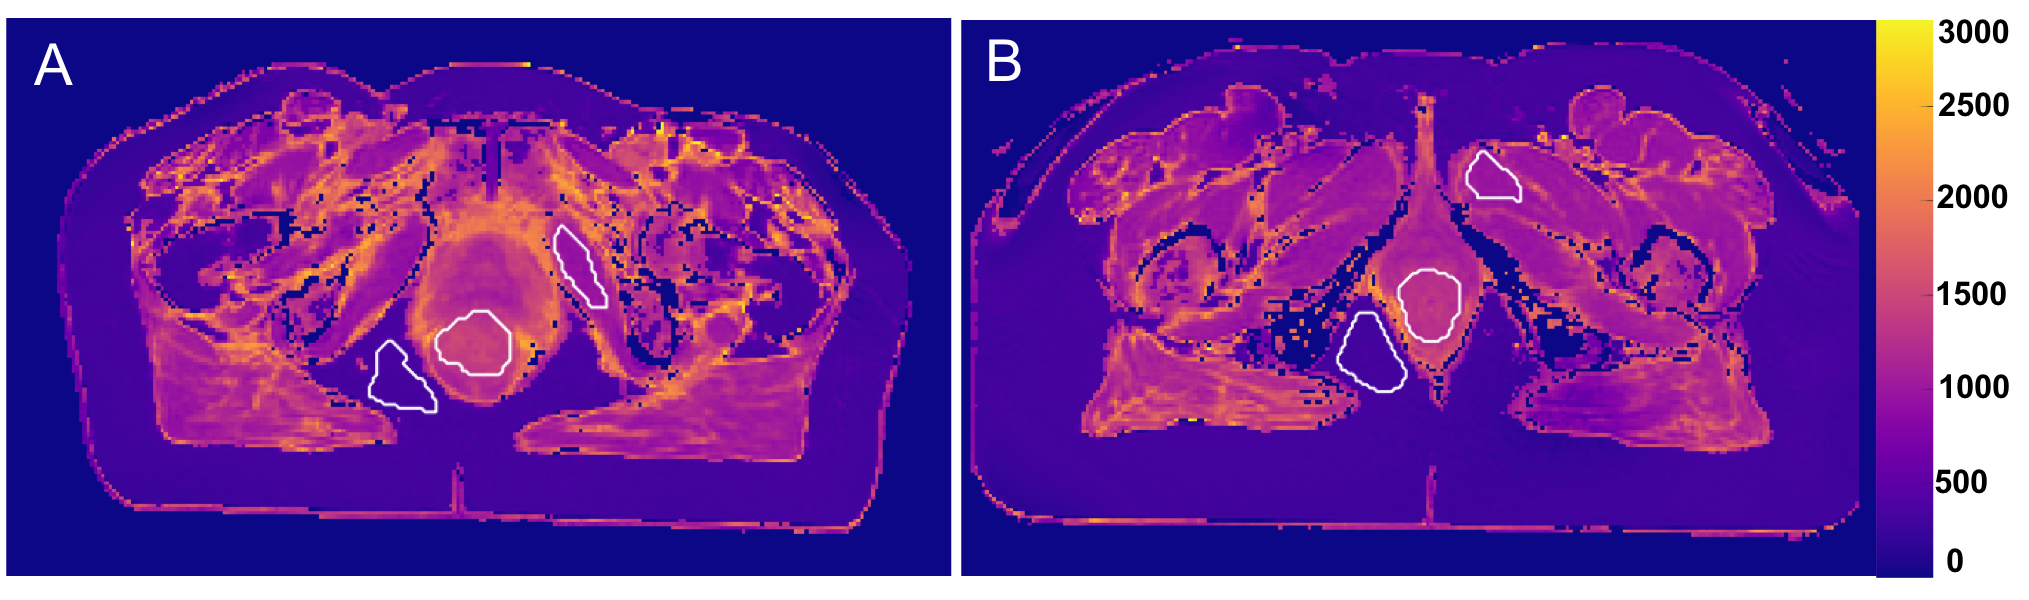
This study recruited patients undergoing radical chemoradiotherapy for anal cancer in Oxford University Hospitals NHS Trust between 2014-2017. Patients were scanned on a GE Discovery MR750 3T MR scanner (GE Healthcare, USA) with a flat-topped couch to reproduce the radiotherapy treatment position. Following acquisition of a T2-weighted image (FRFSE sequence), the MOLLI[4] T1-mapping sequences (FIESTA) were acquired while the patient was breathing air and then again breathing 100% oxygen. This imaging procedure was performed prior to treatment (‘visit 1’), and after fraction 8-10 of radical chemoradiotherapy (‘visit 2’). Chemoradiotherapy was delivered according to UK-based guidance[5]. A dose of 41.4-61.6Gy to the primary tumour was delivered in 28 fractions using a simultaneous integrated boost using intensity modulated radiotherapy (IMRT) or volumetric modulated arc therapy (VMAT). Chemotherapy was Mitomycin 12mg/m2 Day 1 and Capecitabine 825mg/m2 orally twice a day on radiotherapy treatment days. Clinical response was assessed at 3 months after completion of CRT. A tumour region of interest (ROI) was delineated by an experienced oncologist for all primary tumours on high-resolution T2-weighted images and nonlinearly registered to the T1-map. Patient response to treatment was assessed 3 months following completion of chemoradiotherapy. For use as control ROIs, regions of fat and muscle tissue were also delineated (Figure 1).Results, Discussion & Conclusion
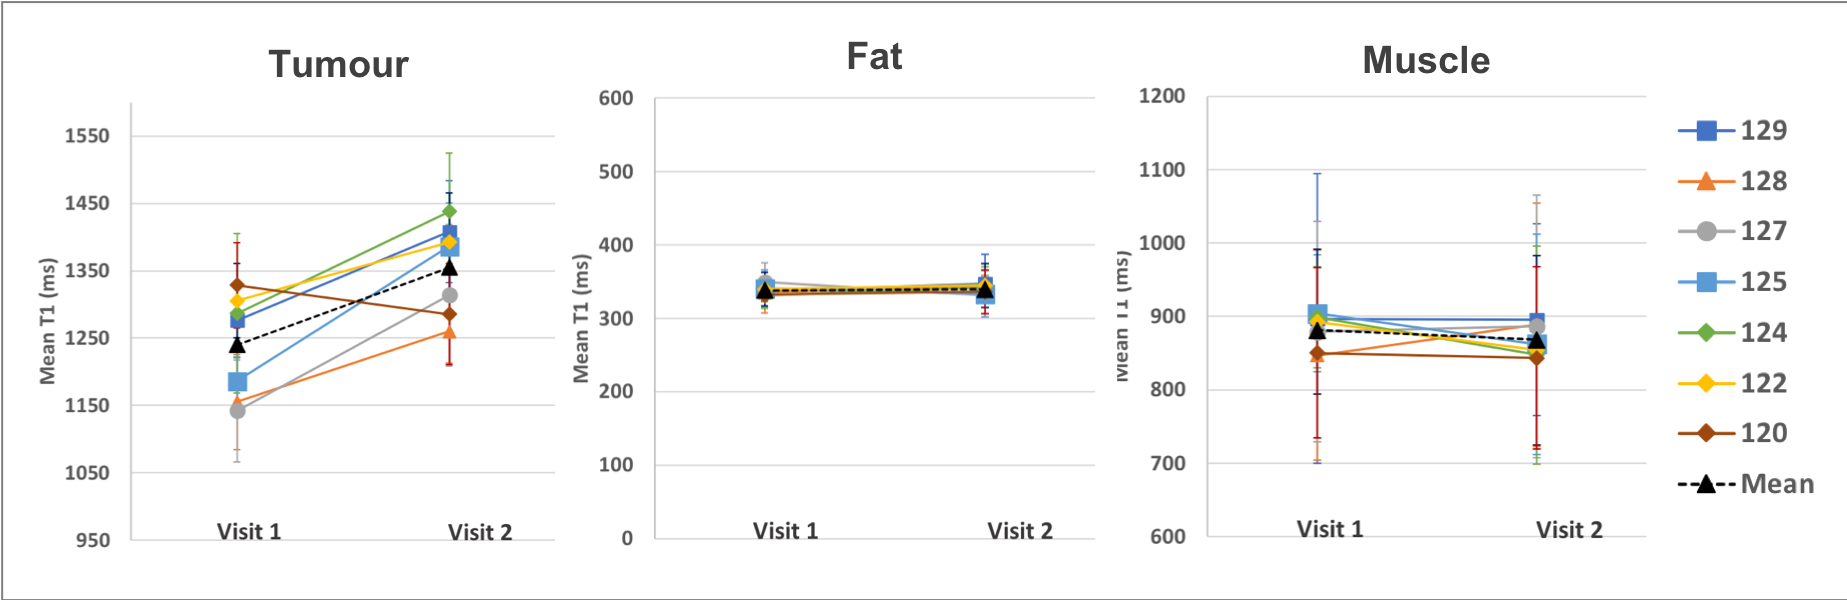
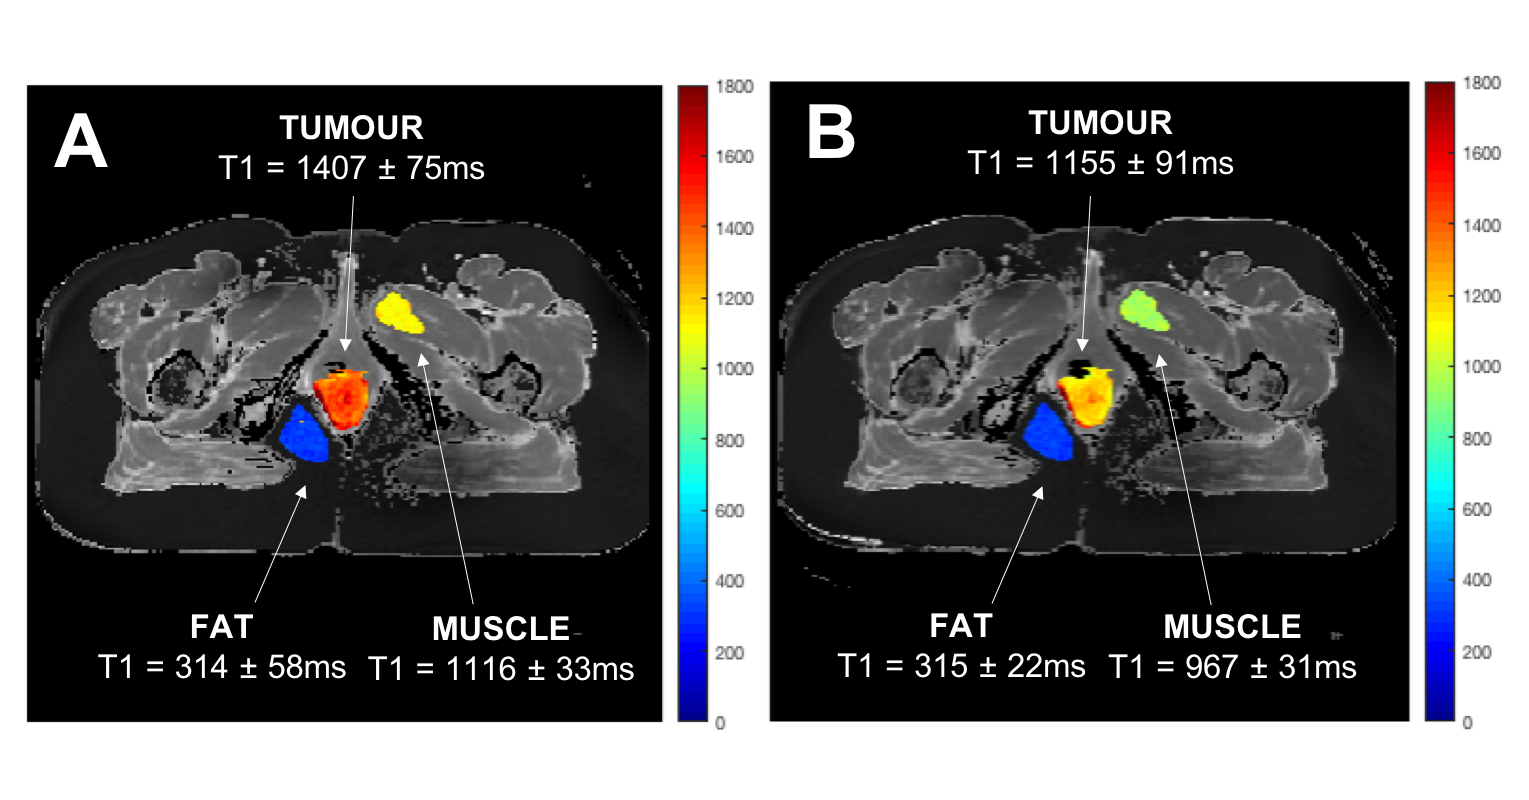
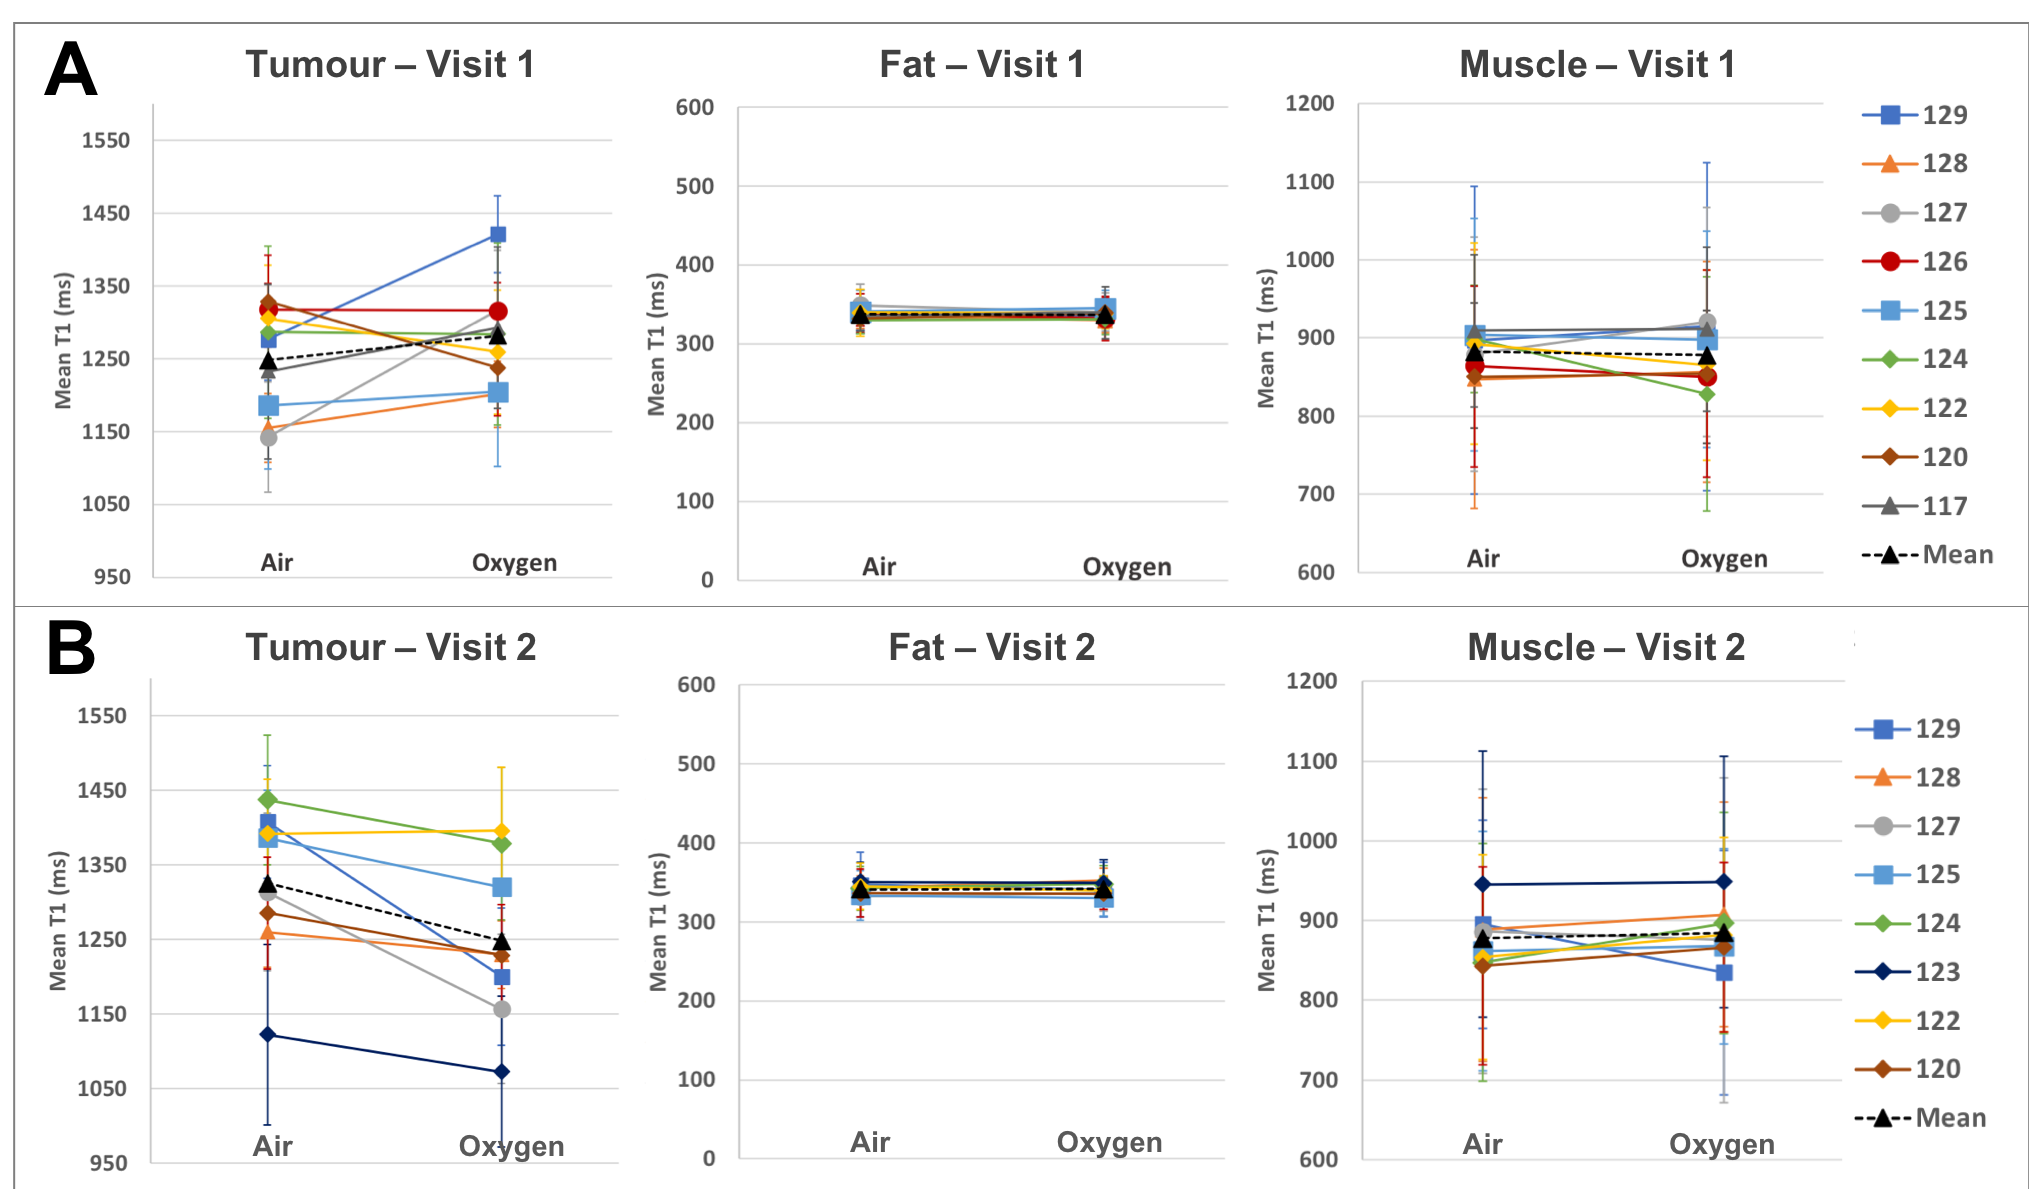
The change in the mean T1 in the tumour, fat and muscle ROIs were compared across the two visits (n=7 patients)(Figure 2). There was a significant increase in T1 of the tumour ROIs across patients following the 8-10 fractions of chemoradiotherapy (paired t-test, p<0.001). This change in T1 on air between visits is not unexpected, since the tumours were treated aggressively between visits which would cause changes in the cellular and biochemical environment. It is possible that the tumour remaining in visit 2 is the more aggressive section, and perhaps always had a different T1, however we hypothesize that this is not the case, since no bimodal distributions or multiple populations were seen in histograms when analyzing all ROIs.The mean T1 in all ROIs taken while the patient was breathing air versus 100% oxygen were compared, in each visit separately (patient example shown in Figure 3, all patients summarized in Figure 4). In visit 1, prior to receiving chemoradiotherapy, there were no significant changes in T1 across patients from breathing oxygen (n=9 patients). In visit 2, after receiving chemoradiotherapy, there was a significant decrease in T1 of the tumour ROIs across patients when breathing 100% oxygen (paired t-test, p<0.001, n=8 patients). This change in oxygen response following response to chemoradiotherapy could be indicative of a change in perfusion in the tumour.
In all cases, there were no significant changes in T1 in the fat and muscle control ROIs.
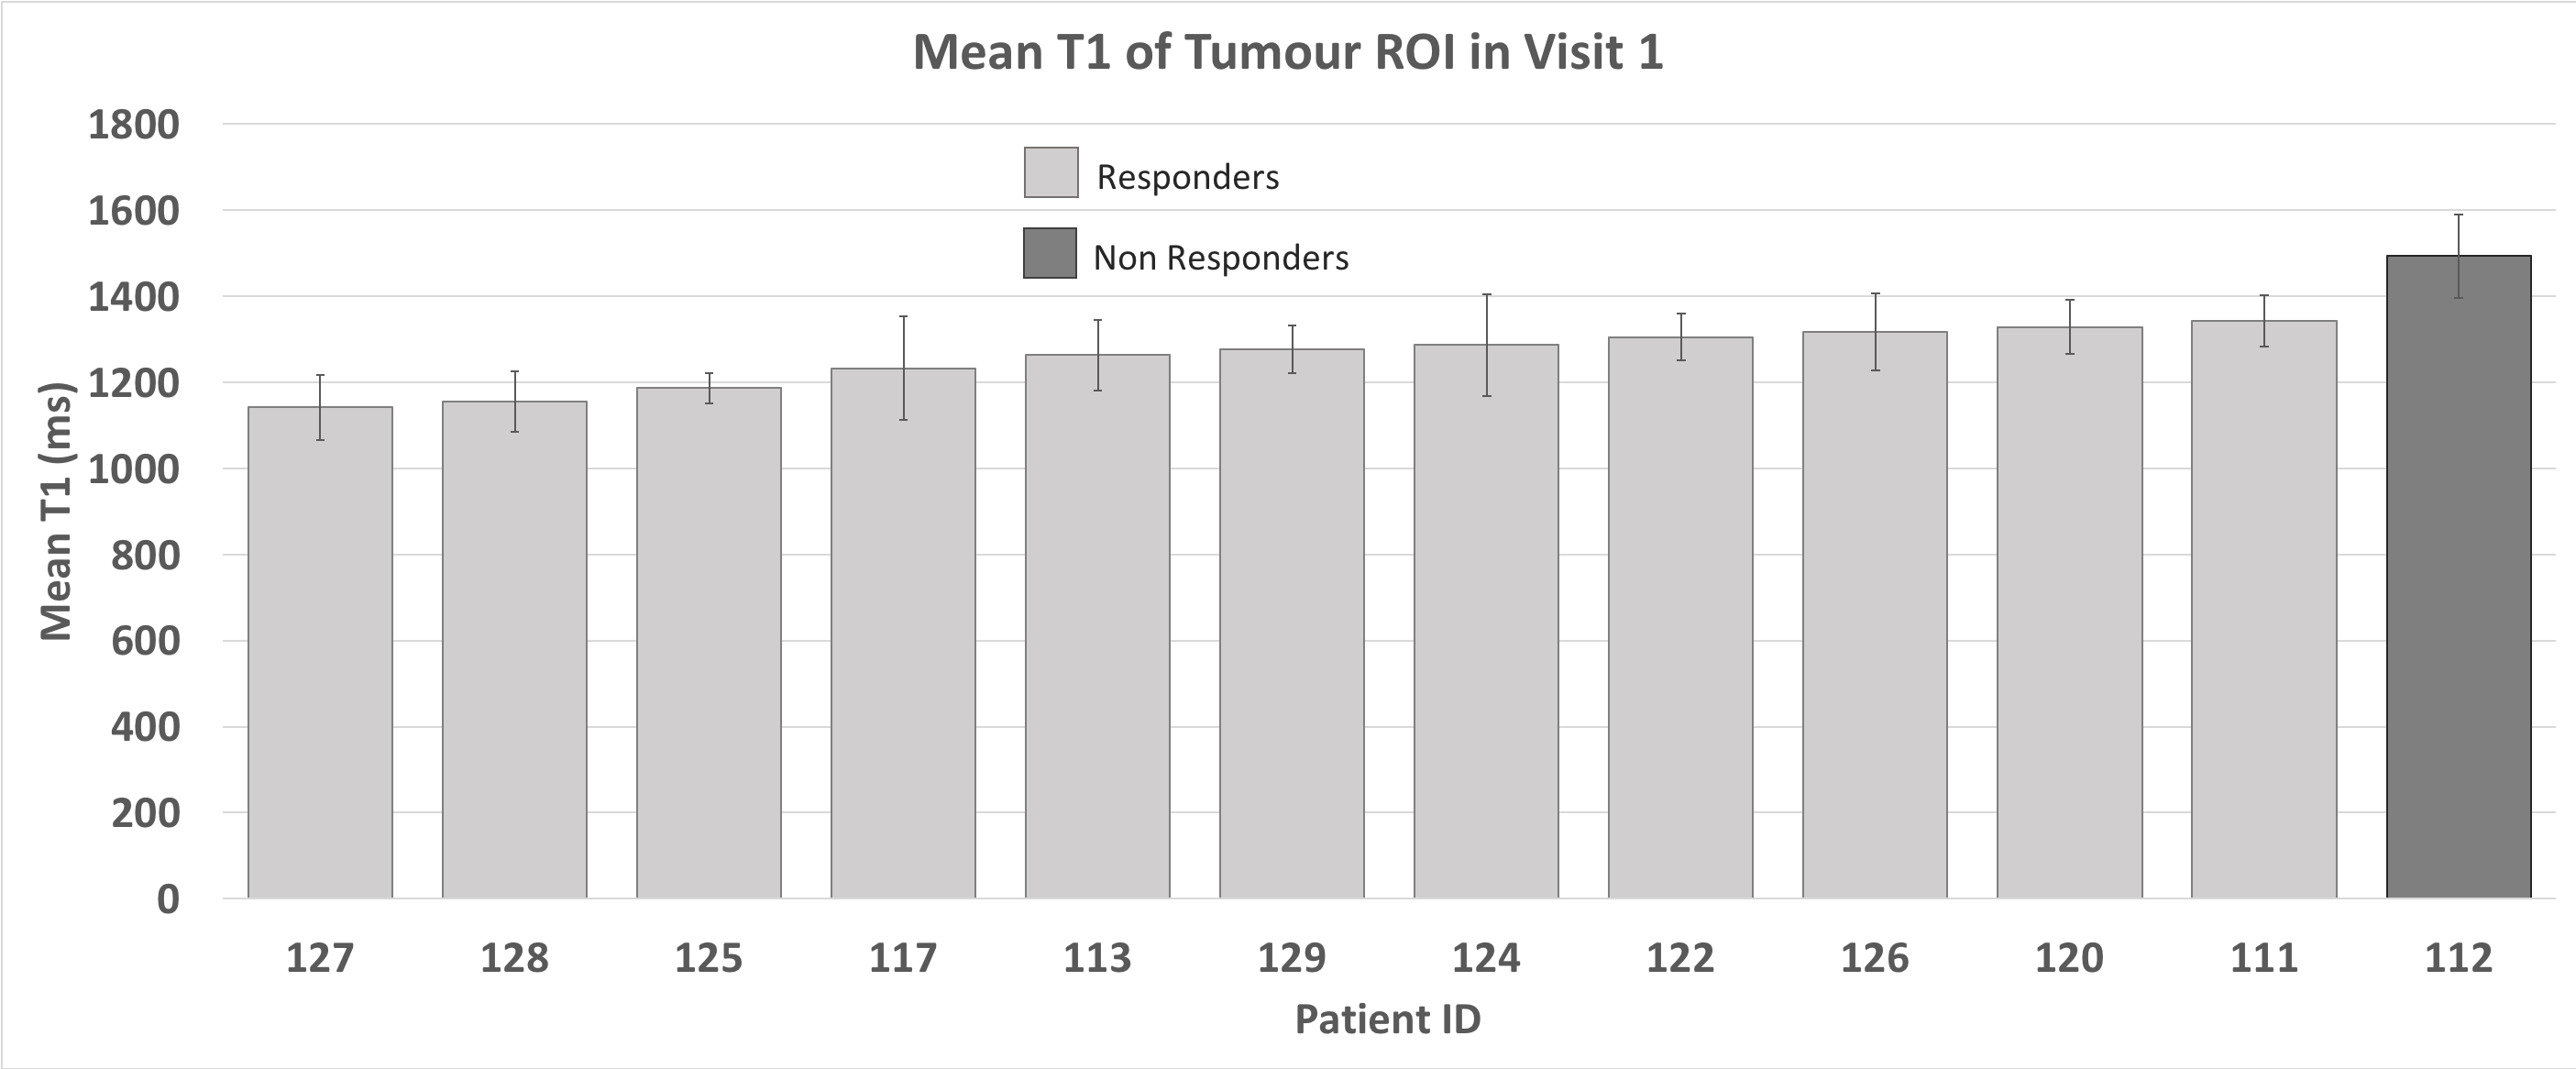
Out of the 12 patients from which we successfully acquired a visit 1 T1-map, only 1 patient did not respond to treatment. This means, unfortunately, that we cannot correlate these results with clinical outcome. The mean tumour T1 measurements at diagnosis are shown in Figure 5. It can be noted that the 1 non-responding tumour had a higher mean T1 (1493ms) than all of the responding tumours (group mean=1257 ± 70ms, max=1342ms, min=1142ms). It is interesting that the non responder appeared to have a higher T1, since an increase in T1 seemed to occur in all non-responders from the treatment itself. However, no conclusions can be drawn from only one patient sample.
Conclusion
This clinical data demonstrates feasibility and potential for T1-mapping and oxygen-enhanced T1-mapping to indicate perfusion or treatment response in tumours of this nature. Future work with larger cohorts containing more non-responders would allow us to relate these measurements to clinical outcome.Acknowledgements
The authors would like to thank the OUH NHS Foundation Trust Radiology department, particularly Dr Andrew Slater and the patients who took part in the ART study. The Oxford C REC ethically approved the trial. The trial was sponsored by the University of Oxford, funded by the CRUK & EPSRC Cancer Imaging Centre Oxford and managed by the Oncology Clinical Trials Office. Independent oversight was provided by the Radiotherapy and Imaging Oversight Committee. M Hawkins is supported by Medical Research Council grant MC_UU_00001/2. This work was supported by funding from the Engineering and Physical Sciences Research Council (EPSRC) and Medical Research Council (MRC) [grant number EP/L016052/1], the Clarendon Scholarship fund and the Joe Todd Engineering Award from St Edmund Hall.References
1.Das P, Bhatia S, Eng C, et al, Predictors and patterns of recurrence after definitive chemoradiation for anal cancer. Int J Radiat Oncol Biol Phys, 2007;68(3):794-800.
2.Wright JL, Patil SM, Temple LK, et al, Squamous cell carcinoma of the anal canal: patterns and predictors of failure and implications for intensity-modulated radiation treatment planning. Int J Radiat Oncol Biol Phys, 2010;78(4):1064-72.
3.Tomaszewski JM, Link E, Leong T, et al, Twenty-five-year experience with radical chemoradiation for anal cancer. Int J Radiat Oncol Biol Phys, 2012;83(2):552-8.
4.Messroghli DR, Radjenovic A, Kozerke S, et al, Modified Look-Locker inversion recovery (MOLLI) for high-resolution T1 mapping of the heart. Magn Reson Med 2004;52(1):141–146.
5.Muirhead R, Adams RA, Gilbert DC, Glynne-Jones R, Harrison M, Sebag-Montefiore D, et al. Anal cancer: developing an intensity-modulated radiotherapy solution for ACT2 fractionation. Clinical oncology. 2014;26:720-1
Figures