4731
Fractional Calculus Tracer Kinetic Model for Tissue Blood Perfusion Quantification1University Hospital Essen, Essen, Germany
Synopsis
We present a one-compartment model with fractional elimination and time-dependent tracer input to estimate perfusion and its heterogeneity with intravascular contrast agent and DCE-MRI. Fractional order elimination leads to residue functions of a simple decreasing Mittag-Leffler type. The technique was validated with animal experiments and also tested clinically in a patient with lower limb sarcoma. Our results suggest that using intravascular contrast agent in combination with a fractional 1-compartment tracer kinetic model allows for the absolute perfusion quantification of low perfused organs like muscles by considering kinetic heterogeneity.
Introduction
Abnormal vasculature and heterogeneous microcirculation are hallmarks of solid tumors [1,2]. Contributions from research areas such as bioengineering and pharmacokinetic/pharmacodynamic modeling suggest that physical properties of complex and heterogeneous processes in biological tissue might be described using differential equations of fractional order [3,4,5]. Recent studies suggest a strong connection between the process of viscous fluid seeping through a fractally structured porous medium and fractional order kinetics [6]. We present a one-compartment model with fractional elimination and time-dependent tracer input to estimate perfusion and its heterogeneity. Fractional order elimination leads to residue functions of a simple decreasing Mittag-Leffler type [7].Methods
Total skeletal muscle blood flow in the hind leg was investigated via intravascular contrast agent (CA) administration in female pigs. An ultrasound Doppler probe was attached to the right femoral artery to determine total flow in hind leg musculature. See [8] for surgical details and [9] for the MRI protocol. Perfusion of the different anatomic regions was calculated using a one-compartment model (1C) and a fractional one-compartment model (f1C) [4,5]. The Akaike information criterion (AIC) was used for model selection. The solution of the fractional rate equation$$\frac{\mathrm{d}c_p(t)}{\mathrm{d}t} = \frac{F_p}{v_p} \cdot c_a(t)-\frac{1}{T_{pf}} {^C_0}{D}{_t^{1-\alpha}} c_p(t).$$
uses the simple decreasing Mittag-Leffler function instead of the exponential function as a residue function:
$$C(t) = v_p \cdot c_p(t) = F_p \cdot E_{\alpha}(-t^\alpha/T_{pf}) \ast c_a(t).$$
The Caputo fractional differential operator is defined as
$$ {^C_a}{D}{_t^{\alpha}} f(t) = \frac{1}{\varGamma(n-\alpha)}\int_{a}^{\infty}\frac{f^{(n)}(\tau)}{(t-\tau)^{\alpha+1-n}}\mathrm{d}\tau, \, n-1 < \alpha < n \in \mathbb{N},$$
and the Mittag-Leffler function as
$$E_{\alpha}(-t^\alpha/T_{pf}) = \sum_{k=0}^{\infty}\frac{(-(t/T_{pf}^{\frac{1}{\alpha}})^\alpha)^k}{\varGamma(\alpha k +1)}. \label{Eq_Ea}$$
The fractional differential equation introduces a convolution of the plasma CA concentration with a memory kernel with inverse power law form. This heridity property (non-locality in time) is intrinsic contained in the definition of the fractional derivative.
Furthermore, the method was tested clinically in a patient with lower limb sarcom.
Results
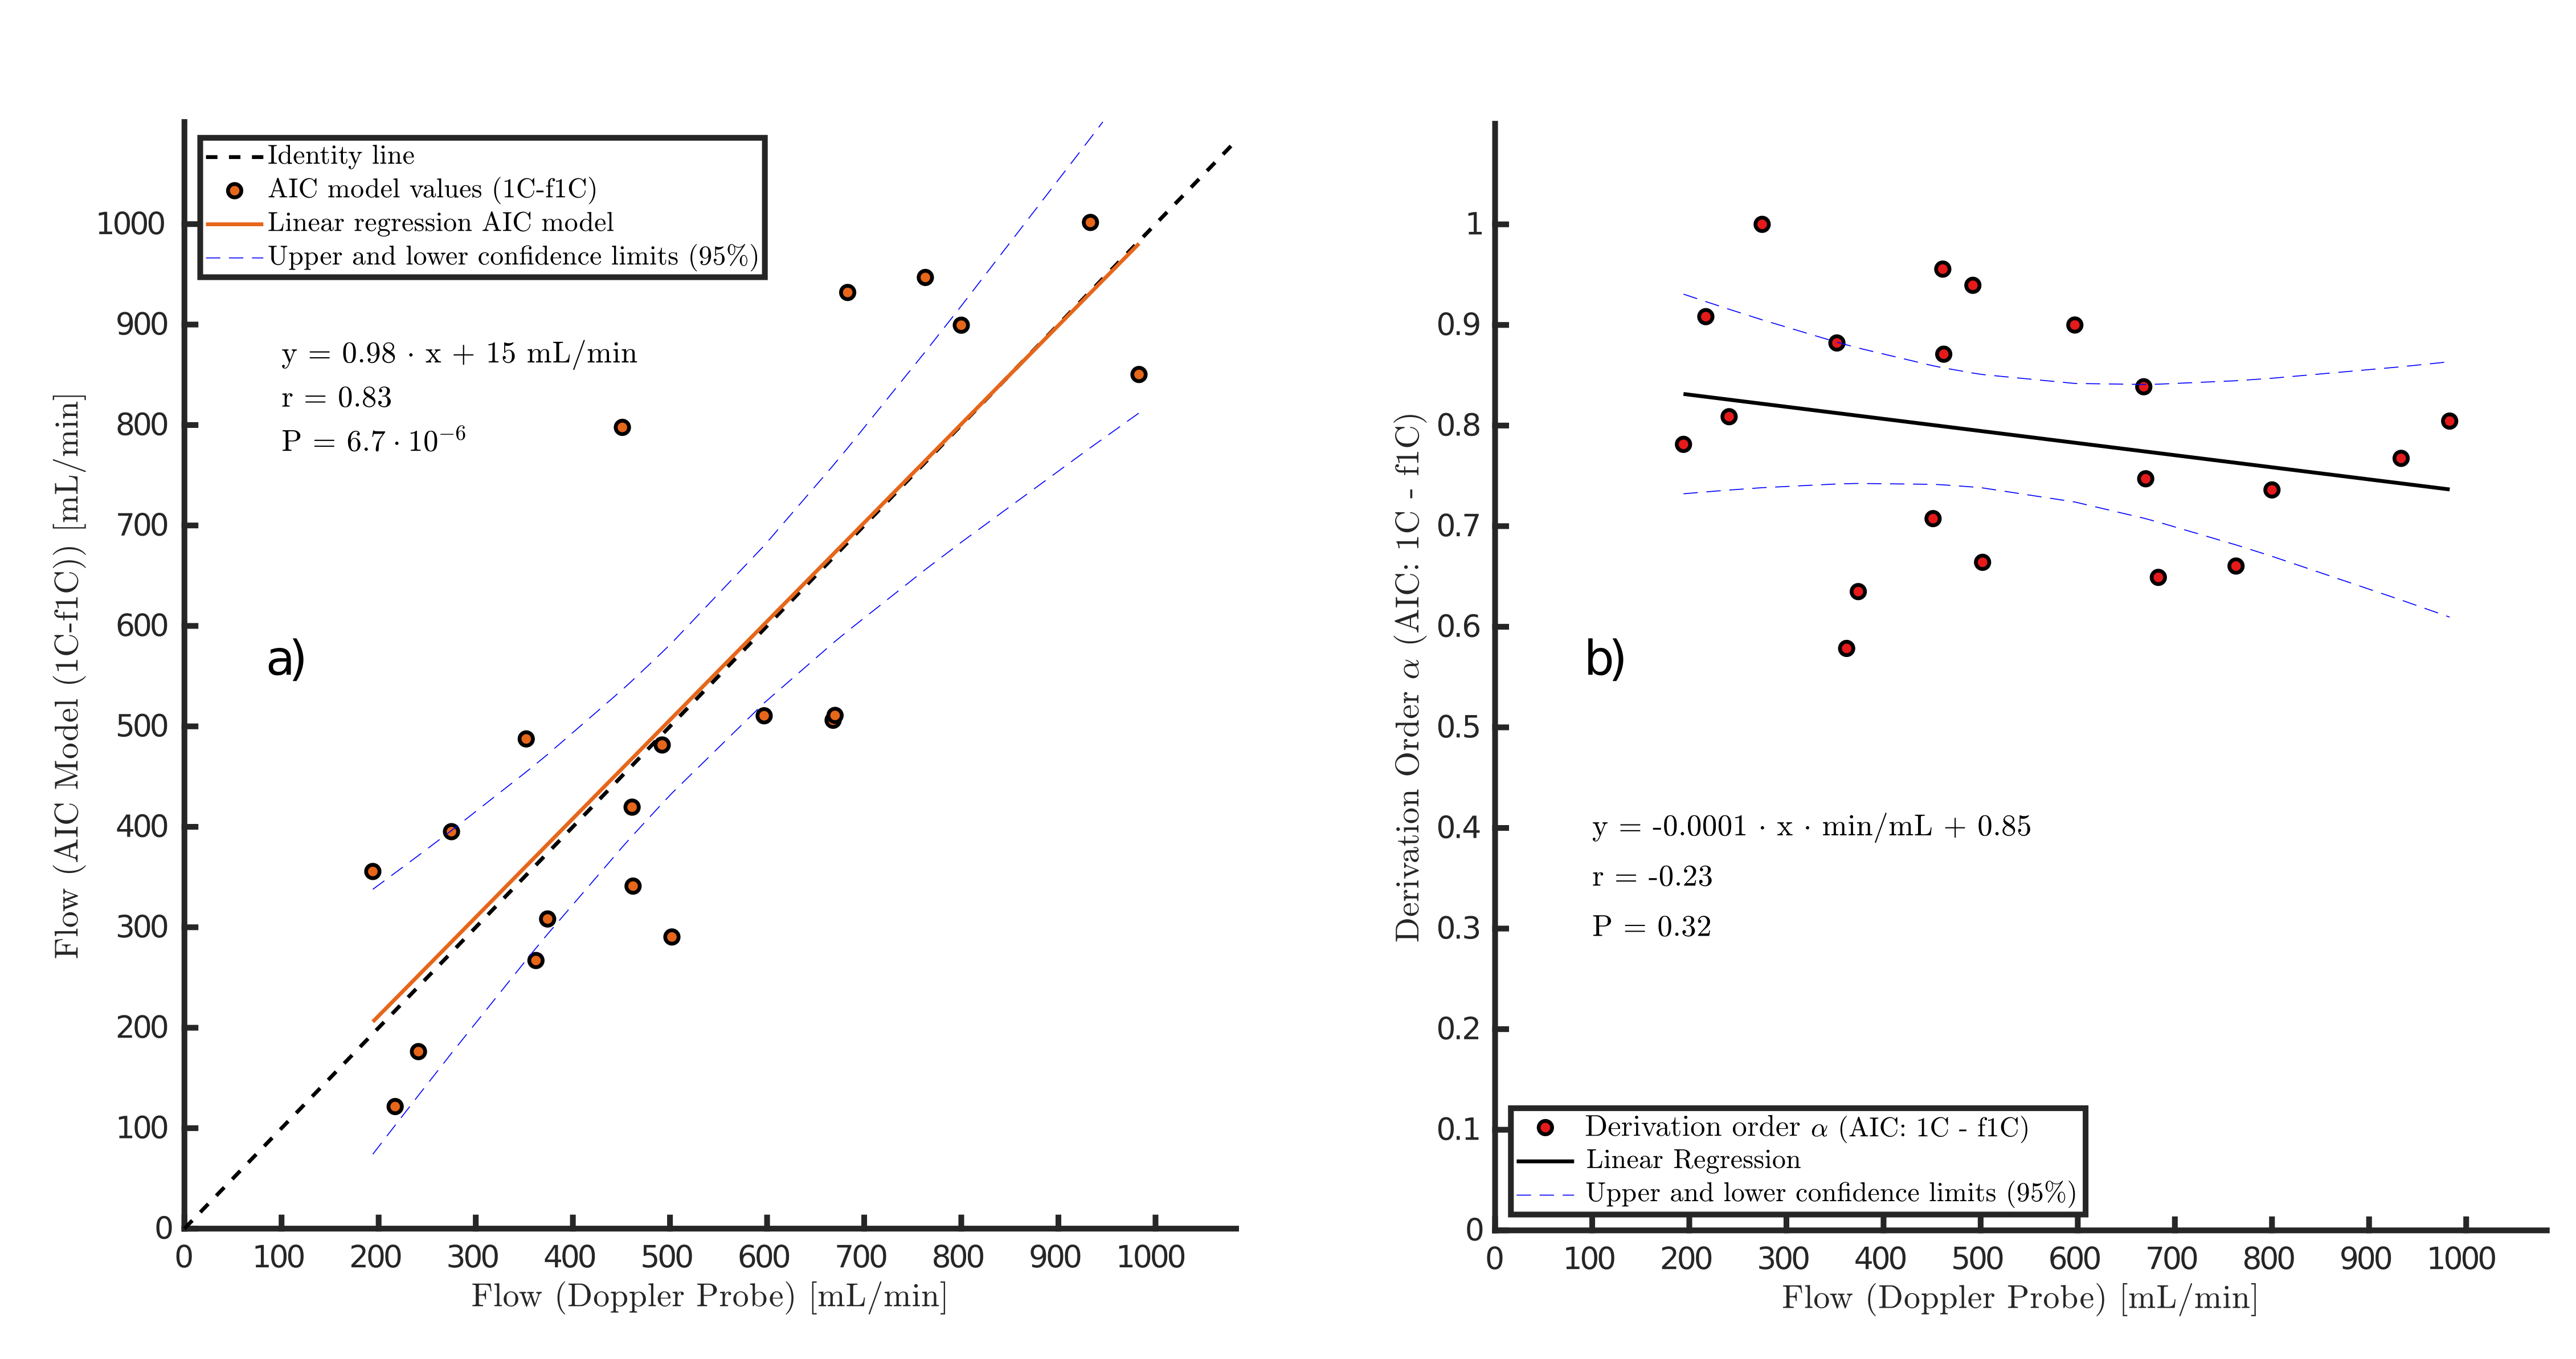
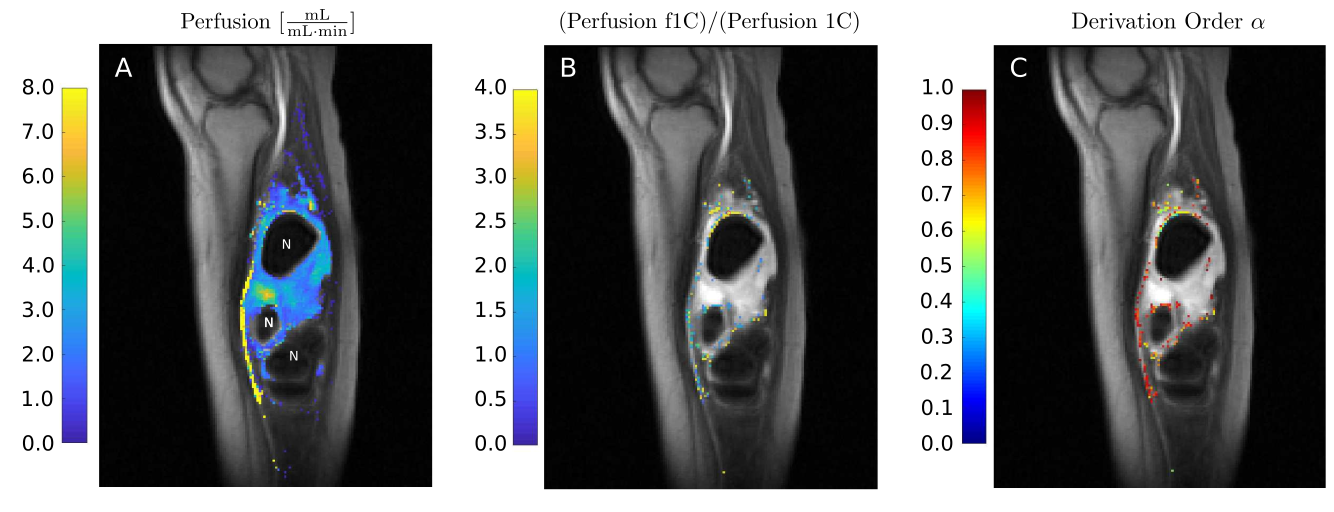
The correlation coefficient is r=0.83 (P<10-5), and the regression line is in good agreement with the line of identity (Fig. 1a). In Fig. 1b the mean of the derivative order of the best model fit results obtained for all seven tissue segments in one experimentis plotted against the measurements obtained with the Doppler flow probe. An average decrease in derivation order with increasing blood flow is observed.Fig. 2 and Fig. 3 present the results obtained in a patient with sarcoma. The perfusion estimates of the 1C and f1C model in Fig. 2A are selected by the AIC. Individual voxel estimates showed high global heterogeneity throughout the tissue between the three necrotic areas, ranging from Fp ≈ 0.1 mL/(min·mL) to Fp ≈ 8.0 mL/(min·mL). Voxel-to-voxel heterogeneity of the perfusion estimates was especially high in the proximal edges of the necrotic areas. Intravoxel results presented in Fig. 2B compare estimates of f1C perfusion with perfusion estimates of the 1C model. Color indicates voxels in which the f1C-fit to DCE-MRI data was found to be significantly better than the1C-fit by the AIC.
Compared to f1C estimates, perfusion estimates of the 1C model were up to four times lower in the proximal edges of the necrotic areas. Derivation order α for the voxels in which the f1C model showed the statistically more significant model fits are presented in Fig. 2C. In partial volume voxels including large vessels, α was close to 1 in most cases. However, in the proximal edges of necrotic areas α was found to range between 0.5 and 0.8.
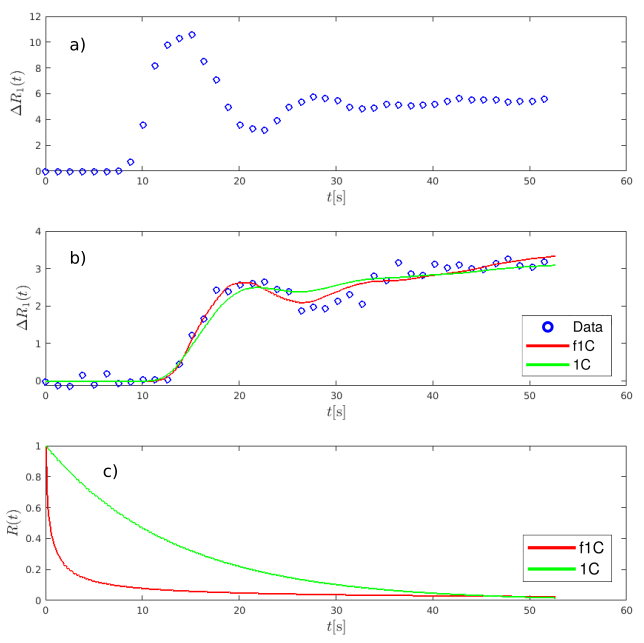
Fig. 3 presents examples of a) the arterial input function, extracted from the posterior tibial artery, b) 1C and f1C model fits to DCE-MRI data, and c) the corresponding residual functions. The data points in Fig. 3b have been extracted from the necrotic area edge voxel marked by the red circle in Fig. 2B. The fit of the f1C model describes both the front peak of the tissue curve and the later region more precisely than the simple 1C model. Compared with the 1C model, the residual function of the f1C model shows an increased probability for both very short residence times and long residence times. The significant clustering at the margins of the necrotic tumor areas obtained with the f1C model and shown Fig. 2B and Fig. 2C is in good agreement with published reports suggested that high perfusion is to be expected adjacent to the necrotic tumor core [10,11]. It is also plausible that, in these tumor areas, perfusion is more heterogeneous, indicated by a decrease in derivation order α, since they represent highly inflammatory, hostile areas, in the tumor has progressed locally so far that it annihilates its own metabolic basis, shortly before it becomes necrotic.
Conclusions
The DCE-MRI technique of the present study using blood pool contrast agent in combination with a fractional 1-compartment tracer kinetic model allows for the absolute perfusion quantification of low perfused organs like muscles by considering kinetic heterogeneity.Acknowledgements
We would like to thank Dr. Anika Söhner and Dr. Marc Maaß for their collaboration on the animal experiments.References
1. Gillies RJ, Schornack PA, Secomb TW, Raghunand N. Causes and effects of heterogeneous perfusion in tumors. Neoplasia. 1999;1:197–207.
2. Vaupel P. Tumor microenvironmental physiology and its implications for radiation oncology. Semin Radiat Oncol. 2004;14:198–206.
3. Magin RL. Fractional calculus models of complex dynamics in biological tissues. Comput MathAppl. 2010;59:1586–1593.
4. Dokoumetzidis A. Fractional Pharmacokinetics. in Modeling in Biopharmaceutics, Pharmacokinetics and Pharmacodynamics: Homogeneous and Heterogeneous Approaches (Interdisciplinary Applied Mathematics, Volume 30.) (Macheras P, Iliadis A. , eds.), Ch. 9, :211–226.Switzerland: Springer. 2. ed. 2016.
5. West BJ. A mathematics for medicine: The Network Effect. Front Physiol. 2014;5:456.
6. Butera S, Di Paola M. A physically based connection between fractional calculus and fractal geometry. Ann Phys - New York. 2014;350:146–158.
7. Mittag-Leffler MG. Sur la nouvelle fonction Eα(x). C R Acad Sci. 1903;137:554–558.
8. Sauerbrey A, Hindel S, Maaß M, et al. Establishment of a swine model for validation of perfusion measurement by dynamic contrast-enhanced magnetic resonance imaging. BioMedresearch international. 2014;2014:390506.
9. Hindel S, Papanastasiou G, Wust P, Maaß M, Söhner A, Lüdemann L. Evaluation of pharmacokinetic models for perfusion imaging with dynamic contrast-enhanced magnetic resonance imaging in porcine skeletal muscle using low-molecular-weight contrast agents. Magn ResonMed. 2018;79:3154–3162.
10. Soni S, Tyagi H, Taylor RA, Kumar A. The influence of tumour blood perfusion variability on thermal damage during nanoparticle-assisted thermal therapy. Int J Hyperthermia. 2015;31:615–625.
11. Santos HDA, Ximendes EC, Cruz M, et al. In Vivo Early Tumor Detection and Diagnosis by Infrared Luminescence Transient Nanothermometry. Adv Funct Mater. 2018;28:1803924.
Figures