4730
IAUC derived permeability index factor is a robust parameter for permeability visualization in breast cancer brain metastasis in mice & patients.1Radiology & Biomedical Engineering, Northwestern University, Evanston, IL, United States, 2Radiology, Northwestern Memorial Hospital, Chicago, IL, United States, 3Diagnostic Radiology, Samitivej Hospital, Bangkok, Thailand, 4Radiology, Northwesten Unversity, Chicago, IL, United States, 5Neurological Surgery, Northwestern, Chicago, IL, United States
Synopsis
A iAUC derived tumor permeability index factor (TPIF) provides a reliable and robust reporter of breast cancer brain metastases (BCBM) tumor microenvironment permeability patterns without the confounding elements of model-based DCE-MRI analysis (i.e. low sensitivity, inability to fit, inter-subject data reliability). A comparison of results in both mice and patients suggests that this parameter can serve as an additional tool for improved, early clinical diagnosis and for therapeutic testing at the preclinical level.
Introduction
Breast cancer (BC) is one of the most common cancers in women, with 30% of the patient population developing brain metastases (BCBM) at later stages of the disease [1-2]. The BCBM tumor lesions present a very heterogeneous and complex microenvironment [3] greatly reducing successful implementation of both targeted and non-targeted treatments and complicating post-treatment diagnostic follow-ups. The ability to visualize and track the complex progression and treatment response are essential for improving clinical outcomes. Non-invasive MRI is an essential tool and several clinical trials are currently in place to harness its potential for both early diagnosis and to aid development of novel therapies in BCBM [2]. However the reliance on subjective radiological evaluation criteria and low inter-subject reliability of the derived parameters limits its success. DCE-MRI is a clinically-tested approach that can be used to obtain physiological information about tumor permeability and perfusion through kinetic modeling of the data. However the extraction of reliable parameters is often confounded by different factors (low sensitivity, inability to fit all data points, required knowledge of several physiological parameters). Here we relied on a method described in [4], which allowed us to extract tumor permeability regional information using an approach that offers the robustness of non-model based analysis while still retaining the ability to report on the complex BCMB lesion micro environment.Methods
All animal studies were approved by NU IACUC. Six-week old nu/nu athymic nude mice (n=4) received an intracranial injection of BT474BrM3 fluc tumor cells (neurotropic brain metastatic HER2+ breast cancer line expressing firefly luciferase enzyme activity). Following injection, tumor growth was monitored weekly using bioluminescent imaging of the luciferase enzyme activity until the light intensity reached the target at 108 RLU. At this stage each mouse underwent MRI on a 7Tesla ClinScan. Using a dedicated 4-channel coil, a series of anatomical T1 and T2 weighted sequences were acquired followed by a set of dynamic scans using a GRE sequence (TR=70 msec,TE=1.9 msec, FA=15, 120 repetitions ( repetition time ~5 sec ) and a tail-vein bolus injection of 0.3 mmol/Kg of Gd agent (Prohance). Two hours after injection of Dextran Texas Red each mouse was sacrificed and underwent a pathological and immunological evaluation (DAPI nuclear stain and anti-laminin B antibody stain).Four patients with BCBM who underwent MRI were selected for comparison with mouse data. All patients had previously received whole brain and/or stereotactic radiosurgery. Several clinically prescribed scans were conducted, including DCE-MRI (Gadavist) using GRE with TR=4.02 msec, TE= 2msec, FA=10, 90 repetitions (RT~5 sec) on a 3T PET/MRI scanner. Image processing was done using JIM (Xinapse) and ITK-SNAP software. The processing scheme is shown in Fig. 1 outlining the steps to extract the data. For each set we obtained voxel-by-voxel integrated area under the curve (iAUC) maps at different times after injection (30-300 sec). These were used to generate modified KTrans (mKTrans ) maps using the equation in Fig 1. (method details in [4]). KTrans maps were also derived through least-square voxel-by-voxel fitting of dynamic data with a Tofts model. The mKTrans maps were segmented and color coded into five regions corresponding to different threshold windows as shown in Fig 1. The thresholded tumor permeability index factors (TPIF) were then calculated as volumetric ratios (region volume divided by total tumor volume) and expressed in %.Results & Discussion
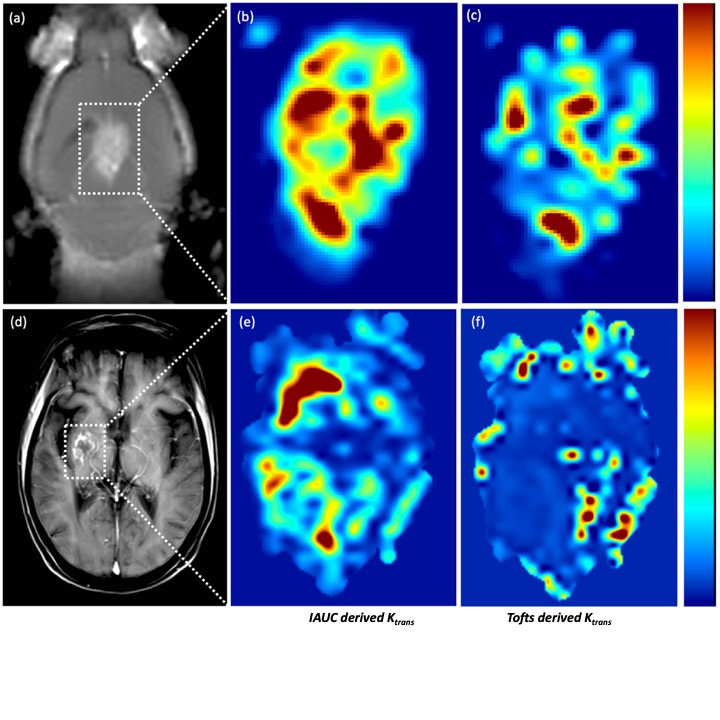
Shown in Figure 2 are representative images depicting MR images and tumor permeability maps for a BCMB mouse (a, b, c) and BCMB patient (d, e, f). The left-most two panels ((a) and (d)) depict the MR images (mouse and patient) with outlined the tumor regions. The middle panel ((b) and (e)) show the tumor corresponding mKTrans maps derived using the iAUC data (mouse and patient respectively) while the right-most panel ((c) and (f)) show the KTrans maps obtained using Tofts model-based approach. One can notice some similarities in high-leakage (red) regions but overall Toft model-based approach is unable to reproduce complex permeability patterns captured by the mKtrans maps qualitatively confirmed by histological evaluation (data not shown here). Finally, plotted in Fig 3-(a) is TPIF vs mKTrans averaged across different mice, exhibiting a very consistent set of values for our set of mice that were scanned at same stages of progression.Conclusion
A non-model dependent approach was used to extract physiologically relevant TPIF parameters from DCE-MRI data in BCBM mice and patients. These parameters quantitatively describe regional permeability levels for each tumor and enable enhanced 2D and 3D visualization (see Fig 3-(b). Comparison of the imaging data with histopathology and immunostaining results correlated reliably and in both cases showed heterogeneous permeability patterns characterized by local “hot spots” (i.e. regions of high contrast leakage) adjacent to regions with little or no leakage. The reliability of these parameters was also confirmed through inter-subject comparison using mice at the same stage of progression (i.e. mice showed similar permeability patterns). Our result suggests that the the described approach can capture and quantitatively track the complex heterogeneous tumor micro environment of BCBM lesions while retaining the robustness and inter-subject reliability of non model based approaches providing a potential clinical and preclinical tool to visualize, diagnose and study BCBM.Acknowledgements
We would like to thank the Northwestern Department of Radiology and the Center for Translational Imaging for providing support for this work.References
[1] Kotecki N., Lefran F., Devriendt D., Awada A.. Therapy of breast cancer brain metastases: challenges, emerging treatments & perspectives. Therapeutic Advances in Medical Oncology. 2018; Vol 10:1-10.
[2] Centers for Disease Control and Prevention. Breast Cancer Statistics. Available at: https://www.cdc.gov/cancer/breast/statistics/index.htm.
[3] Klos KJ, O’Neill BP. Brain metastases. Neurologist 2004; 10:31-46.
[4] Cheng HL, Improved correlation to quantitative DCE-MRI pharmacokinetic parameters using a modified initial area under the uptake curve (mIAUC) approach. J Magn Reson Imaging 2009; 30(4):864-72
Figures