4726
Lung and kidney metabolism altered by cancer-induced cachexia1Division of Cancer Imaging Research, The Russell H. Morgan Department of Radiology and Radiological Science, The Johns Hopkins University School of Medicine, Baltimore, MD, United States, 2Sidney Kimmel Comprehensive Cancer Center, The Johns Hopkins University School of Medicine, Baltimore, MD, United States, 3Radiation Oncology and Molecular Radiation Sciences, The Johns Hopkins University School of Medicine, Baltimore, MD, United States
Synopsis
To understand the impact of pancreatic cancers on body organs within the context of cancer induced cachexia we have, in ongoing studies, characterized the metabolism of organs in tumor bearing mice. Cancer-induced cachexia occurs in 80% of pancreatic ductal adenocarcinoma (PDAC) patients. Here we present data demonstrating the significant impact of cachexia-inducing Pa04C PDAC xenografts compared to non-cachexia inducing Panc1 xenografts and normal mice on kidney and lung metabolites as identified by 1H MRS of tissue extracts. These metabolic changes may contribute to increased morbidity and poor quality of life but equally may present novel targets for intervention.
Introduction
Cachexia is an underexplored and yet devastating consequence of cancer that induces a ‘wasting away’ of the body. Defined as an unexplained weight loss of 5% over 3 to 6 months, the condition is associated with poor treatment outcome, fatigue, and poor quality of life [1]. To date there are no known cures for this condition. Since the syndrome occurs with the highest frequency and severity in pancreatic cancer [2] our ongoing studies have focused on understanding the metabolic impact of pancreatic cancer induced cachexia in vital organs using 1H MRS of organ extracts to expand our understanding of this syndrome. Here we have focused on understanding the metabolic changes occurring in the lungs and kidneys using our well established PDAC xenograft models to compare organ changes in mice with cachexia-inducing xenografts (Pa04C) to mice with non-cachexia-inducing xenografts (Panc1) and normal mice. We have established significant weight loss in Pa04C tumor bearing mice compared to Panc1 tumor bearing mice [3].Methods
The Panc1 cell line was obtained from ATCC and the Pa04C cell line was kindly provided by Dr. Maitra. Cancer cells were inoculated in the right flank of six to eight week old male severe combined immunodeficient mice. Kidneys and lungs from normal mice and from Pa04C and Panc1 tumor bearing mice (n=5 per group), excised from euthanized mice once tumors were ~300 mm3, were snap frozen and stored at -80°C prior to dual phase extraction. 1H MRS was performed on the water phase. All 1H MR spectra with water suppression were acquired on a 750 MHz MR spectrometer using a single pulse sequence. All data processing analyses and quantification were performed with TOPSPIN 3.5 software. Statistical analysis was performed with MetaboAnalyst software [4].Result and Discussion
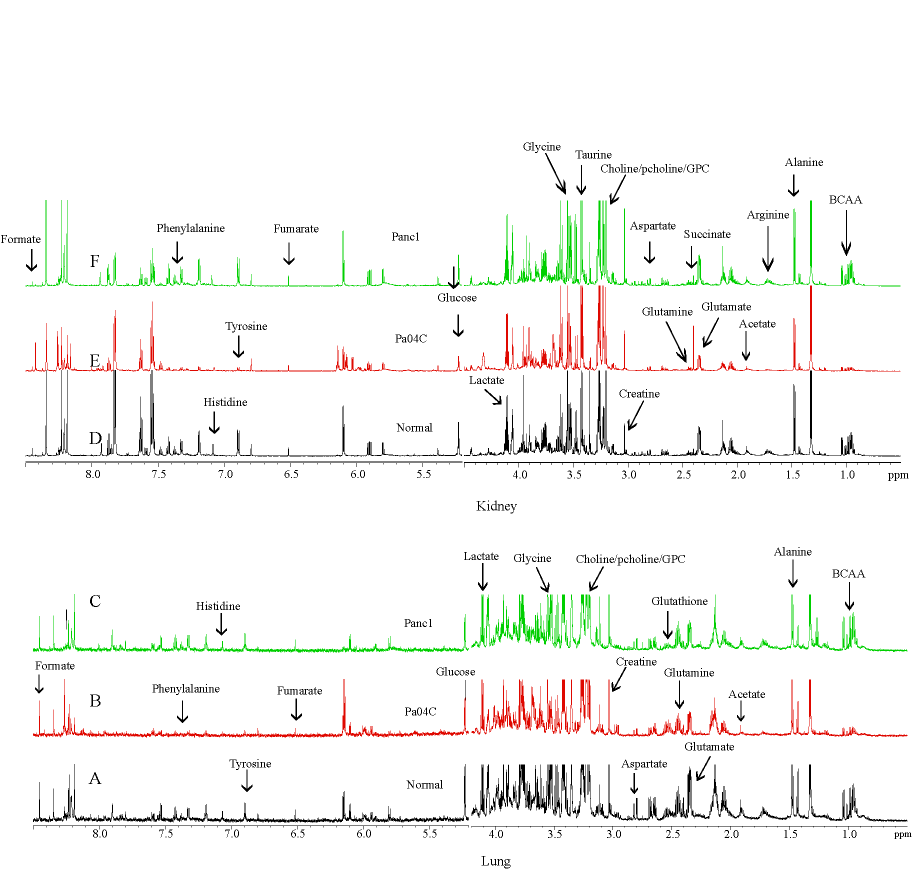
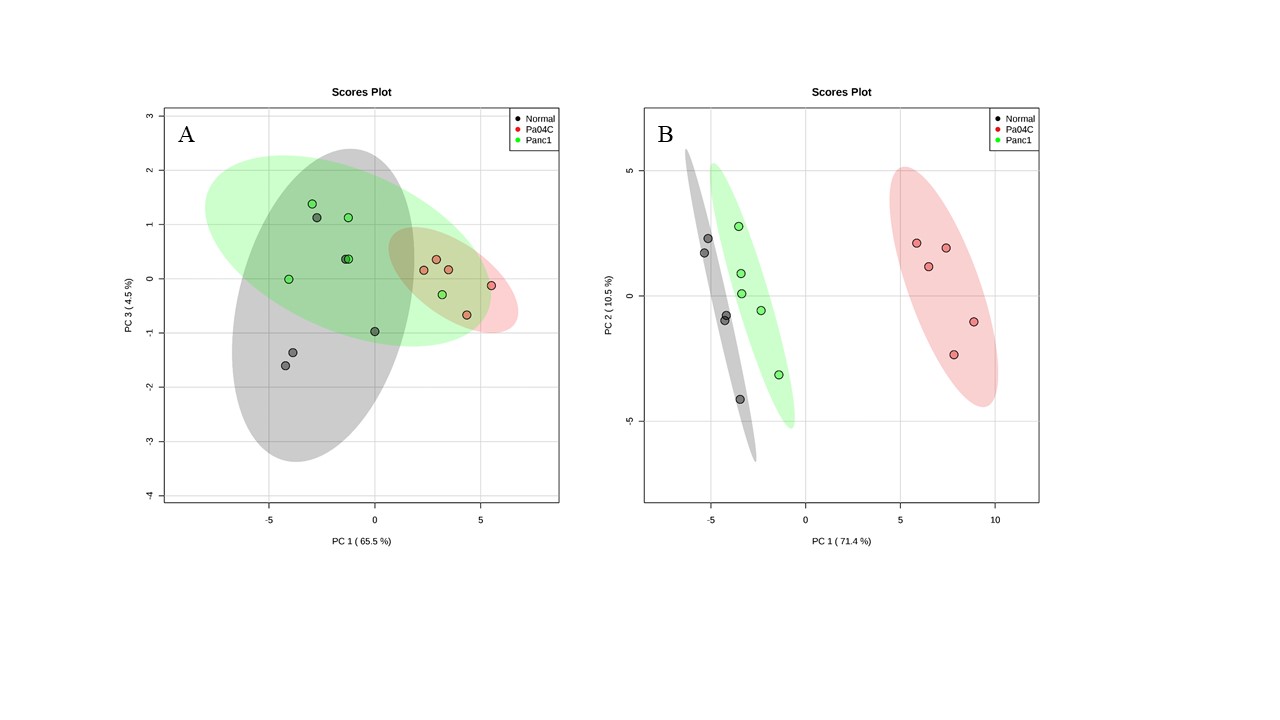
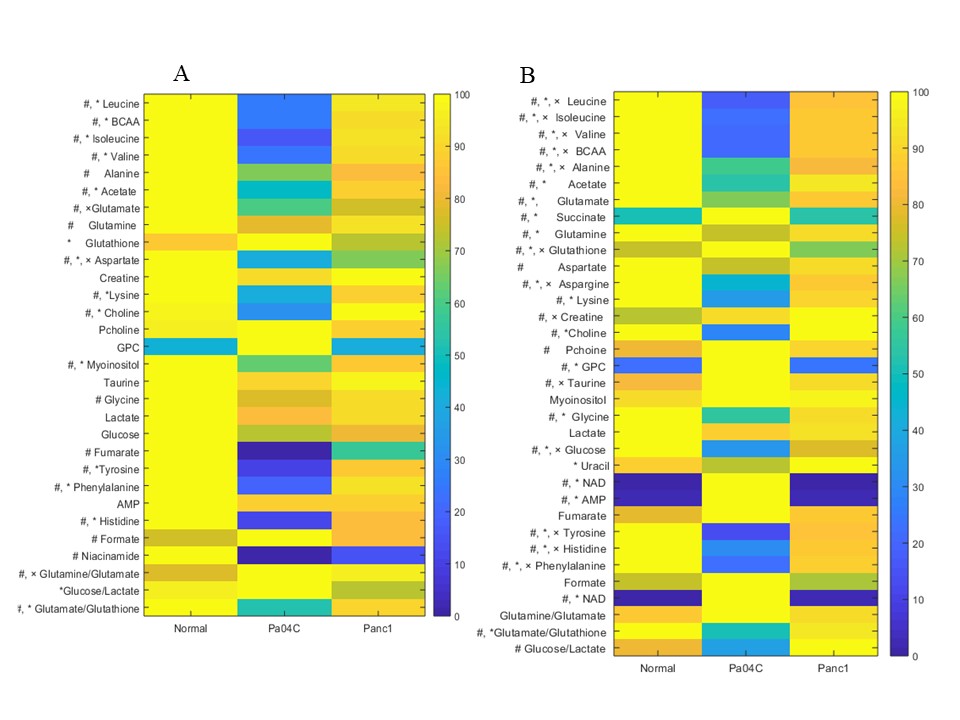
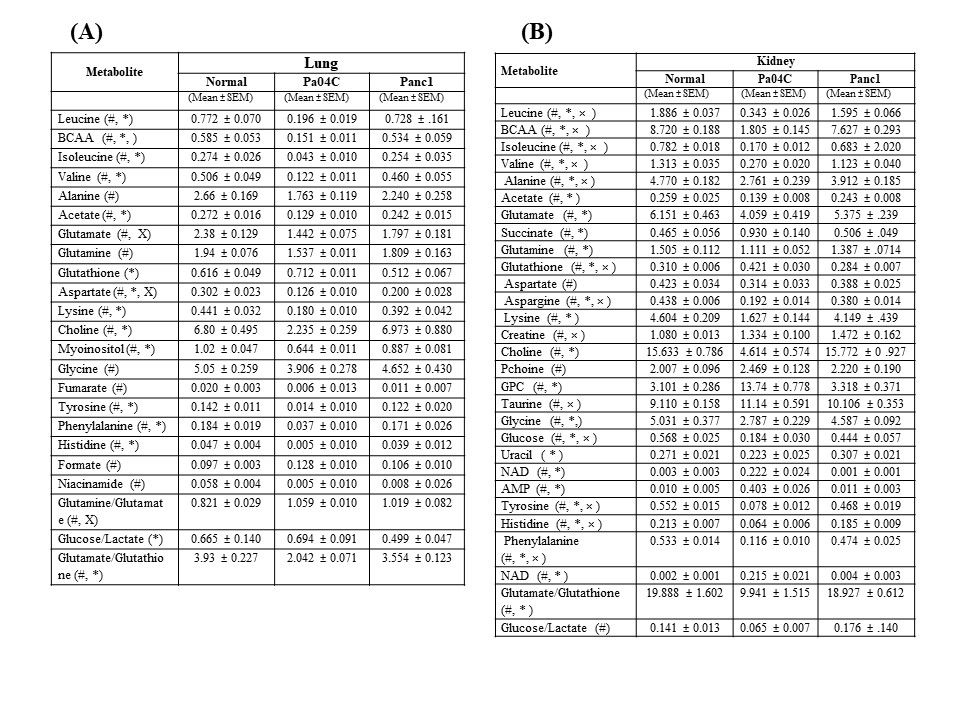
Representative 1H MR spectra from the kidneys and lungs of normal, cachectic and non-cachectic tumor bearing mice are shown in Figure 1. Significant differences in several metabolites can be observed in the lungs (Figures 1A-C) and kidneys (Figures 1D-F) of Pa04C tumor bearing mice compared to Panc1 tumor bearing mice and normal mice. Multivariate principal component analysis (PCA) of the data presented for the lung in Figure 2A and for the kidney in Figure 2B demonstrate the strong separation between the Pa04C tumor bearing group compared to the Panc1 tumor bearing group and normal mice. Heat map analysis of the quantified metabolites from normal, non-cachetic and cachectic mice that were significantly altered are presented for the lungs in Figure 3A and for the kidneys in Figure 3B. Metabolite values as Mean + SEM that were significantly different in the lungs and kidneys between normal, Panc1 and Pa04C groups are presented in Table 1. Profound differences were identified in multiple metabolites in the lungs and kidneys of cachexia inducing Pa04C tumor bearing mice compared to normal and Panc1 tumor bearing mice. Significant differences were also identified in Panc1 tumor bearing mice compared to normal mice. These data highlight the profound systemic impact of cachexia inducing Pa04C tumors on the metabolism of vital organs such as the lung and kidney, and also reveal the impact of non-cachexia inducing tumors on the lung and kidney. These metabolic changes are highly likely to impact the function of these organs. Our results support an expanded understanding of the changes in organ metabolism that may occur with cancer-induced cachexia and with cancer in general that may contribute to morbidity and poor treatment response. Our results also support investigating organ-targeted metabolic interventions to prevent cancer-induced morbidity and weight-loss.Acknowledgements
This work was supported by NIH R35CA209960 and R01CA193365.References
1. Fearon K, Strasser F, Anker SD, Bosaeus I, Bruera E, Fainsinger RL, Jatoi A, Loprinzi C, MacDonald N, Mantovani G, Davis M, Muscaritoli M, Ottery F, Radbruch L, Ravasco P, Walsh D, Wilcock A, Kaasa S, Baracos VE. Definition and classification of cancer cachexia: an international consensus. The Lancet Oncology. 2011;12(5):489-95. doi: 10.1016/S1470-2045(10)70218-7. PubMed PMID: 21296615.
2. Anker MS, Holcomb R, Muscaritoli M, von Haehling S, Haverkamp W, Jatoi A, Morley JE, Strasser F, Landmesser U, Coats AJS, Anker SD. Orphan disease status of cancer cachexia in the USA and in the European Union: a systematic review. Journal of cachexia, sarcopenia and muscle. 2019;10(1):22-34. doi: 10.1002/jcsm.12402. PubMed PMID: 30920776; PubMed Central PMCID: PMC6438416.
3. Winnard PT, Jr., Bharti SK, Penet MF, Marik R, Mironchik Y, Wildes F, Maitra A, Bhujwalla ZM. Detection of Pancreatic Cancer-Induced Cachexia Using a Fluorescent Myoblast Reporter System and Analysis of Metabolite Abundance. Cancer research. 2016;76(6):1441-50. doi: 10.1158/0008-5472.CAN-15-1740. PubMed PMID: 26719527; PubMed Central PMCID: PMC4794402.
4. Xia J, Wishart DS. Web-based inference of biological patterns, functions and pathways from metabolomic data using MetaboAnalyst. Nature protocols. 2011;6(6):743-60. Epub 2011/06/04. doi: 10.1038/nprot.2011.319. PubMed PMID: 21637195.
Figures