4723
Early MR-detectable biomarkers of mutant IDH inhibition in patient-derived low-grade gliomas in vivo1Radiology and Biomedical Imaging, University of California San Francisco, San Francisco, CA, United States, 2Neurological Surgery, University of California San Francisco, San Francisco, CA, United States, 3Brain Tumor Research Center, University of California San Francisco, San Francisco, CA, United States
Synopsis
Low-grade glioma (LLG) patients have a relatively long-term survival of ~13 years but these tumors always recur. Since IDH mutations are present in >80% of LGGs, inhibition of mutant IDH activity is being tested as a new therapeutic approach. Here, we investigated response to mutant IDH inhibition by AG-881 in orthotopic LGG mouse models. Using in vivo 1H MRS we detected, in addition to a decrease in 2-HG, an early increase in both glutamate and glutamine/glutamate that were associated with subsequent tumor shrinkage. This identifies potential early metabolic biomarkers of LGG response to mutant IDH inhibition.
Introduction
According to the updated World Health Organization (WHO 2016) classification system, diffuse infiltrative low-grade glioma (LLG) are now defined as astrocytoma or oligodendroglioma based on histology, isocitrate dehydrogenase (IDH) mutation status,1p/19q codeletion or/and ATRX status.1 IDH1/2 mutations that drive LGG development result in the neomorphic enzyme activity catalyzing conversion of α-ketoglutarate (α-KG) to 2-hydroxyglutarate (2-HG). Since IDH mutations are present in the majority of LGGs, inhibition of mutant IDH activity is a promising therapeutic approach. AG-881, a brain permeable pan-mutant IDH inhibitor, is undergoing Phase-I clinical trials for non-enhancing gliomas harboring the IDH1 mutation.2 The goal of this study was to identify early translatable MR-detectable biomarkers by assessing response in orthotopic patient-derived LGG mouse models in vivo.Methods
LGG tumors were induced by intracranial injection of cells into SCID Fox mice (CharlesRiverLab). We investigated 3 models: BT257 patient-derived astrocytoma (University of Calgary), SF10417 patient-derived oligodendroglioma (UCSF) and NHAmutIDH (genetically engineered normal human astrocytes; UCSF). Once tumors reached 2-3mm in diameter, mice were treated daily p.o. with either oral suspending vehicle Ora-plus (4ml/kg; Perrigo) or pan-mutant IDH inhibitor, AG-881, (50 mg/kg, 4ml/kg; MedChemExpress, USA) resuspended in Ora-plus.MR in vivo studies were performed in a vertical wide-bore Agilent 600MHz scanner. T2-weighted images were acquired using a spin-echo multi-slice sequence (TE/TR=20/1200ms, FOV=30x30mm2, 256x256, slice thickness=1mm, NA=2). Tumor volume was determined as the sum of manually contoured tumor areas in each slice and multiplied by slice thickness using in-house software. In vivo 1H MRS spectra were recorded from a single voxel >8mm3 using Point-RESolved Spectroscopy sequence (TE/TR=20/4000ms, 512) and analyzed using LCmodel with normalization to total signal. At the end of MR studies, animals were sacrificed and tumors rapidly frozen in liquid nitrogen.
For ex vivo 1H MRS studies, 10-30mg of frozen tumor tissues were extracted using the dual-phase extraction method. Lyophilized aqueous phase was resuspended in 500μL of 0.1mM phosphate buffer in D2O. The spectra were acquired on a Bruker 500MHz spectrometer analyzed using Mnova and Chenomx, and metabolite concentrations were normalized to wet weight.
Results
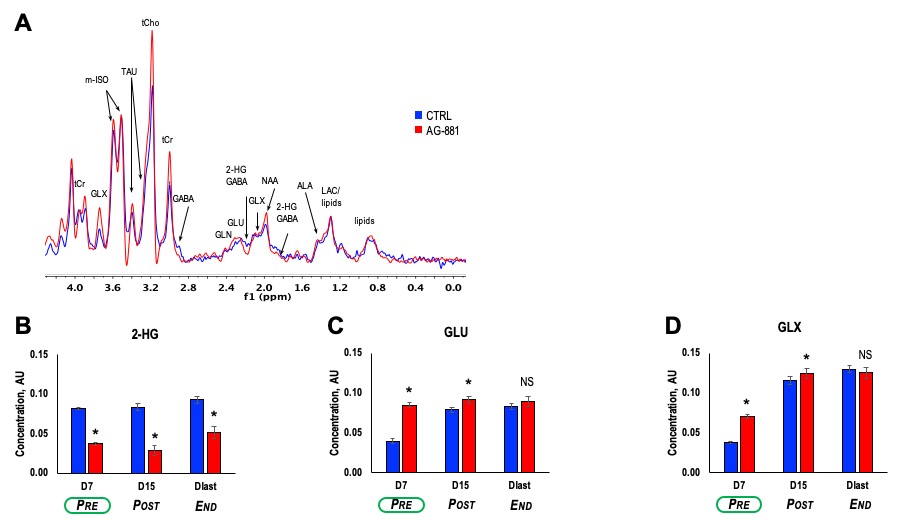
Patient-derived BT257 glioma cells formed non-enhancing homogeneous MR-detectable tumors within 73±19 days post-implantation. While no significant differences were observed in average tumor volume between treatment groups at D7 (p-value=0.363, PRE-shrinkage), differences in volume were detectable starting at D15 (p-value=0.081, POST-shrinkage), a time point when over 50% of animals were alive in both treatment groups. Differences in average tumor volume could no longer be detected when animals reached Dlast (p-value=0.959, END), a time point when the animals needed to be sacrificed (Figure 1A-C). Importantly however, AG-881 treatment led to overall slower tumor growth and significantly increased survival (Chi squared=13.5, p-value=0.0002) (Figure 1D).We performed in vivo 1H MRS at PRE-, POST-shrinkage and END time points (Figure 2A). Treatment with AG-881 led to a consistent significant decrease in 2-HG concentration (~55%, p-value<0.0001) which was observed independent of time point or tumor shrinkage (Figure 2B). In addition, the concentration of glutamate (GLU) exhibited a significant increase at both PRE- (115%, p-value<0.0001) and POST-shrinkage (16%, p-value<0.001) time points in response to AG-881 treatment, while observed increase disappeared at the END time point (Figure 2C). A transient significant increase was also observed in the combined glutamate/glutamine peak (GLX) concentration at the PRE- (86%, p-value<0.0001) and POST-shrinkage (7%, p-value=0.03) time points, while the END time point was accompanied by disappearance of these changes (Figures 2D).
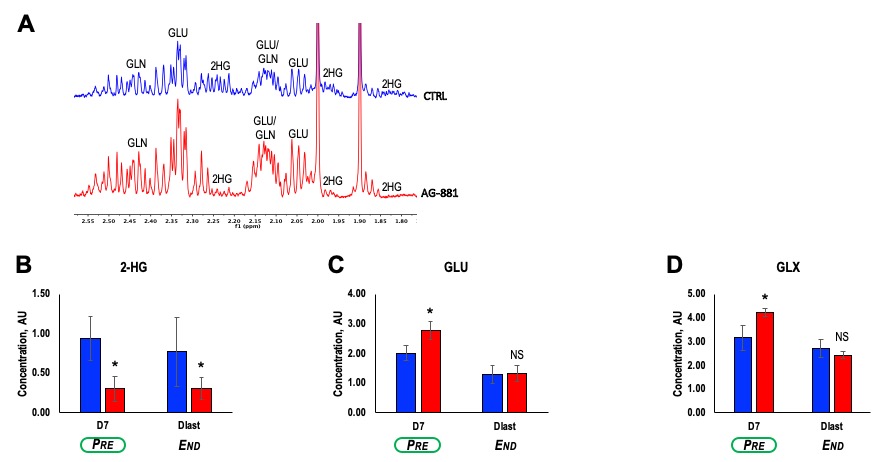
Further analysis of tumor extracts using ex vivo 1H MRS (Figure 3A) confirmed our in vivo findings showing that treatment with AG-881 led to a significant decrease in 2-HG concentration (~64%, p-value=0.004) independent of time point (Figure 3B). We also detected a significant increase in concentration of both GLU (38%, p-value=0.03) and GLX (33%, p-value=0.05) at PRE-shrinkage time point (Figure 3C-D).
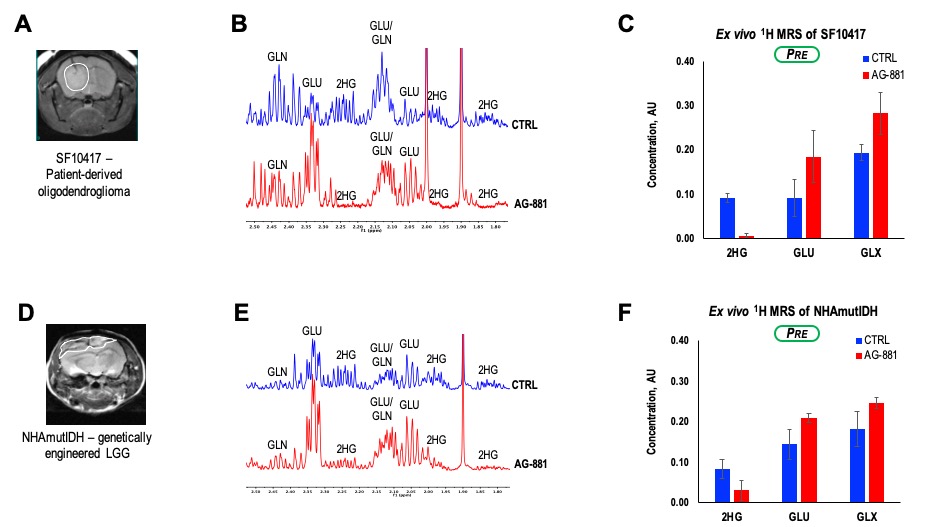
To further assess the generality of our findings we also investigated response in the SF10417 (Figure 4A-C), or NHAmutIDH (Figure 4D-F) tumors. We detected a decrease in 2-HG concentration (78%) and increase in concentration of both GLU (51%) and GLX (27%) in SF10417 LGGs treated with AG-881. Similarly, AG-881 treatment of NHAmutIDH-tumors led to a decrease in 2-HG concentration (62%) and increase in concentration of both GLU (44%) and GLX (35%). These observations were in good agreement with our findings in the BT257 LGG model.
Discussion
In our study, mice intracranially bearing LGG were orally treated with the pan-mutant IDH inhibitor, AG-881. We non-invasively monitored the changes in metabolic profile during longitudinal mutant IDH inhibition using conventional 1H MR spectroscopy and confirmed our findings ex vivo. During the course of AG-881 treatment we observed a consistent reduction in 2-HG, confirming AG-881 brain penetration and action. Moreover, we detected changes in GLU and GLX prior to visible changes in tumor volume. This observation is consistent with previous reports that the IDH1 mutation alters GLU metabolism.3,4 We also confirmed the generality of our findings by investigating 3 different LGG models. Our study identifies the increase in GLU and GLX together with the drop in 2-HG as potential translatable early metabolic biomarkers of LGG response to mutant IDH inhibition.Acknowledgements
NIH R01CA197254References
1. Louis DN, Ohgaki H, Wiestler OD, Cavenee WK. World Health Organization Histological Classification of Tumours of the Central Nervous System. (2016), International Agency for Research on Cancer, France
2. Mellinghoff IK, Penas-Prado M, Peters KB, Cloughesy TF, Burris HA, Maher EA, Janku F, Cote GM, De La Fuente MI, Clarke J, Steelman L, Le K, Zhang Y, Sonderfan A, Hummel D, Schoenfeld S, Yen K, Pandya SS, Wen PY. Phase 1 study of AG-881, an inhibitor of mutant IDH1/IDH2, in patients with advanced IDH-mutant solid tumors, including glioma. (2018), Journal of Clinical Oncology, 36
3. Izquierdo-Garcia JL, Viswanath P, Eriksson P, Chaumeil MM, Pieper RO, Phillips JJ, Ronen SM. Metabolic Reprogramming in Mutant IDH1 Glioma Cells. (2015), PLos One, 10(2)
4. Nagashima H, Tanaka K, Sasayama T, Irino Y, Sato N, Takeuchi Y, Kyotani K, Mukasa A, Mizukawa K, Sakata J, Yamamoto Y, Hosada K et al Diagnostic value of glutamate with 2-hydroxyglutarate in magnetic resonance spectroscopy for IDH1 mutant glioma. (2016), Neuro-Oncology 18(11) 1559-1568
Figures