4722
Quantitative imaging of adipocyte distribution in breast cancer xenograft models1Cancer Physiology, H. Lee Moffitt Cancer Center, Tampa, FL, United States
Synopsis
Lipid deposition and metabolism is relevant for cancer prognosis and treatment response. Imaging characterisation of the adipocyte deposition patterns in breast cancer and its relationship with the microenvironment may therefore provide valuable insight into the tumour. A Chemical selected saturation based MR technique was optimised and validated in vivo and ex vivo to visualize adipocyte distribution in breast cancer xenografts. The measurements reveal clear differences in adipocyte accumulation between different breast models. In the future this technique will be applied to understand the role of adipocyte distribution in breast cancer.
Introduction
The importance of lipid deposition and metabolism in cancer is widely appreciated, yet not fully understood. Lipid synthesis has been observed to be altered in malignant cells of multiple cancer types, and the changes in lipid composition has been linked to other hallmarks of cancer such as angiogenesis, hypoxia, and cell migration1. In breast cancer, lipid deposition in adipocytes has been shown to relate to tumour response to chemotherapy, as well as being relevant to novel treatment strategies2. We have shown previously that diffusion restriction in non-viable regions of breast cancer is spatially correlated to the presence of adipocytes . Efficient characterization of the adipocyte deposition patterns in breast cancer and its relationship with the tumour microenvironment may therefore be valuable in disease prognosis and treatment response evaluation. MRI methods are particularly suitable for this application4 thanks to the multi-contrast information available within one imaging session through different sequences. MR measurements of fat deposits have been performed and validated particularly in liver diseases5,6, but rarely in breast cancer, where the spatial distribution of lipid accumulation within tumours is likely to have significant prognostic value.Methods
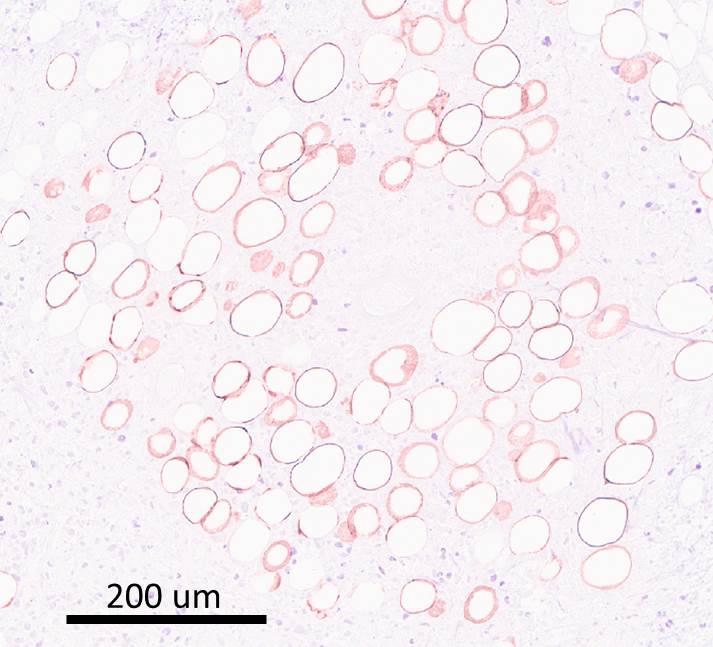
MDA-MB-231 human breast cancer cells were implanted into the mammary fat pad of NSG mice (n=10). When the tumours reached 300mm3 volume, they were imaged with MRI (Bruker, 7T) including an optimized chemical shift specific saturation based lipid imaging. An optimized FSE sequence (2000/6ms TR/TE, RARE factor 16, 16 averages, 128x128 points, centric encoding) with chemical selective saturation (CHESS, 1100 Hz bandwidth Gaussian pulse with spoiler) based fat suppression was used to produce a fat suppressed image, followed by the same sequence without fat suppression. The fat fraction (F) in each voxel was then derived as F=(C(NoSup)-C(Sup))/C(NoSup) where C(Sup) and C(NoSup) are the signal intensities in fat suppressed and non-fat suppressed images. In vivo validation was performed with PRESS single voxel MR spectroscopy (2 voxels/tumor). The lipid abundance in the voxel was quantified as the ratio of the integrals for lipid (1.31±0.3ppm) and water (4.70±0.7ppm). The sensitivity of imaging to presence of adipocytes was further confirmed ex vivo by per-slice comparison with H&E stained sections revealing the location and abundance of adipocytes, marked by circular holes in the tissue, that were validated in parallel by staining for perilipin-1, PLIN-1 (Figure 1), a protein characteristically expressed in cell membrane of an adipocyte. Two NSG mice were injected as above with a slower growing, more differentiated MCF7 cells to compare the adipocyte distribution.Results
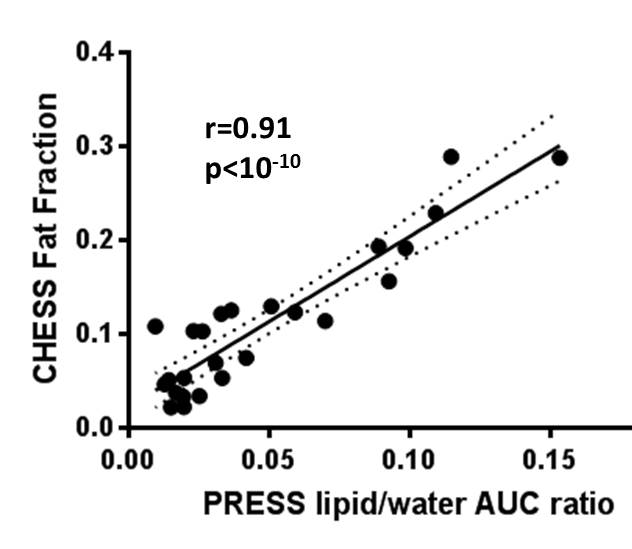
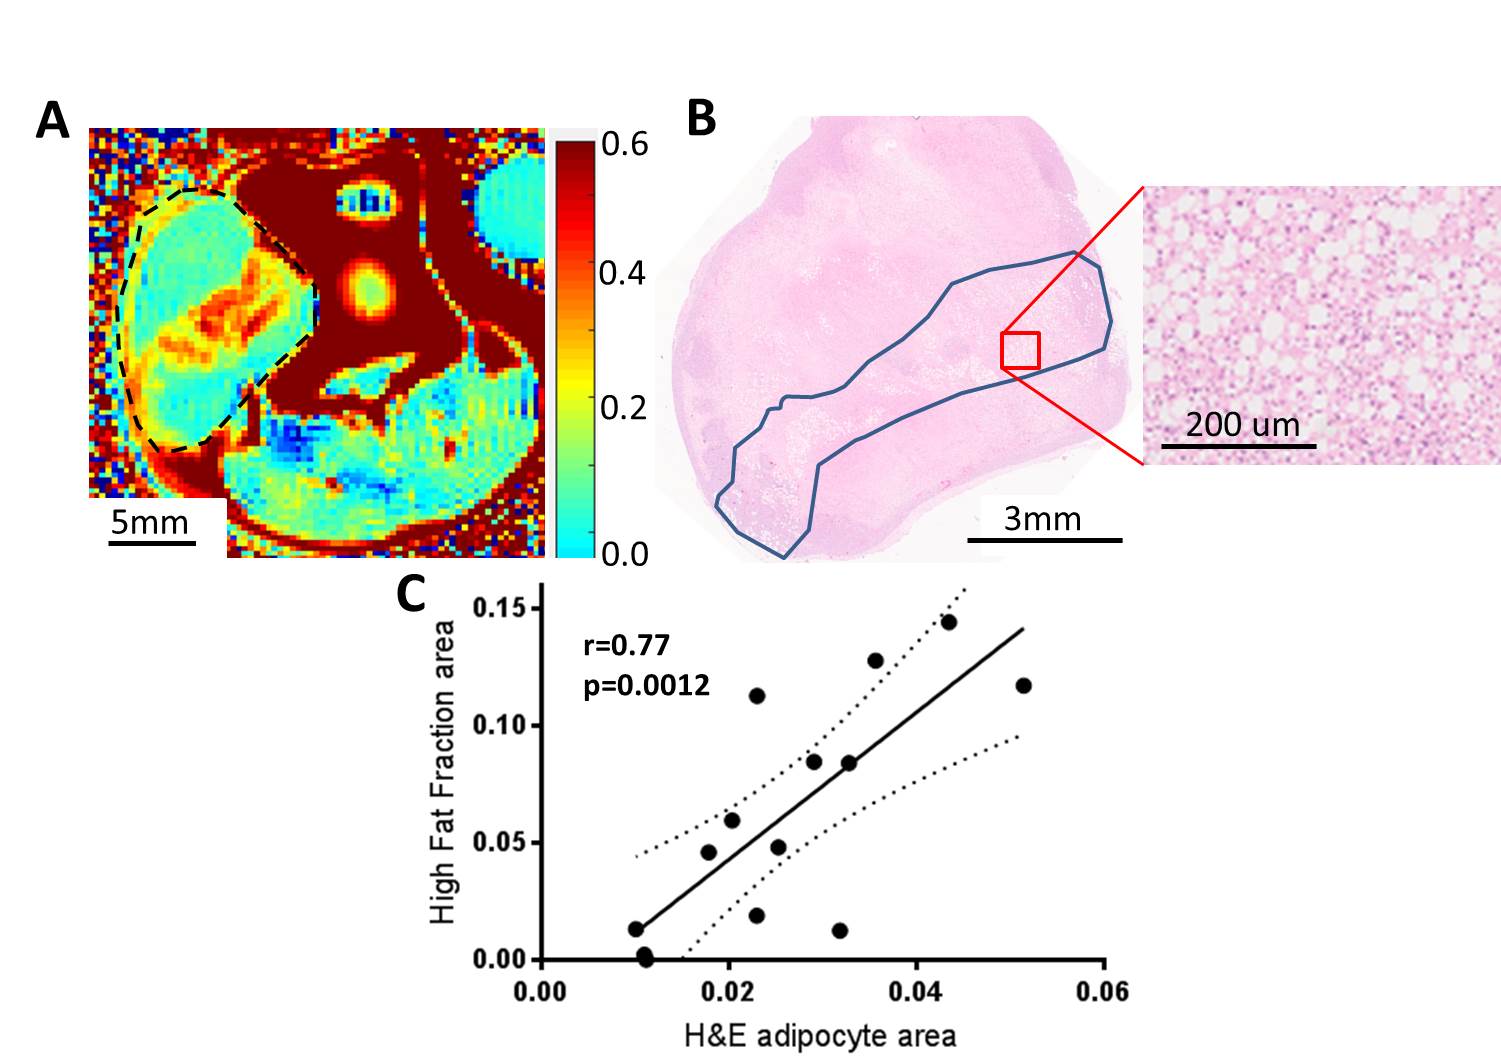
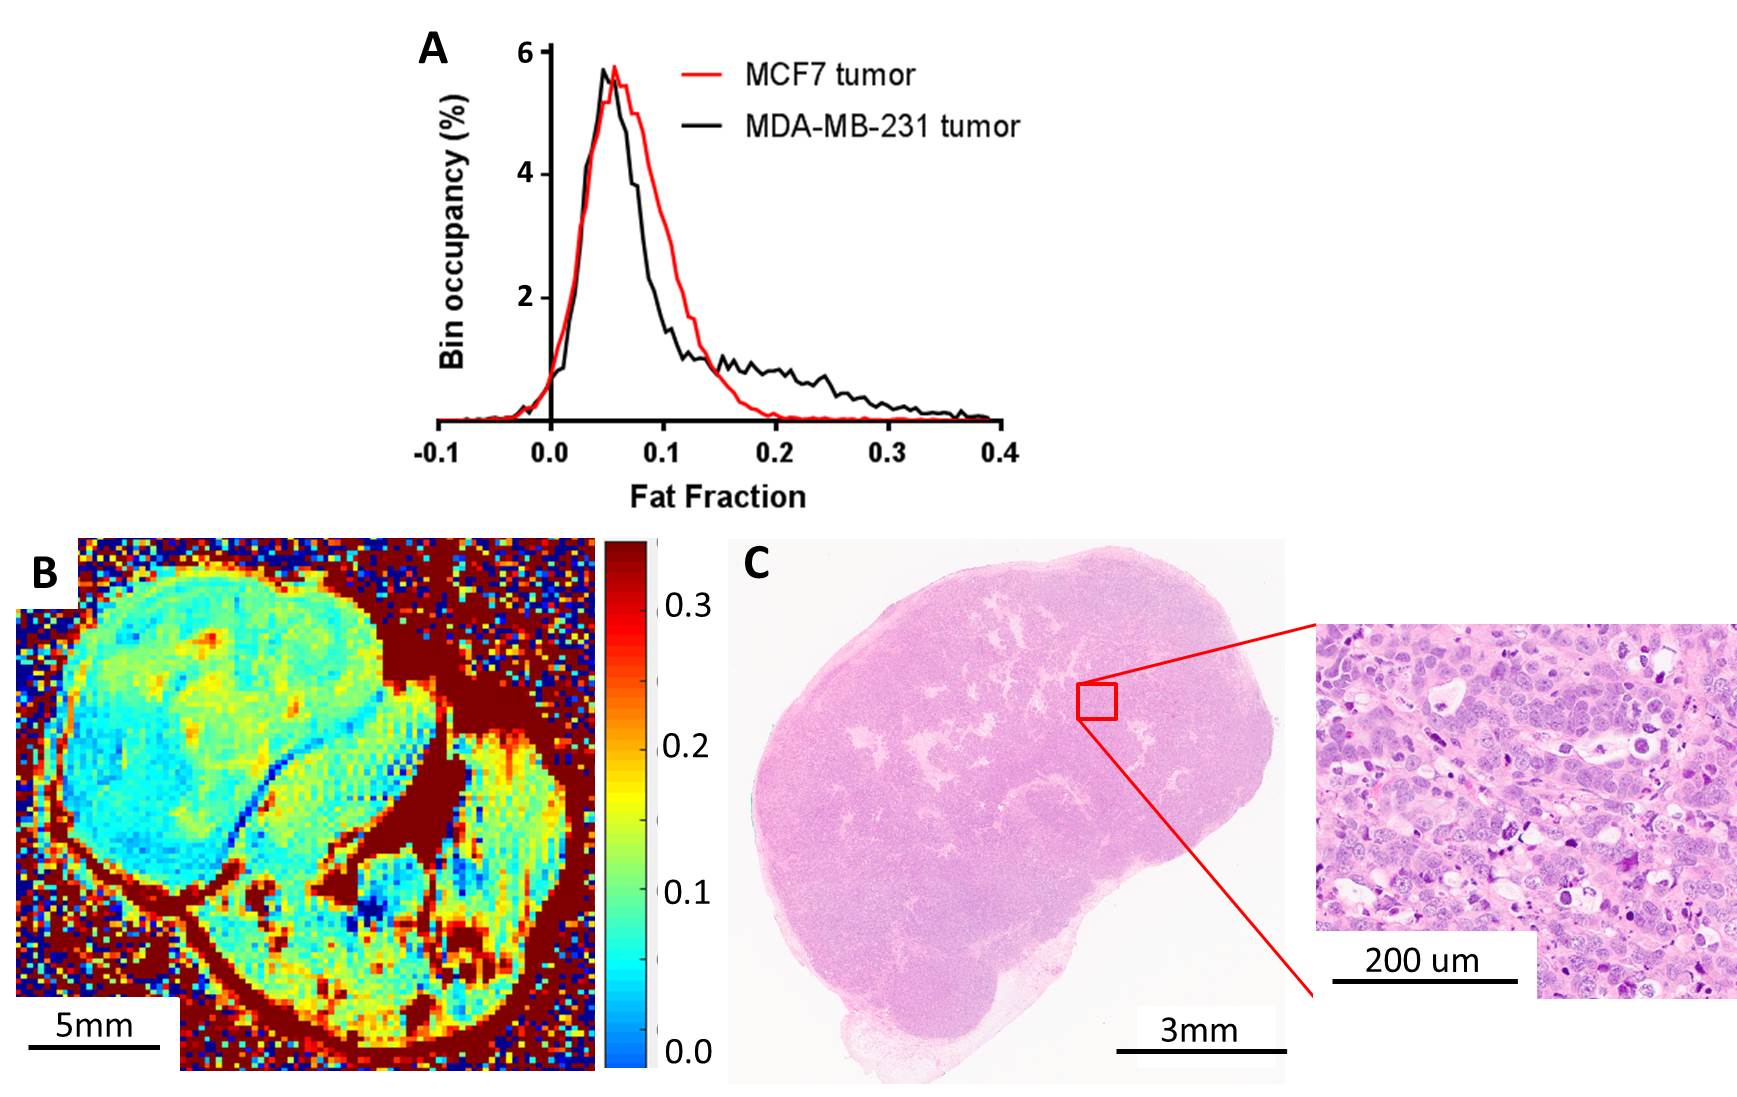
Custom Matlab code was developed to co-localize and compare the single voxel PRESS and imaging CHESS results. Highly significant correlation was observed between them ( Pearson r=0.91, p<10-10,Figure 2). The biological origin of the CHESS lipid signal was identified by histological comparison. Pairing MRI images with corresponding H&E sections (Figure 3A,B) reveals a clear co-localisation of the signal hotspots with adipocyte depositions in H&E. A per-slice quantification of the adipocyte area shows a strong significant correlation to the areas of high signal in CHESS images (Pearson r=0.77, p=0.001, Figure 3 C), further strengthening the relationship. Less aggressive MCF7 tumours showed a visibly different distribution of Fat Fraction in MRI (Figure 4A), with weaker and less localised, yet still present signal (Figure 4B). This observation was confirmed in histological sections from the same tumour type, showing scattered low density adipocyte deposits across the tumour (Figure 4C). A more detailed examination of the ex vivo sections reveals that the adipocyte depositions reside primarily in necrotic areas. Interestingly, diffusion weighted imaging reveals a decreased Apparent Diffusion Coefficient (ADC) in these areas (median ADC in areas of high vs. low fat signal 0. 67±0.02 vs 0. 76±0.03 10-3 mm2/s, p=0.02, n=6).Discussion
Chemical selective saturation MR imaging was shown to clearly delineate and measure concentrations of adipocyte accumulation in mouse breast tumours. Extensive quantitative in vivo and ex vivo validation is shown, highlighting the robustness of the method. The importance of understanding tumor adipocyte distribution is also shown, due to its influence on diffusion values within the tumour. High intratumoural fat density causes significant local lowering of ADC value in otherwise necrotic areas, and hence influencing the tissue viability assessment. Preliminary measurements in different tumor types highlight the heterogeneity of adipocyte deposits between tumors and its likely links to disease characteristics.Conclusions
The result presented above show that chemical selective saturation based fat imaging can be successfully used for delineation of fat deposits in breast tumours, highly relevant in cancer. Future studies will utilize the technique validated above to focus on detailed assessment between the adipocyte deposition and the rest of the tumour microenvironment. This work will help understand the links of intratumour fat to tumour physiology and metabolism, as well as its postulated role in treatment response.Acknowledgements
We would like to acknowledge the support from the Analytical Microscopy, Small Animal Imaging and Tissue Core Facilities at Moffitt Cancer CenterReferences
1. Baenke F, Peck B, Miess H, Schulze A. Hooked on fat: the role of lipid synthesis in cancer metabolism and tumour development. Dis Model Mech2013. p 1353-63.
2. Ishay-Ronen D, Diepenbruck M, Kalathur RKR, Sugiyama N, Tiede S, Ivanek R, et al. Gain Fat-Lose Metastasis: Converting Invasive Breast Cancer Cells into Adipocytes Inhibits Cancer Metastasis. Cancer Cell 2019;35:17-32.e6
3. Jardim-Perassi BV, Huang S, Dominguez-Viqueira W, Poleszczuk J, Budzevich MM, Abdalah MA, et al. Multiparametric MRI and co-registered histology identify tumor habitats in breast cancer mouse models. Cancer Res 2019
4. Delikatny EJ, Chawla S, Leung DJ, Poptani H. MR-Visible Lipids and the Tumor Microenvironment. NMR Biomed 2011;24:592-611
5. Ma X, Holalkere NS, Kambadakone RA, Mino-Kenudson M, Hahn PF, Sahani DV. Imaging-based quantification of hepatic fat: methods and clinical applications. Radiographics 2009;29:1253-77
6. Reeder SB, Sirlin C. Quantification of Liver Fat with Magnetic Resonance Imaging. Magn Reson Imaging Clin N Am 2010;18:337-57
Figures