4721
Mapping hypoxia in brain tumors using GdDO3NI: validation with PET and IHC1Biomedical engineering, Arizona State University, Tempe, AZ, United States, 2Barrow Neurological Institute, Phoenix, AZ, United States
Synopsis
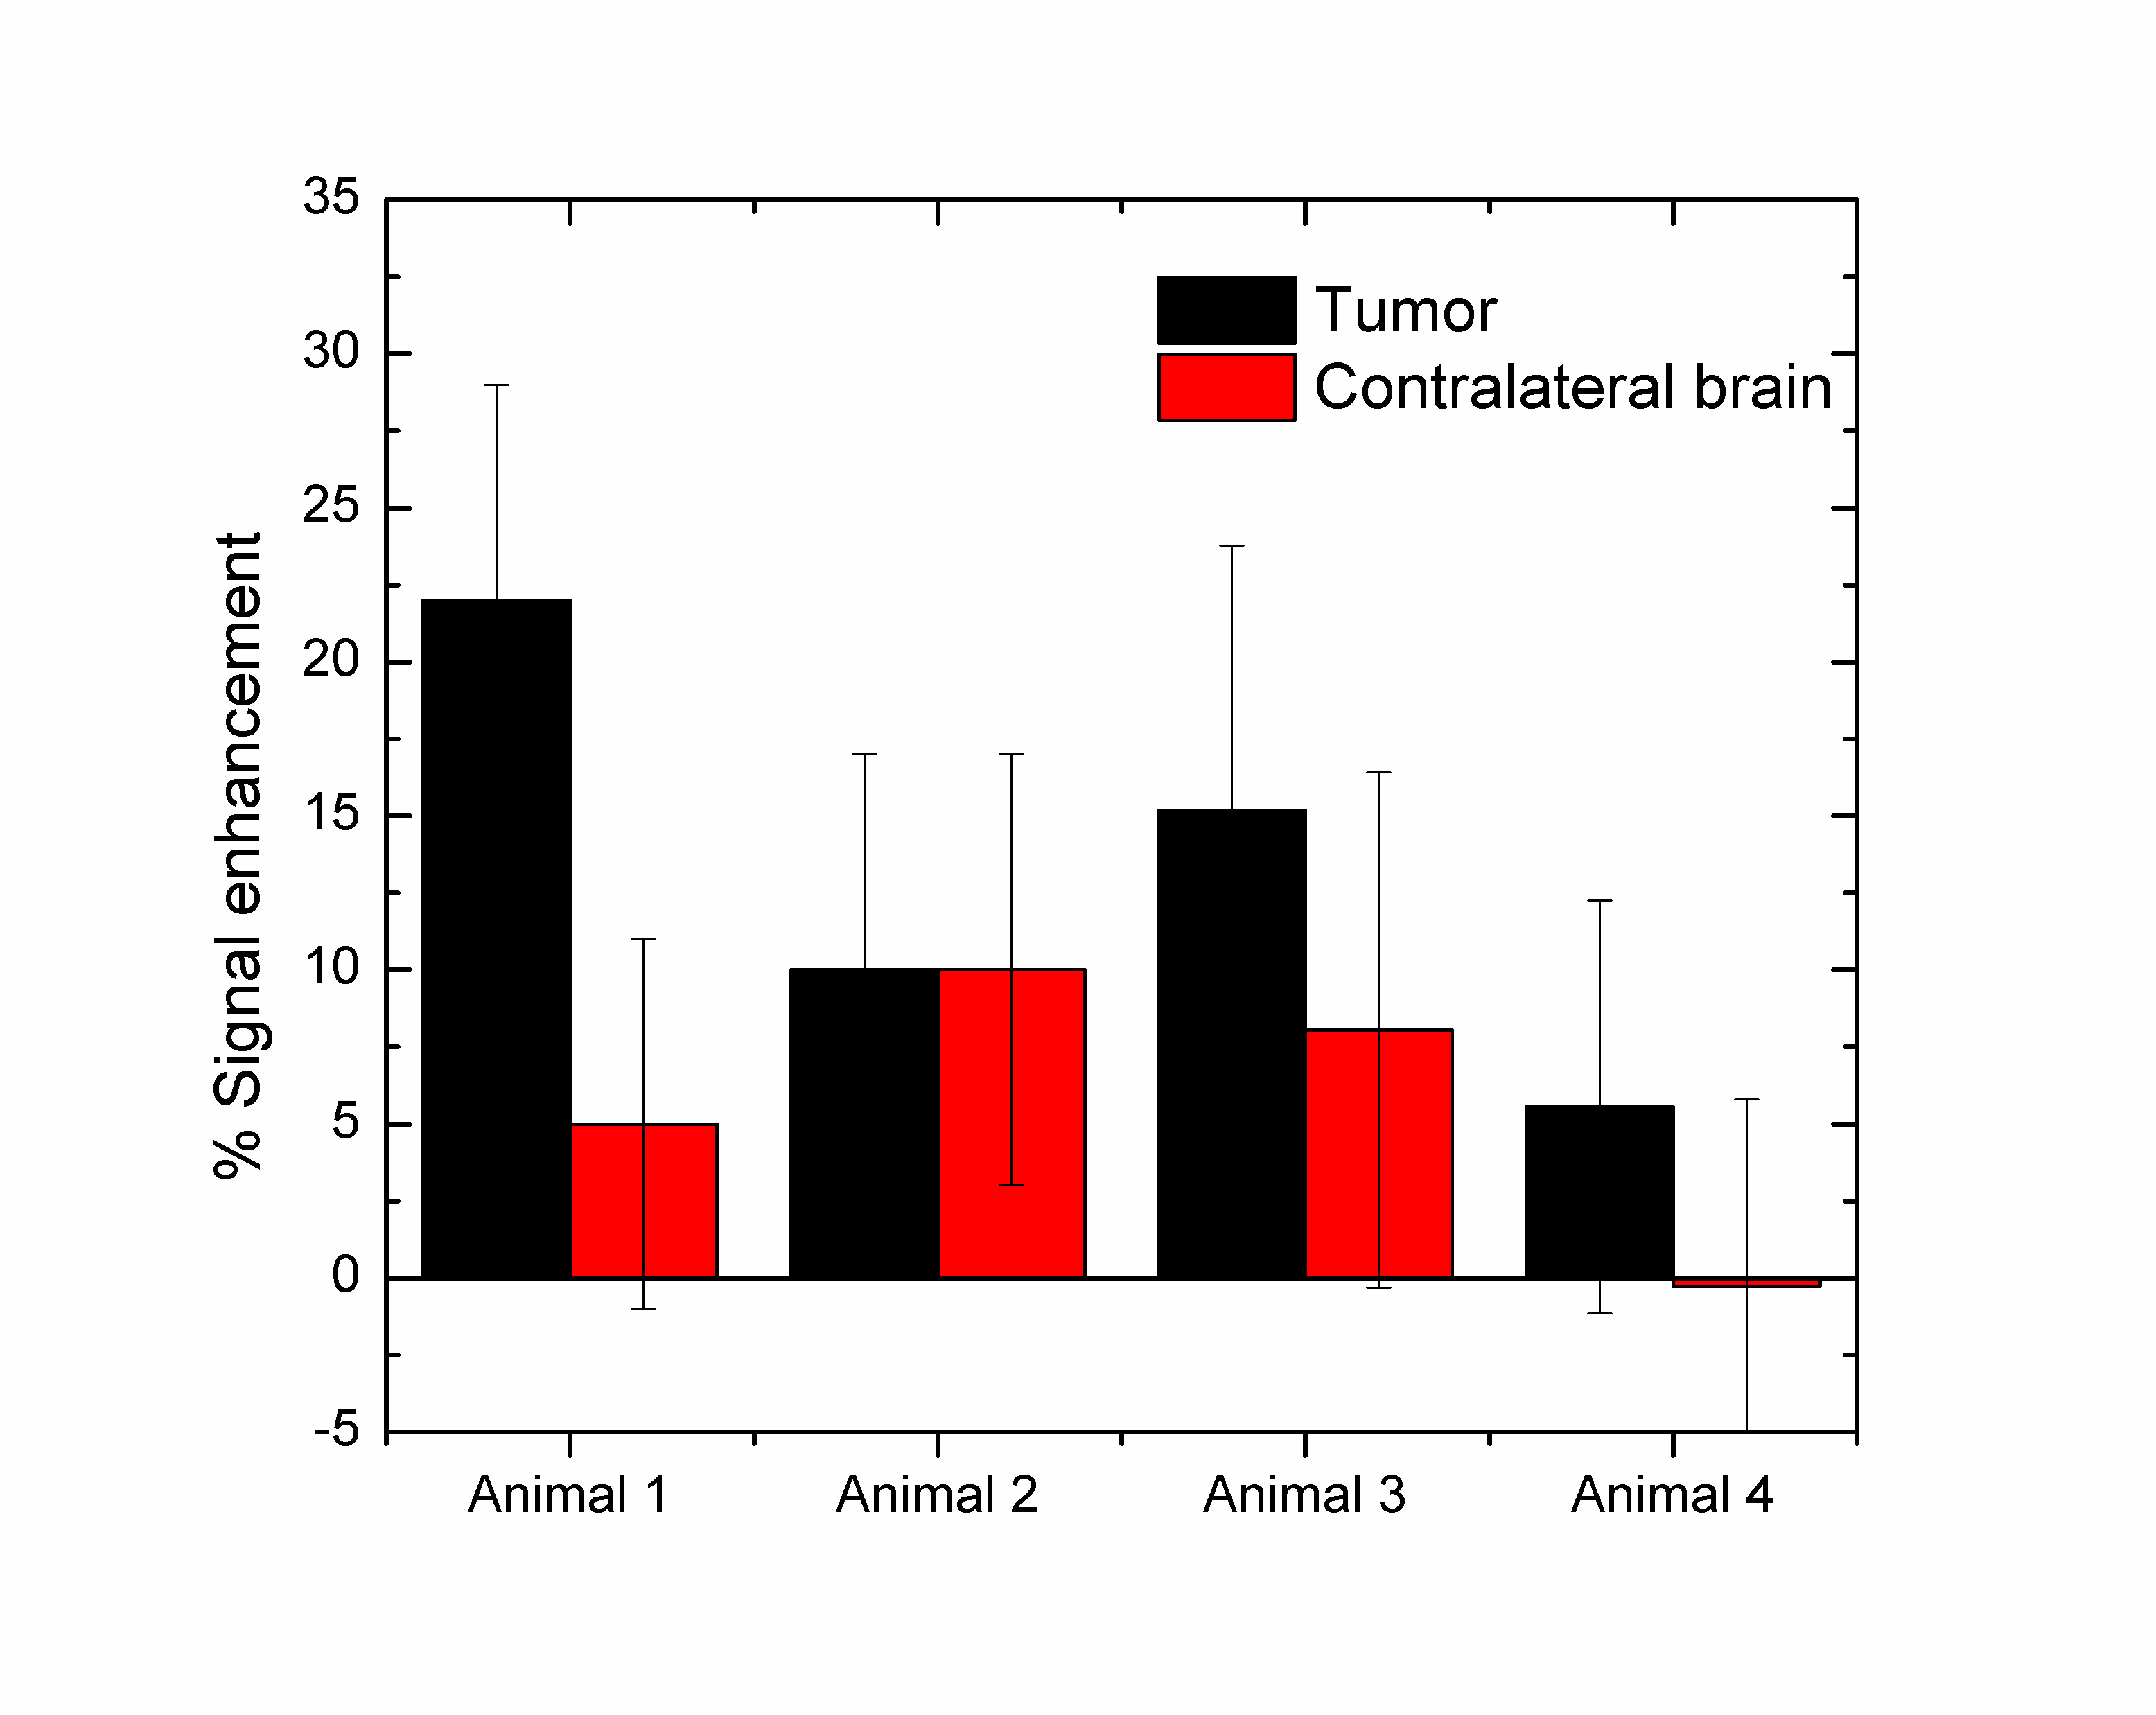
In this study we have used the hypoxia-targeting MRI contrast agent GdDO3NI, (a nitroimidazole-based T1 contrast agent) to image the development of hypoxia in the rodent brain tumors at two different sizes. Our results indicate a range of signal enhancements from 5-20% over baseline in the 9L tumor using GdDO3NI with clearance from contralateral brain and muscle tissue. Furthermore the GdDO3NI enhancement correlates with PET imaging using hypoxia targeting 18F-FMISO and immunohistochemistry based on pimonidazole. This study further demonstrates the utility of GdDO3NI in non-invasive imaging of tissue hypoxia with high resolution.
Abstract
Introduction: Glioblastoma multiforme (GBM) is the most common and deadliest type of primary malignant brain tumor. A chronic hypoxic microenvironment in solid tumors, i.e. deficit of oxygen, leads to changes in tumor cell metabolism and upregulating pro-survival proteins which in turn increase angiogenesis, proliferation, invasion, and metastases1. The importance of hypoxia as a key factor in choosing therapy for patients, and personalized treatments has led development of imaging methods to assess tissue hypoxia. Here, we determined the tumor hypoxia in a rat orthotopic glioma model using GdDO3NI a nitroimidazole-based T1 contrast agent for MRI in dynamic contrast enhancement (DCE) method, which uses t a similar hypoxia-targeting moiety as 18-fluoromisonidozole (18F-FMISO) a hypoxia targeting tracer2 for positron emission tomography (PET). The hypoxia targeting contrast agent, GdDO3NI, had been synthesized as described previously3,4. We validated the results of DCE using 18 F-FMISO PET, and immunohistochemistry using pimonidazole staining of the excised tissue as the gold standard for detection of tissue hypoxia.MATERIALS AND METHODS: All animal studies were performed in accordance with Institutional Animal Care and Use Committee approved animal protocol. Female Fischer rats were inoculated with 9L as described previously 1. Imaging was performed after 25 days or more post implantation. PET images were acquired dynamically from 0 to 110 minutes simultaneously with bolus injection of 18F-FMISO. MRI was performed at 7 T with a preclinical MR scanner. Anatomical imaging was performed using a T2-weighted spin echo sequence with the following parameters: TR= 6.4s, TE= 50ms, averages= 4, matrix = 128x128, FOV=3.2cm×3.2cm, thickness = 1mm. The DCE study was performed using a FLASH sequence with TR=100ms, TE=2.5ms and a flip angle of 40 degree. After DCE experiment the animals were injected with 60mg/kg pimonidazole HCL and perfused one hour later with 4% PFA. Fixed tissue was sliced into 1mm coronal sections after ex vivo imaging. The tissue was cleared using a CUBIC (clear, unobstructed brain imaging cocktail) based protocol for 10 days, washed in 0.1M PB and incubated in a 1:50 dilution of FITC-MAb1 (Hypoxyprobe) in 0.1% PBTX for 2.5 days. Following antibody incubation tissue was placed in EasyIndex (LifeCanvas Technologies) and imaged using IVIS spectrum imaging system with excitation and emission spectrum wavelengths of 570/620nm for detecting Tdtomato (expressed in the stably transfected 9Ltumor cell line used) and 500/540nm for detecting FITC in hypoxic regions. Image registration and analysis was performed using built in-house algorithms with Matlab. Data analysis was performed on regions of interest (ROIs) drawn on MR images. Results are presented as means ± standard deviation for rats. Individual groups were statistically compared with t-test and results with p<0.05 were considered significant.
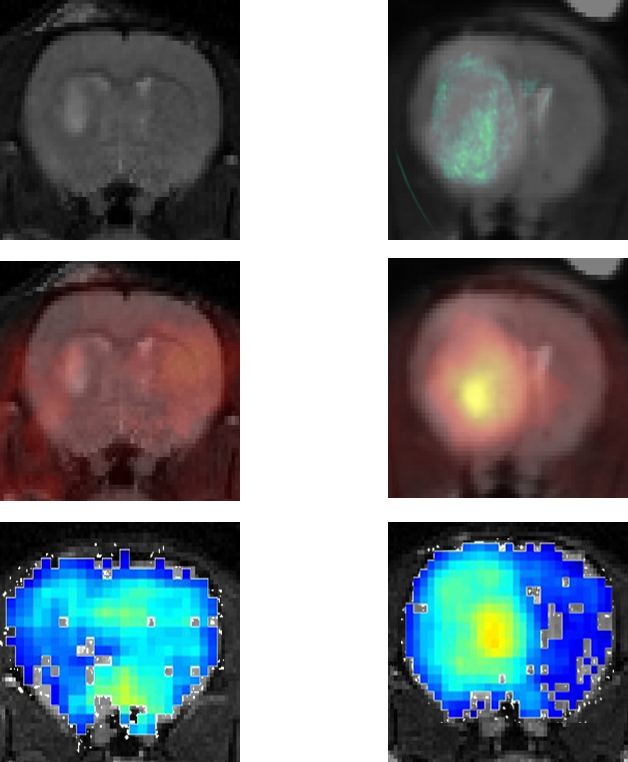
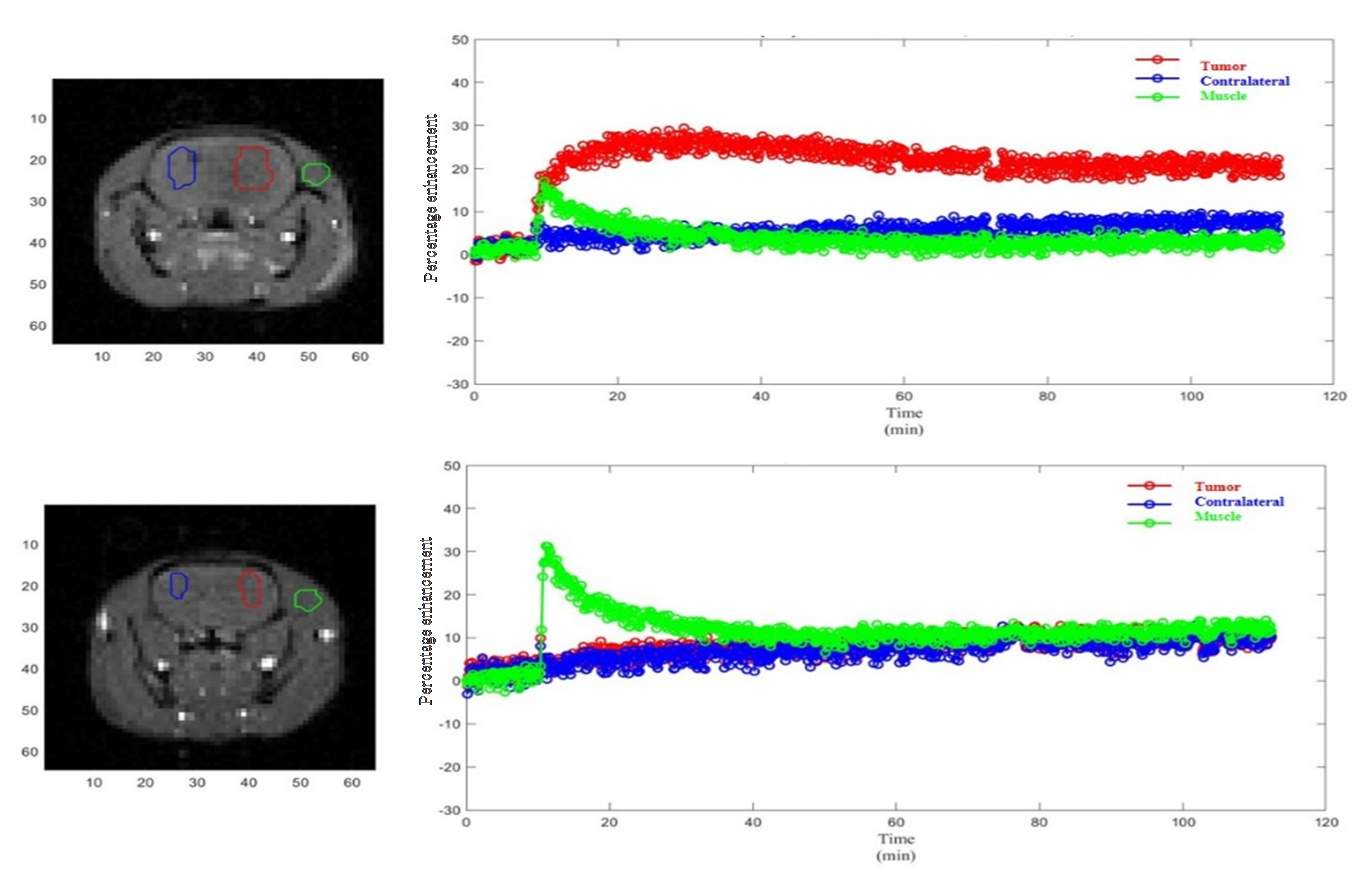
RESULTS: Fig. 1 shows the comparison between GdDO3NI contrast enhanced MR imaging, 18 F-FMISO PET and pimonidazole based IHC for representative small and big tumors and the overlay images with MRI anatomical for registration. The smaller tumor showed little to no hypoxia, consistent with the one of normal tissue1 while the large 9L tumor exhibits considerable hypoxia. In each case the MR results correlate well with PET and IHC. Fig.2 demonstrates the DCE results on the three different ROIs: tumor, contralateral brain, and muscle on the representative animals. ROIs analyses in Matlab were performed by measuring the percentage enhancement of intensity in T1 weighted images compared to the pre injection images. GdDO3NI washout from muscle and contralateral brain tissue is seen to be faster compared to the tumor especially for larger tumors. GdDO3NI is retained in tumors for significantly longer time, due to reduction of the nitroimidazole moiety and subsequently binding to the thiol proteins in the hypoxic regions.
CONCLUSION: In this study, we used dynamic GdDO3NI the MRI contrast agent to show hypoxia in 9L tumors. Although there are alternative hypoxia imaging methods available (eg, other PET tracers, electron paramagnetic resonance, and MRI), (15, 38-40), 18F-FMISO was chosen as verifying imaging method in this study because it shares the nitroimidazole-targeting moiety with GdDO3NI. Overall the MR results correlated well with the PET and IHC data for the same tumor. The results also showed that the severity of hypoxia is dependent on tumor size in the 9L tumor model. Pharmacokinetic modeling of the data may allow us to characterize the tumor microenvironment quantitatively and enable simultaneous assessment of perfusion and hypoxia parameters in tumors.
Acknowledgements
No acknowledgement found.References
1. Stokes AM, Hart CP, Quarles CC. Hypoxia Imaging With PET Correlates With Antitumor Activity of the Hypoxia-Activated Prodrug Evofosfamide (TH-302) in Rodent Glioma Models. Tomography. 2016;2(3):229-237. 2. Bruehlmeier M, Roelcke U, Schubiger PA, Ametamey SM. Assessment of Hypoxia and Perfusion in Human Brain Tumors Using PET with 18F-Fluoromisonidazole and 15O-H2O. 2004;45(11):1851-1859. 3. Rojas-Quijano FA, Tircsó G, Tircsóné Benyó E, et al. Synthesis and Characterization of a Hypoxia-Sensitive MRI Probe. Chemistry – A European Journal. 2012;18(31):9669-9676. 4. Gulaka PK, Rojas-Quijano F, Kovacs Z, Mason RP, Sherry AD, Kodibagkar VD. GdDO3NI, a nitroimidazole-based T 1 MRI contrast agent for imaging tumor hypoxia in vivo. JBIC Journal of Biological Inorganic Chemistry. 2014;19(2):271-279.
Figures