4719
DTI-based Hemispheric Differences in Female 3xTgAD Mouse Model
David Hike1,2, Taylor Ariko1,2, Alina Stimmell3, Aaron Wilber3, and Samuel Colles Grant1,2
1Chemical & Biomedical Engineering, Florida State University, Tallahassee, FL, United States, 2CIMAR, National High Magnetic Field Laboratory, Tallahassee, FL, United States, 3Psychology, Florida State University, Tallahassee, FL, United States
1Chemical & Biomedical Engineering, Florida State University, Tallahassee, FL, United States, 2CIMAR, National High Magnetic Field Laboratory, Tallahassee, FL, United States, 3Psychology, Florida State University, Tallahassee, FL, United States
Synopsis
This study utilizes DTI and graph theory as a method for early detection of structural changes inconnectivity related to Alzheimer’s Disease. As a function of phenotype and age, DTI analysis was implemented on 3xTgAD female mouse brains and wild type controls at 11.75-T. Current hemisphere dependent data shows differences between hemispheres within the age and phenotype for the parameters observed.
Purpose
Alzheimer’s Disease (AD) is the most common form of dementia, characterized by memory loss, changes in behavior, and cognitive difficulties1. The 3xTgAD mouse model produces Tau proteins in addition to amyloid precursor protein (APP) and presenilin-1 (PS1). These mice also begin showing memory deficiencies around 4 months (2 months before plaques and 8 months before Tau); therefore, structural alterations are potentially instituted prior to hallmark deposition2. Clinically, MRI is used to diagnose AD by means of volumetrics, mainly focusing on hippocampal atrophy3.In this study, Diffusion Tensor Imaging (DTI) and graph theory were implemented longitudinally in order to explore structural changes in connectivity across hemispheres as a function of age. Herein, 3xTgAD alterations were compared to data acquired previously using 5xFAD mouse models to verify the robustness of the technique.
Materials & Methods
Preserved ex vivo female mouse brains (4% PFA) expressing the 3xTgAD phenotype and wild type (WT) brains that span a corresponding range of ages were studied using DTI. Brains were harvested between 1-10 months and washed in PBS for 24 h prior to immersion in Fluorinert (3M, Corp) within a 10-mm glass NMR tube for scanning. Using an 11.75-T (500-MHz) magnet, DTI was implemented with a multi-slice, diffusion-weighted 2D spin-echo sequence that utilized 18 diffusion encoding directions (nominal b = 400 s/mm2) and four unweighted acquisitions for which Δ = 11 ms and δ = 3 ms with 15 averages. Brains were scanned individually with a TE/TR = 30/2000ms with a resolution of 100x100x500 µm and acquisition matrix size of 95x95 over a scan time of ~17 h. DTI datasets were analyzed using DSI Studio to reconstruct tracts4 using the following parameters: FA ≥ 0.1, Angular threshold ≤ 60◦, Seeds ≤ 106, min tract length = 1 mm, max tract length = 25 mm. Regions of interest (ROI) were selected as 14 equally spaced ellipsoids in the cortical regions and two ROI for each right and left side of the hippocampus. The segmented nodes were categorized into four neural regions: Piriform, Temporal, Parietal and Hippocampus and were split into left and right hemispheric regions. Tract counts were imported into Gephi for extracting graph properties including: Degree & Weighted degree, Clustering Coefficient, Closeness (Betweenness, Closeness, Eigenvector & Harmonic), and Eccentricity. One-way ANOVA and least significant difference post-hoc tests were used to determine statistical significance among samples (p<0.05).Results & Discussion
Hemispheric and phenotypic differences are observed in the Piriform region for Betweenness Centrality (Figure 1), which quantifies the number of times a node acts as a bridge along the shortest path between two other nodes. In the 3xTgAD model, the right hemispheric Piriform region increases with age to a much greater extent than the left hemispheric Piriform region, which stays relatively constant. In WT, the opposite pattern is observed, the left hemispheric Piriform region decreases with age to a greater extent than the right hemispheric Piriform region. Notably, the scale differences across phenotype are drastically different, potentially due to synaptic degeneration.Temporal hemispheric and phenotypic differences are not observed for closeness centrality; however, a general decrease for the highest age is observed in both 3xTgAD and WT samples with no hemispheric differences with age.Because Closeness Centrality is the sum of the shortest path lengths from one node to all other nodes, its decreasing trend with age may reflect the paring of neural connections during maturation; however, Closeness Centrality also may highlight differential time courses or connection remodeling for the AD versus WT specimens.
Clustering coefficient in the Temporal region and Closeness Centrality in the Piriform region shows a decrease in AD over age while WT samples tend to remain fairly constant, which could indicate a loss of direct nodal connections leading to a lengthening of the shortest path with respect to Closeness or neural pairing with respect to Clustering (Figures 2&3).
Hemispheric differences manifest in the Temporal and Piriform regions of the AD models when looking at Clustering Coefficient and Closeness Centrality (Figure 4&5). Here the hemispheric regions show large decreases over time when compared over the right hemispheric regions. It is important to note that decreases are occurring after the onset of plaques but before the presence of Tau, indicating that Tau may not be responsible for brain alterations.
Conclusion
Referencing parameters obtained via DTI to graph theory analysis, this method can detect the loss of connectivity and network efficiency (even with hemispheric differences) during progression of AD pathology, with possible extension to other neurodegenerative diseases. Certain metrics are more useful than others in determining phenotype and hemispheric differences. Future work will extend this study by incorporating male data to investigate sex differences. Additionally, this work will help to expand the application of DTI and network theory to identification and progression of other neurodegenerative diseases.Acknowledgements
This work was supported by the User Collaborations Grant Program at the National High Magnetic Field Laboratory, which is supported by the National Science Foundation (DMR-1644779) and the State of Florida, and by the NIH (R01-NS102395 & R00-AG049090).References
- U.S Department of Health & Human Services.www.alzheimers.gov.
- Tang, X., Qin, Y., Wu, J., Zhang, M., Zhu, W., & Miller, M. I. 2016. Shape and diffusion tensor imaging based integrative analysis of the hippocampus and the amygdala in Alzheimer's disease.Magnetic resonance imaging.34(8):1087-1099.
- Lee JE, Han PL. An update of animal models of Alzheimer disease with a reevaluation of plaque depositions. Exp Neurobiol. 2013;22(2):84–95. doi:10.5607/en.2013.22.2.84
- Yeh F, Verstynen TD, Wang Y, Fernández-Miranda JC, Tseng WI. 2013. Deterministic diffusion fiber tracking improved by quantitative anisotropy. PLoS One. 8(11): e80713.
Figures
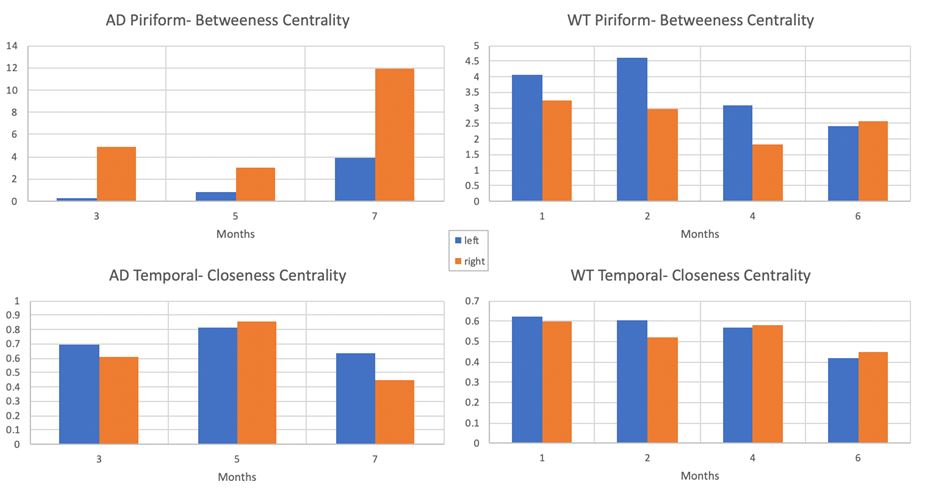
Trends in Betweenness Centrality and Closeness
Centrality are shown in the Piriform and Temporal regions of 3xTgAD transgenic
and wild type female mouse models at specified ages. Increases are seen in the Betweenness
centrality of the transgenic piriform region. Left (blue) and right (orange)
hemispheric differences are evident for Betweenness but not Closeness Centralities.
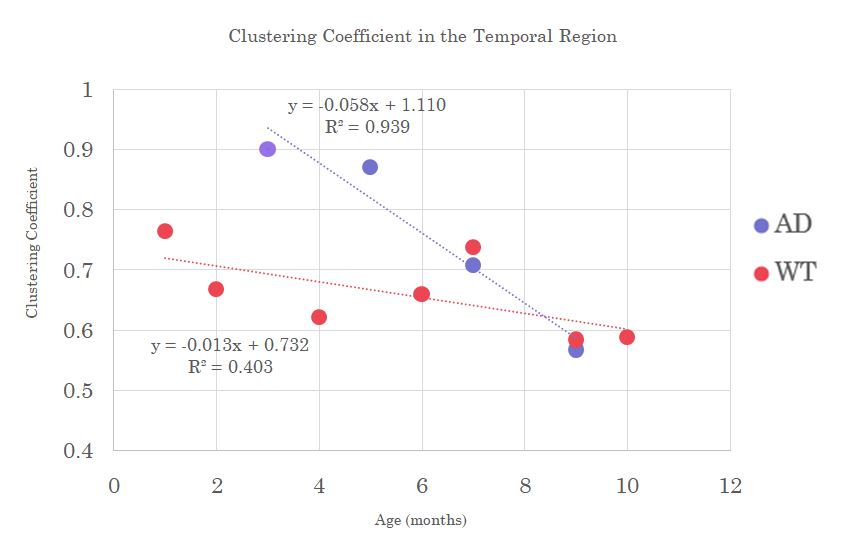
Clustering
in the Temporal region shows a steeper decreasing trend in the AD model with
age compared to only a slight decrease in wild type. A decrease in Clustering
with age may reflect normal aging-related neural paring but is accelerated and
compounded by inter-connectivity losses due to AD pathology.
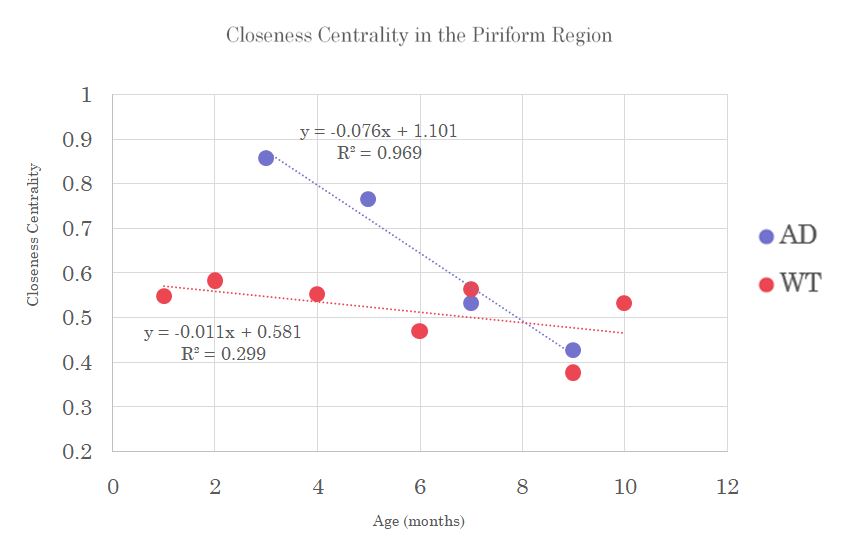
Closeness
Centrality in the Piriform region shows a decreasing trend in the AD model
while constant in wild type controls with age. A decreasing Closeness Centrality
suggests increases in shortest path lengths between nodes. Though displaying
higher closeness than wild type at younger ages, AD demonstrates decreases that
reflect a loss of direct nodal connections, leading to lengthening of the
shortest path with pathology.
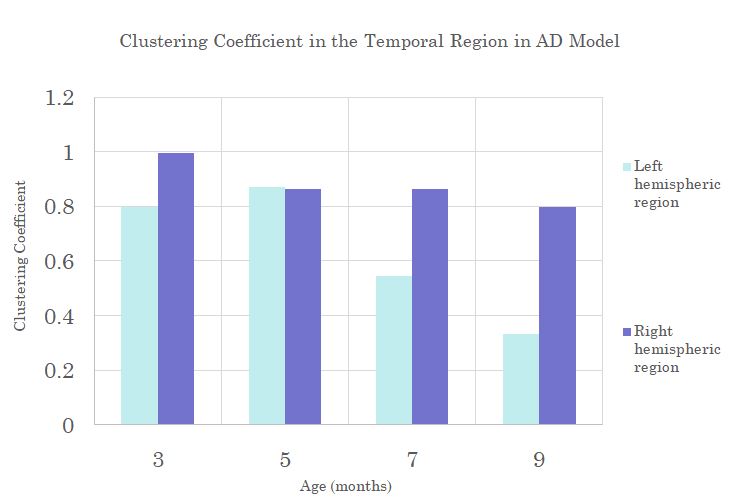
Clustering
Coefficient in the left Temporal region shows a steeper decreasing trend with
age compared to the right side for the AD model.
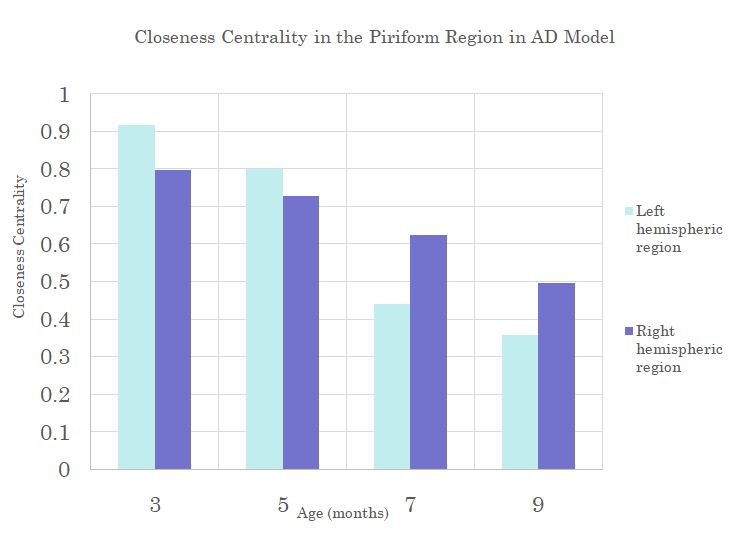
Rate of change in Closeness
Centrality in the left Piriform region shows a steeper decrease with age than
the right side for the AD model.