4717
Microstructures and metabolites during HIV-1 infection of humanized microglia mice revealed by MRI and MRS
YUTONG LIU1, Saumi Mathews2, Ed Makarov2, Lili Guo2, Mariano Uberti1, Balasrinivasa Sajja1, Larisa Poluektova2, Howard Gendelman2, and Santhi Gorantla2
1Radiology, University of Nebraska Medical Center, Omaha, NE 68198, NE, United States, 2Pharmacology and Experimental Neuroscience, University of Nebraska Medical Center, Omaha, NE 68198, NE, United States
1Radiology, University of Nebraska Medical Center, Omaha, NE 68198, NE, United States, 2Pharmacology and Experimental Neuroscience, University of Nebraska Medical Center, Omaha, NE 68198, NE, United States
Synopsis
In this study, we performed DTI and MRS on a newly created mouse model of brain HIV infection. MRS results showed neuronal damage on hippocampus, and DTI showed diffuse neuroinflammation caused by HIV infection. White matter changes was also observed using DTI.
Introduction
Neurological deficits commonly follow progressive human immunodeficiency virus (HIV) infection. A principal biomarker that has successfully tracked the onset and progression of those deficits is magnetic resonance imaging (MRI) in human and animal disease models (1, 2). In prior works changes in diffusion tensor imaging (DTI) were shown coordinate with immunohistochemistry in demonstrating inflammatory responses linked to HIV-associated neuronal damage. N-acetyl aspartate (NAA) and creatine measured using magnetic resonance spectroscopy (MRS) correlated with neuronal and glial impairments. To extend these works a novel mouse model of neuroHIV was created that contains the principal human virus target cell, the microglia. These animals express the human IL-34 through a cytomegalovirus promoter and following hematopoietic stem cells (HSC) transplantation both lymphoid and brain tissues are humanized (3). DTI and MRS studies were performed on these mice following HIV infection to determine the extent of neural injuries that best reflect the human conditionMaterials and Methods
NOD.Cg-PrkdcscidIl2rgtm1SugTg(CMV-IL34)1/Jic (NOG-hIL34) mice were intrahepatically transplanted at birth with human umbilical cord blood CD34+ hematopoietic stem cells. Reconstitution of the human immune system was confirmed by flow cytometry performed on the peripheral blood. At 5 months of age mice were infected intraperitoneally with HIV-1BAL and plasma viral loads were measured at 12 weeks. Viral levels ranged from 105 to 106 HIV RNA copies/ml. MRI was performed on 6 control uninfected and 4 infected mice using a 7 Tesla ParaVison 6.01 small animal scanner (Bruker PharmaScan 70/16, Billerica, MA). A Bruker made mouse head quadrature RF coil was employed. Respiration and body temperature were monitored. Single voxel localized spectra were acquired on the cerebral cortex, hippocampus and cerebellum using semiLaser sequence. DTI measures were acquired using 4-segment spin-echo echo-planar imaging with 12 diffusion and b = 800 s/cm2. MRS data were expressed as a percentage of the sum of all metabolites. Apparent diffusion coefficient (ADC) and fractional anisotropy (FA) were calculated using DiffusionToolkit (http://trackvis.org/dtk/) and measured on cortex, hippocampus, cerebellum, hippocampus, striatum and thalamus by brain subregion analysis.Results
NAA levels were reduced in the hippocampus of infected mice as compared to controls (Figure 1). ADC increased in infected mice in the cortex, hippocampus, hippocampus, striatum and thalamus (Figure 2B). FA increased on cerebellum and striatum (Figure 2B).Discussion
Measurements of NAA, ADC and FA demonstrate that these infected mice show critical parallel imaging biomarkers common during human HIV infections. For example, hippocampal NAA reductions supports the types of neuronal dysfunction and consequent memory loss that is seen commonly in this brain subregions during progressive viral infection. Increased ADC reflects diffuse neuroinflammation. Increased FA in infected mice that suggests white matter abnormalities that follow viral infection. These results begin to unravel key neuropathobiological features of microglial infection that can be followed through sensitive bioimaing techniques.Acknowledgements
This study was partially supported by NIH P01 DA028555, R21 DA041018, R24 OD018546, R01 AG043540.References
1. Boska et al. Molecular Neurodegeneration 2014.
2. Bade et al. Mol Neurobiol. 2016.
3. Mathews et al. Molecular Neurodegeneration 2019.
Figures
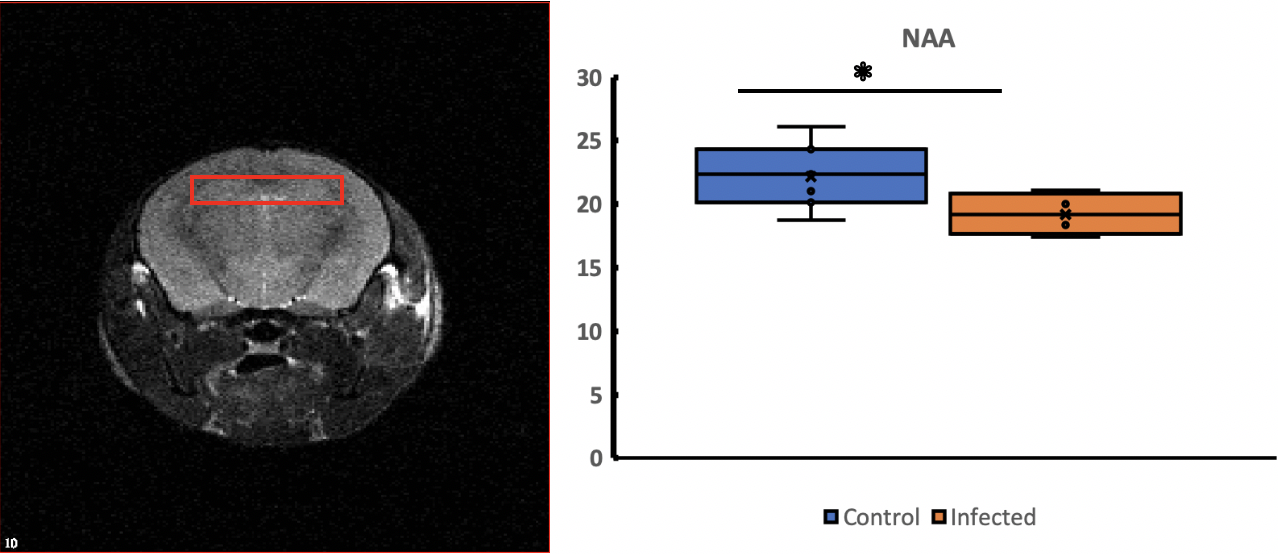
Figure
1. Single voxel
MRS on hippocampus showed lowered NAA in HIV-infected mice. Left figure shows
the location and size of the MRS voxel. Right figure shows the NAA percentage
concentrations in control and infected mice. *: p < 0.05
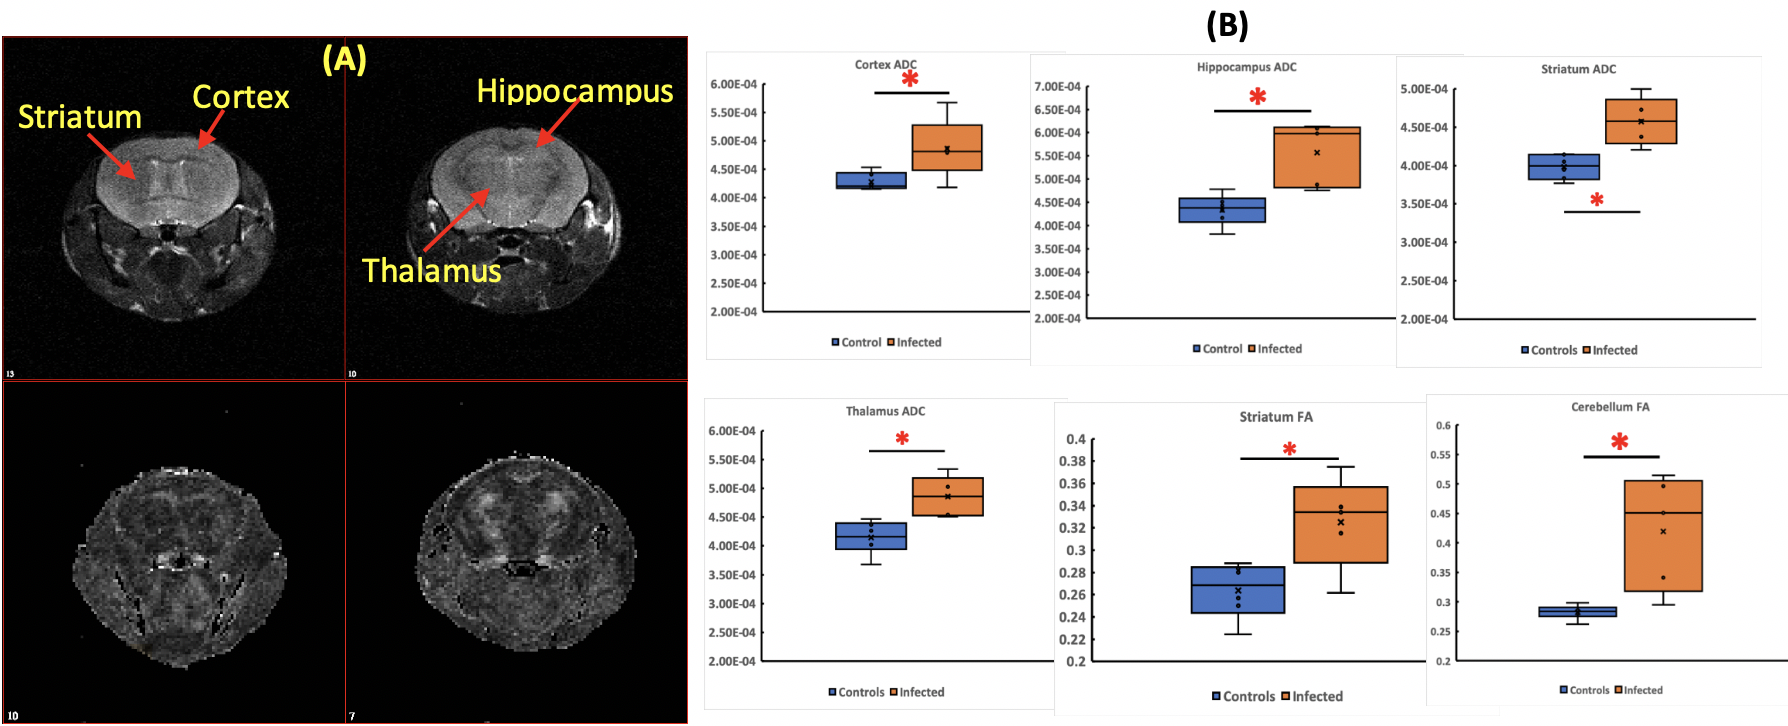
Figure
2. DTI metrics
(ADC and FA) of HIV-infected mice. (A) T2-weighted images (top) as an
anatomical reference and the FA map of a HIV-infected mouse (bottom). (B) ADC
increased on cortex, hippocampus, striatum, and thalamus in infected mice. FA
was found increased on striatum and cerebellum. *: p < 0.05