4716
CEST MRI Detects Early Signal Changes in the Lumbar Spinal Cord of ALS SOD1 Mice1Russell H. Morgan Department of Radiology and Radiological Science, Johns Hopkins University School of Medicine, Baltimore, MD, United States, 2Institute for Cell Engineering, Imaging Section and Vascular Biology Program, Johns Hopkins University School of Medicine, Baltimore, MD, United States
Synopsis
In amyotrophic lateral sclerosis (ALS), genetic abnormalities damage motor neurons, resulting in rapidly-progressing neurodegeneration, muscle wasting, and irreversible disability. Current imaging strategies (T2w, DTI, fMRI) monitor structural changes to motor neurons. Here, we investigated continuous wave chemical exchange saturation transfer (CEST) MRI to monitor molecular changes resulting from these abnormalities as a potentially complementary imaging biomarker for monitoring ALS disease progression.
Introduction
In amyotrophic lateral sclerosis (ALS), genetic abnormalities cause oxidative stress in motor neurons and astrocytes that ultimately results in neurodegeneration, muscle wasting, cognitive decline, and irreversible disability1,2. The difficulty of diagnosing ALS using conventional MRI methods (T1w, T2w, PDw) has prompted the exploration of novel imaging methods3. Many of these genetic abnormalities are associated with metabolic changes1,4. We investigated the utility of conventional (T2w) and metabolite-sensitive continuous wave chemical exchange saturation transfer (cw CEST) MRI methods to monitor changes in the lumbar spinal cord as disability progressed in a SOD1 G93A transgenic mouse model of ALS.Methods
ALS model: We used the SOD1 G93A mouse model (Jackson laboratories, #2726, N=6), which is characterized by progressive paralysis that typically starts around day 90 and subsequently rapidly progresses. Age-matched wild-type (WT) littermates (N=6) were included as controls.MRI: Mice were imaged at the L2 region of the spinal cord 60, 90, and 120 days (±4 days) after disease induction using a horizontal bore Biospec 11.7T scanner with a 72-mm volume transmit coil and a 15 mm 1x8 phase array surface receiver coil. A slice thickness of 0.7 mm was used to locate the lumbar region. A slick thickness of 2 mm was used to measure MRI signal using the following imaging parameters. T2w MRI: TE/TR=20.5 ms/2 s and rare factor=8 with a single average and repetition. CEST MRI: TE/TR=11.15 ms/5 s, saturation time=3 s, B1=1 μT and rare factor=23 with a single average and 42 repetitions. For CEST maps, the average magnetization transfer asymmetry at several commonly-investigated frequency ranges centered at 1.2 and 3.6 ppm (±0.4 ppm) from water were analyzed.
Statistics: Significance (p<0.05) at each time-point was evaluated using a Student’s t-test.
Results
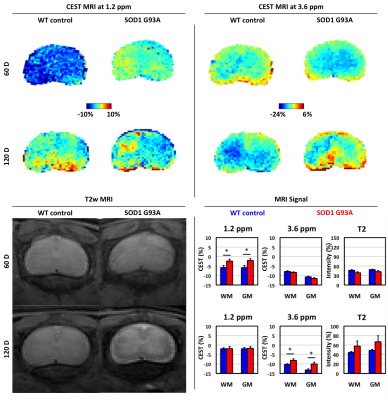
We evaluated the changes in endogenous CEST signal in the lumbar spinal cord as disease progressed in the ALS mouse model (Figure 1). At 60 days, paralysis was not yet observed. T2w MRI signal in the grey and white matter region was similar in ALS and WT mice. The CEST MRI signal at 1.2 ppm was higher in ALS mice than the WT mice, both in the grey and white matter. The CEST MRI signal at 3.6 ppm was equivalent between the two groups. At 120 days old, paralysis symptoms were observed in all ALS mice. The grey and white matter regions in T2w MRI were more distinct in 5 of 6 ALS mice, although the intensity of each region did not significantly differ between the two groups. The CEST MRI signal at 1.2 ppm was equivalent between the two groups. Interestingly, the CEST MRI signal at 3.6 ppm was higher in ALS mice than the WT mice at this time point.Discussion and Conclusion
The use of CEST MRI at 1.2 ppm and 3.6 ppm frequencies has potential as a complementary imaging biomarker for monitoring disease progression in ALS.Acknowledgements
This work was funded by the NIH (R56NS098520, R01EB023647) and the TEDCO Maryland Stem Cell Research Fund (MSCRFF-3900).References
(1) Hardiman, O.; Al-Chalabi, A.; Chio, A.; Corr, E. M.; Logroscino, G.; Robberecht, W.; Shaw, P. J.; Simmons, Z.; van den Berg, L. H. Nat Rev Dis Primers 2017, 3, 17071.
(2) Brown, R. H.; Al-Chalabi, A. N Engl J Med 2017, 377, 162.
(3) Agosta, F.; Chio, A.; Cosottini, M.; De Stefano, N.; Falini, A.; Mascalchi, M.; Rocca, M. A.; Silani, V.; Tedeschi, G.; Filippi, M. AJNR Am J Neuroradiol 2010, 31, 1769.
(4) Valbuena, G. N.; Tortarolo, M.; Bendotti, C.; Cantoni, L.; Keun, H. C. Sci Rep 2017, 7, 50.
Figures
