4715
Characterization of cerebral metabolism in prodromal stage of disease progression in rat model of Alzheimer's disease1Physical Sciences, University of Toronto, Toronto, ON, Canada
Synopsis
Alzheimer’s disease (AD) has complex underlying mechanism associated with progressive decline in multiple aspects of brain functions. This work aims to characterize cerebral metabolic alteration in presymptomatic AD in terms of glucose uptake and β-hydroxybutyrate (βHB) concentration in hippocampus (HC) and entorhinal cortex (EC) of rat model of AD using MR imaging and spectroscopic techniques. Glucose uptake was significantly reduced in HC and trending toward decrease in EC with signs of elevated HC βHB concentration in AD transgenic rat when compared to metabolic markers in healthy subjects, demonstrating that metabolic alteration precedes onset of AD cognitive symptoms.
Introduction
Alzheimer’s disease (AD) is an age-related progressive dementia with complex interaction of multiple contributing factors, making our understanding of the disease and development of effective treatment options difficult. Despite this challenge, numerous clinically-relevant finding have been gathered from pathological characterization at various stages in the disease progression. In particular, AD pathologies in early stage of the disease are of significant interest since early biomarkers play important role in expanding our understanding of the disease. Having established that microvascular and neuronal dysfunction precedes AD clinical symptoms in an animal model of AD, we set out to characterize cerebral metabolism in presymptomatic AD using MR techniques that assess glucose uptake, ketone body concentration and resting perfusion in hippocampus (HC) and entorhinal cortex (EC).Methods
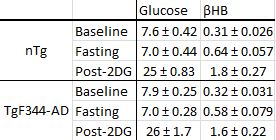
8.5-month-old transgenic rat model of Alzheimer’s disease on Fischer 344 background (TgF344-AD) was employed based on previous works that defined onset of cognitive deficits in this disease model 1,2. HC and EC of 20 rats (9 TgF344-AD and 11 age-matched homozygous non-transgenic (nTg) littermates) were studied using the imaging protocol put together for this project. The protocol included pseudo-continuous arterial spin labeling (pCASL) for resting perfusion and chemical exchange saturation transfer (CEST) with 2-Deoxy-d-glucose (2DG) infusion and magnetic spectroscopy (MRS) for relative estimation of glucose uptake and ketone body concentration, respectively. An oblique 1mm thick imaging slice that spans 20 x 20mm (64x64 matrix) to include hippocampus and entorhinal cortex in both hemispheres was chosen for maximal cross-sectional area of both regions. Resting perfusion imaging was facilitated with pCASL 3 where 32 labelled-control EPI pairs were acquired for each of nine PLDs from 0 to 1750ms with a TR/TE of 4000/11ms for a total scan time of 40 mins. Glucose uptake was inferred from intracellular accumulation of 2DG and its byproduct by examining dynamic CEST signals 4 (12 repetitions of offsets at 1.2, 2.0 and 2.9ppm) acquired after 2DG infusion. Sixty minutes of dynamic CEST signals for glucose uptake imaging at 1.6-minutes of interval on saturation offsets for hydroxyl groups in 2DG was normalized by 20-minute-long baseline signals. Lastly, single-voxel 1H MRS (point-resolved spectroscopic sequence) with TR/TE of 2500/16ms was performed on hippocampus. All MR procedures were performed on a 7T preclinical horizontal system (Bruker Biospec 70/30, Ettlingen, Germany) with a volume coil for transmission and a 20mm-diameter loop coil for reception. Animals fasted overnight prior to imaging for enhanced glucose uptake contrast. Blood glucose and β-hydroxybutyrate (βHB) concentrations were measured from venous blood sample using blood glucose and ketone monitoring system.Results
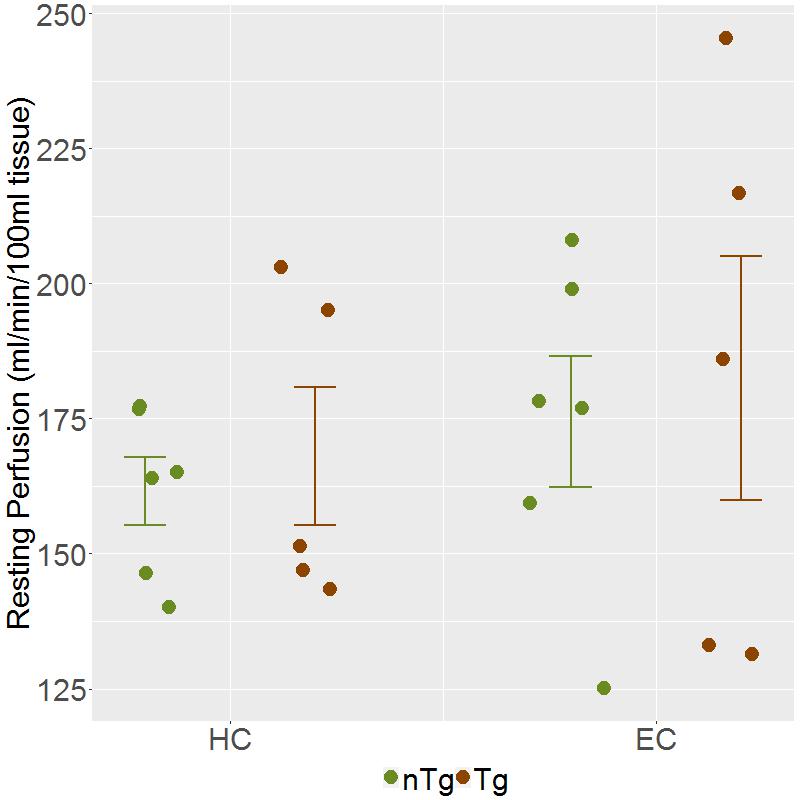
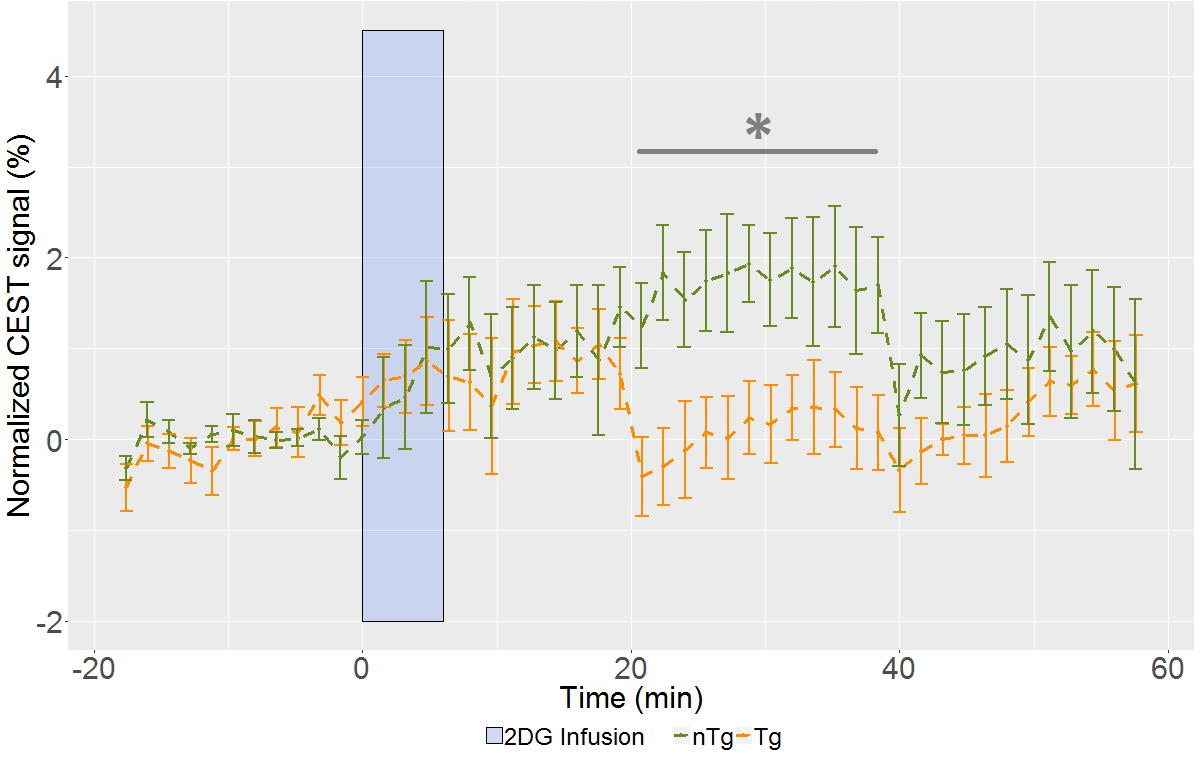
Overnight fasting resulted in 10% blood glucose reduction (Table 1) and 94% βHB increase from baseline levels which were indistinguishable between TgF344-AD and nTg rats. Post-2DG measurements of blood glucose and βHB concentration at the end of the imaging session showed drastic elevation in both glucose and βHB. Resting perfusions in TgF344-AD and nTg rats are plotted in Figure 1, showing that resting perfusions in HC (TgF344-AD: 156±16 ml/min/100ml tissue; nTg: 150±12 ml/min/100ml tissue; p = 0.8) and EC (TgF344-AD: 170±22 ml/min/100ml tissue; nTg: 159±18 ml/min/100ml tissue; p = 0.7) are not significantly different, indicating that the difference in glucose uptake is not being driven by the genotype-related difference in cerebral perfusion. Among the CEST data acquired around the 2DG infusion, HC signal acquired with 2ppm saturation offset (Figure 2) shows that the glucose uptake is significantly attenuated in TgF344-AD rats due to short-lived window of glucose uptake. While entorhinal cortex exhibited comparable trend in glucose uptake (not shown), smaller magnitude of signal rise with high inter-subject variability places limitation on interpretation of EC glucose uptake. CEST signals acquired at 2.9 and 1.2 ppm also resulted in smaller magnitude of response to 2DG infusion with similar trend in response onset and return to baseline compared to signals acquired at 2.0 ppm (not shown). Lastly, preliminary analysis of spectroscopy data from select rats showed βHB peaks that can be quantified to concentration that follows the trend reported with blood βHB measurements over the imaging session.Discussion
Present study details an MR protocol intended for regional assessment of cerebral metabolism, an important biomarker in healthy brain function. Methodologically, this work provides a use case where a combination of MR techniques results in an MR protocol conducive for preemptive assessment of neurodegeneration in clinic compared to existing techniques that are not suited for the purpose. Using the protocol, presymptomatic TgF344-AD rats are shown to exhibit significant metabolic attenuation in hippocampus deranged from normal metabolic rates observed in healthy subjects. This work reveals another concealed aspect of progressive deterioration in brain that is highly likely to be a factor in the neurodegenerative outcomes. Combined with previously established microvascular and neuronal dysfunction in this presymptomatic model of AD, 2 this study provides detailed account of brain function in the absence of cognitive symptoms.Conclusion
This preclinical study has shown that alterations in cerebral metabolism predate clinical symptom onset using transgenic rat model of AD. This alteration in cerebral metabolism in tandem with microvascular and neuronal dysfunction seen in early stage of the disease provides detailed depiction of cerebral function in presymptomatic state and supplements our pathoetiological understanding of the most common form of dementia.Acknowledgements
This study worked under the approval from the Animal Care Committee of the Sunnybrook Health Sciences Center, adhering to the Policies and Guidelines of the Canadian Council on Animal Care and meets all the requirements of the Provincial Statute of Ontario, Animals for Research Act as well as those of the Federal Health of Animals Act. Dr. Terrence Town and Dr. Tara M. Weitz provided breeding pairs of the successful development of TgF344-AD rat colonies used in this study.References
1. Cohen R, Rezai-Zadeh K, Weitz T, et al. A transgenic Alzheimer rat with plaques, tau pathology, behavioral impairment, oligomeric aβ, and frank neuronal loss. J Neurosci 2012; 33: 6245–6256.
2. Joo I, Lai A, Bazzigaluppi P, et al. Early neurovascular dysfunction in a transgenic rat model of Alzheimer’s disease. Sci Rep 2017; 7: 46427.
3. Parkes L and Tofts P. Improved accuracy of human cerebral blood perfusion measurements using arterial spin labeling: accounting for capillary water permeability. Magn Reson Med 2002; 48(1): 27-41.
4. Xu X, Chan K, Knutsson L, et al. Dynamic glucose enhanced (DGE) MRI for combined imaging of blood-brain barrier break down and increased blood volume in brain cancer. Magn Reson Med 2015; 74(6):1556-1563.
Figures