4714
Comparison of metabolic fluxes in the mouse dorsal hippocampus and hypothalamus using indirect 1H-[13C] MRS upon [1,6-13C2] glucose infusion
Antoine Cherix1, Bernard Lanz1, and Hongxia Lei2
1Laboratory for Functional and Metabolic, Ecole Polytechnique Fédérale de Lausanne, Lausanne, Switzerland, 2Animal Imaging and Technology Core (AIT), Center for Biomedical Imaging (CIBM), Ecole Polytechnique Fédérale de Lausanne, Lausanne, Switzerland
1Laboratory for Functional and Metabolic, Ecole Polytechnique Fédérale de Lausanne, Lausanne, Switzerland, 2Animal Imaging and Technology Core (AIT), Center for Biomedical Imaging (CIBM), Ecole Polytechnique Fédérale de Lausanne, Lausanne, Switzerland
Synopsis
With increased interests in understanding the hippocampal regulation of hypothalamic-pituitary-adrenocortical (HPA) axis, this study shows for the first time an in vivo comparison of metabolic fluxes in the mouse dorsal hippocampus and hypothalamus using indirect 1H-[13C] MRS upon [1,6-13C2] glucose infusion at 14.1T. This study provides foundation for investigating relevant evidence to the underlying mechanism of hippocampal regulation of HPA axis.
INTRODUCTION
The hippocampus plays a critical role in linking brain energetics and behavior typically observed in the response to stress. With increased interests in the hippocampus as a potential regulator of the hypothalamic-pituitary-adrenocortical (HPA) axis, the final common pathway in the stress response,1 differentiating glucose metabolism between dorsal hippocampus and hypothalamus may lay foundation for investigating potential mechanisms of HPA sensitivity regulation by the hippocampus.13C Magnetic Resonance Spectroscopy (MRS) has shown to be a very promising tool to study brain metabolism in vivo. Indirect carbon spectroscopy (1H-[13C] MRS) is a technique that allows measuring 13C-labelled metabolites with higher sensitivity.2 Recently, metabolic fluxes including TCA cycle in mouse hypothalamus were assessable using 1H-[13C] MRS upon infusion of [1,6-13C2] glucose at 14.1T.3
Thus we aimed to compare glucose metabolism of the mouse dorsal hippocampus and hypothalamus upon [1,6-13C2] glucose.
METHODS
Fourteen adult male C57BL/6 mice (25±2g) were scanned under isoflurane anesthesia (1-2%) in a horizontal 14.1T/26cm Varian magnet (Agilent Inc., USA). A homemade 1H surface coil in quadrature combined with a linear 13C coil was designed specificially for 1H-[13C] MRS. The bilateral dorsal hippocampus (2×6×1.5 mm3) and hypothalamus (2×2.7×2.2 mm3) were localized using a set of T2-weighted FSE images. Field inhomogeneity was adjusted using FASTMAP to reach a water linewidth <25Hz1. On the target VOI, localized indirect 1H-[13C] detection was applied using the full signal intensity BISEP-SPECIAL sequence (TE/TR=2.8/4000ms) together with OVS and water suppression.2,3 Glucose metabolism of both bilateral dorsal hippocampus (n=7) and hypothalamus (n=7) was evaluated upon a bolus of 99% enriched 20% (w/v) [1,6-13C2] glucose and followed by continuous infusion of 70% enriched 20% (w/v) [1,6-13C2] glucose up to 4 hours. Spectra were frequency corrected and summed (~5.5min of hippocampus and ~11min for hypothalamus) for LCModel quantification. Non-edited 1H MR spectra contain 1H resonances coupled to both 12C and 13C and thus can be quantified with a standard basis set for neurochemical profiles of mouse hippocampus.2,3 The 13C-editing spectra were quantified using another simulated basis set as previously.2,3 The fraction of isotope enrichment (FE) in lactate (Lac, LacC3), glutamate (Glu, GluC4), glutamine (Gln, GlnC4), the sum of Glu and Gln (Glx, GlxC3) and γ-aminobutyric acid (GABA, GABAC2 and GABAC3) was obtained. The FEs of plasma glucose (Glc), Lac and acetate (Ace) were measured on three mice with the identical infusion protocol without any MR measurements. All results were then fitted to a one compartment model of glucose metabolism (Figure 1) using MATLAB nonlinear regression methods.2,3 The cerebral metabolic rate of glucose (CMRg), tricarboxylic acid cycle (VTCA), a dilution flux from blood lactate (Vdilin and Vdilout) and from blood acetate (Vdilg), a transmitochondrial flux (Vx), apparent neurotransmission rate (VNT), pyruvate carboxylase flux (VPC), a Gln efflux (Veff), GABA flux (VGABA), and exchange between two GABA pools and two Gln pools (Vexg and Vexi) were estimated. Monte–Carlo simulation was used to evaluate the errors of all adjusted metabolic fluxes.2,3RESULTS AND DISCUSSION
Based on anatomical images with satisfactory quality, bilateral dorsal hippocampus and hypothalamus were clearly identified (Figure 2). The typical 1H-[13C] MR non-edited spectra of hippocampus (Figure 2a, SNRs=20±2, metabolic linewidths=18±2Hz) and hypothalamus (Figure 2b, SNRs=16±3, metabolic linewidths =17±2Hz) were obtained in jointly with edited spectra of both hippocampus (Figure 2c, SNRs=8.3±0.6) and hypothalamus (Figure 2d, SNRs=5.3±0.3) after 4 hours of [1,6-13C2] glucose infusion, showing clear metabolites labeling. For instance, 13C-coupled 1H resonances of LacC3, GABAC3, GluC3, GlnC3, GABAC2, GluC4, GlnC4, GlxC2, GlcC6 and AspC3 were clearly visible (Figure 2c and 2d).GlcC6 rose rapidly, nearly in a step-wise fashion, shortly reaching a plateau enrichment at 0.66±0.05 (0.69±0.09 in the first half an hour) for hypothalamus and at 0.78±0.06 (0.69±0.01 in the first half an hour) for hippocampus, respectively. In Figure 3, LacC3 also rose quickly and reached a plateau around 15min after the bolus, with FEs at 0.51±0.02 for hypothalamus and at 0.52±0.02 for hippocampus, After about 100-130 minutes of glucose infusion, Glu and Gln reached their perspective FE steady-states, i.e. 0.51±0.02 for GluC4 and 0.51±0.01 for GlnC4 in hypothalamus and different from 0.50±0.01 for GluC4 (p=0.004) and 0.46±0.02 for GlnC4 (p<0.0001) in hippocampus. FEs of hippocampal GlxC3 and GlxC2 were 0.42±0.02 and 0.35±0.02, while FEs in hypothalamus were 0.46±0.03 (p=0.001) and 0.34±0.03, respectively. FEs of AspC3 were 0.34±0.06 for hippocampus and 0.38±0.09 for hypothalamus. GABAC2 reached a plateau FE approximately at 150 min, 0.43±0.03 in hypothalamus and 0.42±0.03 in hippocampus. A stable FE of GABAC3 was reached only towards the end of the measurements, i.e. 0.36±0.03 in hypothalamus and 0.38±0.03 in hippocampus, respectively.
The averaged FE time courses of GlcC6, LacC3, GluC4, GlnC4, GlxC3 and GABAC2 and GABAC3 were reliably measured and therefore used for modeling (Figure 1). The resulting fits of time courses of 13C accumulation (Figure 3) are shown in Figure 4 and the fluxes are summarized in Table 1.
This study shows for the first time an in vivo comparison of metabolic fluxes in the mouse dorsal hippocampus and hypothalamus using indirect 1H-[13C] MRS upon [1,6-13C2]-glucose infusion. This study provides foundation for investigating relevant evidence to the underlying mechanism of hippocampal regulation of HPA axis.
Acknowledgements
This work was supported by the CIBM of the UNIL, UNIGE, HUG; CHUV, EPFL and Leenaards and Louis-Jeantet Foundations.References
- Smith SM, Vale WW. Dialogues Clin Neurosci. 2006;8(4):383–395.
- Xin LJ, Lanz B, Lei H and Gruetter R. J. Cereb. Blood Flow and Metab. (2015) 35, 759-765;
- Lizarbe B, Lei H, Duarte JMN, Lanz B, Cherix A and Gruetter R. Magn Reson Med. (2018) 80(3):874-884;
Figures

Figure 1. Scheme of the mathematical model used to describe 13C label
incorporation into cerebral metabolites during 13C labeled glucose
infusion. Abbreviations are the cerebral metabolic rate of glucose (CMRg),
tricarboxylic acid cycle (VTCA), a dilution flux from blood lactate
(Vdilin and Vdilout) and from blood
acetate (Vdilg), a transmitochondrial flux (Vx),
a neurotransmission rate (VNT), pyruvate carboxylase flux (VPC),
a Gln efflux (Veff), GABA flux (VGABA), and two GABA
pools (Vexg and Vexi).
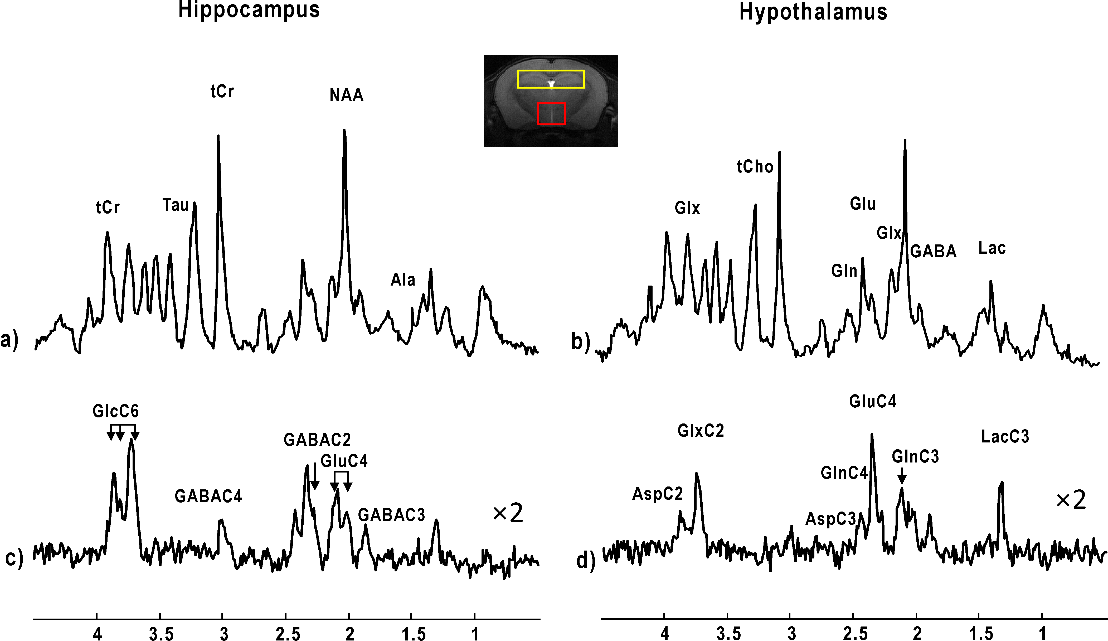
Figure 2. Typical 1H-13C MR non-edited (a, b) and edited (c, d) spectra of one of each
mouse hippocampus (yellow voxel, 1Hz Lorentzian apodization) and hypothalamus (red
voxel, 2Hz Lorentzian apodization). Abbreviations: Ala,
alanine; Asp, aspartate; Gln, glutamine; Glu, glutamate; Glx, glutamine +
glutamate; Tau, taurine; tCr, total creatine; GABA, γ-amino-butryrate acid; Lac, lactate; Glc,
glucose. Proton resonances bounding to
specific carbons are indicated by C and followed by the position number, e.g.
C2, C3 and C4 etc.

Figure 3. Time courses (in
minutes) 13C labelling of downstream brain metabolites from 13C
glucose in dorsal hippocampus (a) and hypothalamus (b).
In a), every
other edited 1H-[13C] MR spectra were displayed. All
spectra are displayed with 5Hz Lorentzian apodization.
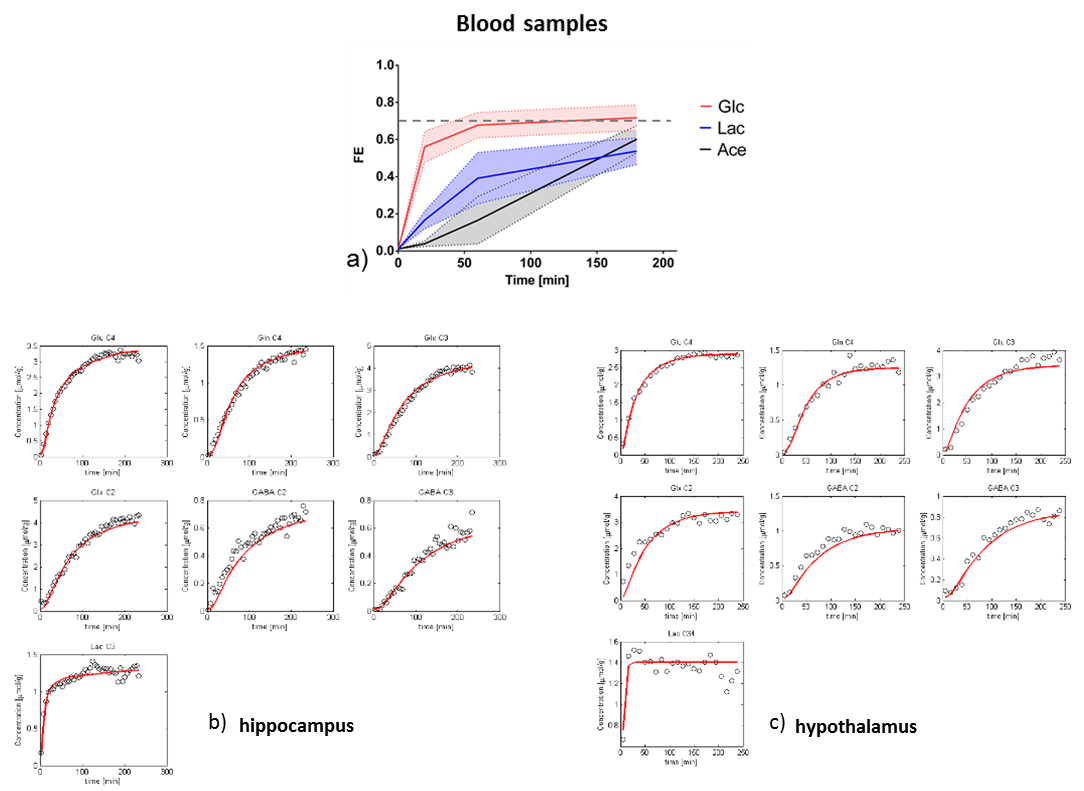
Figure 4.
FEs of blood Glc, Lac and Ace (a) and mathematical model fitting to the time
courses of 13C accumulation in both hypothalamus (b) hippocampus
(c). The fitting results are shown as in red curves (b and c) and estimated
metabolic fluxes are summarized in Table 1.

Table 1. Summary of metabolic
fluxes (µmol/g/min, mean ± SD) obtained after modelling and
the
Monte–Carlo simulation of variance. All metabolic fluxes were described in methods and
in Figure 1.