4713
Deuterium Metabolic Imaging (DMI) of glucose metabolism in mouse brain.1Dept. of Radiology and Biomedical Imaging, Yale University, New Haven, CT, United States
Synopsis
Deuterium Metabolic Imaging (DMI) is a novel approach providing high spatial resolution 3D metabolic data by combining 2H MRSI with administration of 2H-labeled substrates (1). Mapping of brain glucose metabolism has so far been focused on human and rat. Here we report the implementation of DMI for mapping of glucose metabolism in mouse brain. We described the dedicated radiofrequency coil, explore how different glucose administration approaches affect SNR, and illustrate mapping of glucose metabolism in a mouse model of glioblastoma.
Introduction
Deuterium Metabolic Imaging (DMI) is a novel approach providing high spatial resolution 3D metabolic data by combining 2H MRSI with administration of 2H-labeled substrates (1). DMI of brain glucose metabolism has so far been focused on human and rat brain. However, preclinical neurological research relies for a great part on mouse models of disease, which motivates implementing DMI for brain studies in mice. When DMI is used to map steady state 2H-labeling in downstream metabolites of glucose, different options for glucose administration are available. We explored both intraperitoneal (IP) infusion, and intravenous (IV) infusion via a tail vein catheter. IV infusion is the most efficient method to quickly attain high levels of labeled glucose in the blood. However, an IV infusion line is not always easy to establish in mice, and particularly challenging when repeated DMI scans are required. We explored how the SNR of 2H-labeled glutamate+glutamine (Glx), which is labeled via oxidative metabolism of 2H-glucose, is affected by IV and IP infusions. [6,6’-2H2]-glucose is most commonly used for DMI studies, and its metabolism leads to one unlabeled and one 2H-labeled pyruvate/lactate molecule per glucose molecule. Having a deuteron on the 1st carbon position of glucose results in two labeled trioses and would increase the SNR for detection of 2H-labeled lactate and Glx. We therefore explored the use of [1,2,3,4,5,6,6’-2H7]-glucose, and compared the difference in SNR for 2H-labeled Glx with [6,6’-2H2]-glucose infusions. Lastly, DMI was used to map 2H-lactate production in a mouse model of glioblastoma to illustrate the capability of DMI to visualize localized differences in 2H-glucose metabolism in mouse brain, in vivo.Materials and Methods
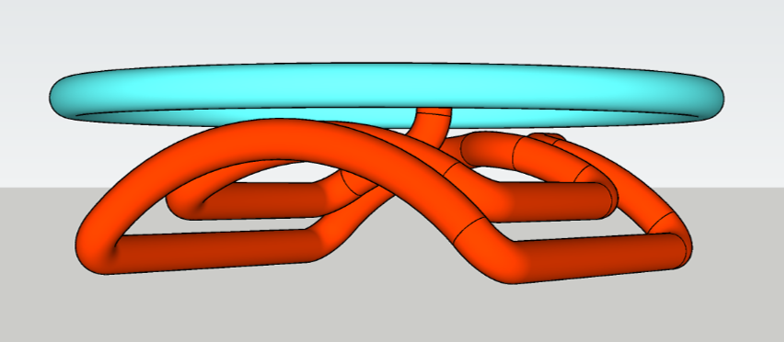
Healthy and glioma-bearing B6(Cg)-Tyrc-2J/J mice, (n=8) were studied. Glioma-bearing mice were generated by intracerebral injection of GL261 cells (100,000 cells), as described previously for rat glioma models (2). Glucose administration was performed via an infusion line placed in the lateral tail vein (IV), or in the lower right quadrant of the abdomen (IP). Solutions (1 M, in sterile water) of [6,6’-2H2]-glucose (“D2”) and [1,2,3,4,5,6,6’-2H7]-glucose (“D7”) (Cambridge Isotope Laboratories, MA, USA) were administered using a syringe pump (Harvard Apparatus, MA, USA), following a bolus-continuous infusion protocol, for both IV and IP infusions. DMI acquisition started at 90 min and 120 min following the start of the IV and IP infusions, respectively. All animal studies were performed on an 11.74 T Magnex magnet (Magnex Scientific Ltd.) interfaced to a Bruker Avance III HD spectrometer running on ParaVision 6 (Bruker Instruments), as described previously (1). A double-turn 2H radiofrequency (RF) coil was used, shaped to fit the head of mice, and sized (14x12 mm2) to cover the whole mouse brain, combined with a single turn 1H surface coil for shimming and MRI as illustrated in Fig. 1. DMI data were acquired at nominal spatial resolutions of 5 uL and 8 uL using a 11x11x11 matrix and FOVs of 18.8x18.8x18.8 mm3, and 22x22x22 mm3, respectively, with spherical k-space encoding. Using a TR of 400 ms and 8 averages, acquisition of 3D DMI dataset required ~36 min. All 1H MRI and 2H DMI data were processed in DMIWizard, a home-written graphical user interface in Matlab. Preliminary SNR analysis based on peak height of Glx in voxels located within the mouse brain was performed to reveal differences between 2H-labeled glucose types and infusion protocols.Results
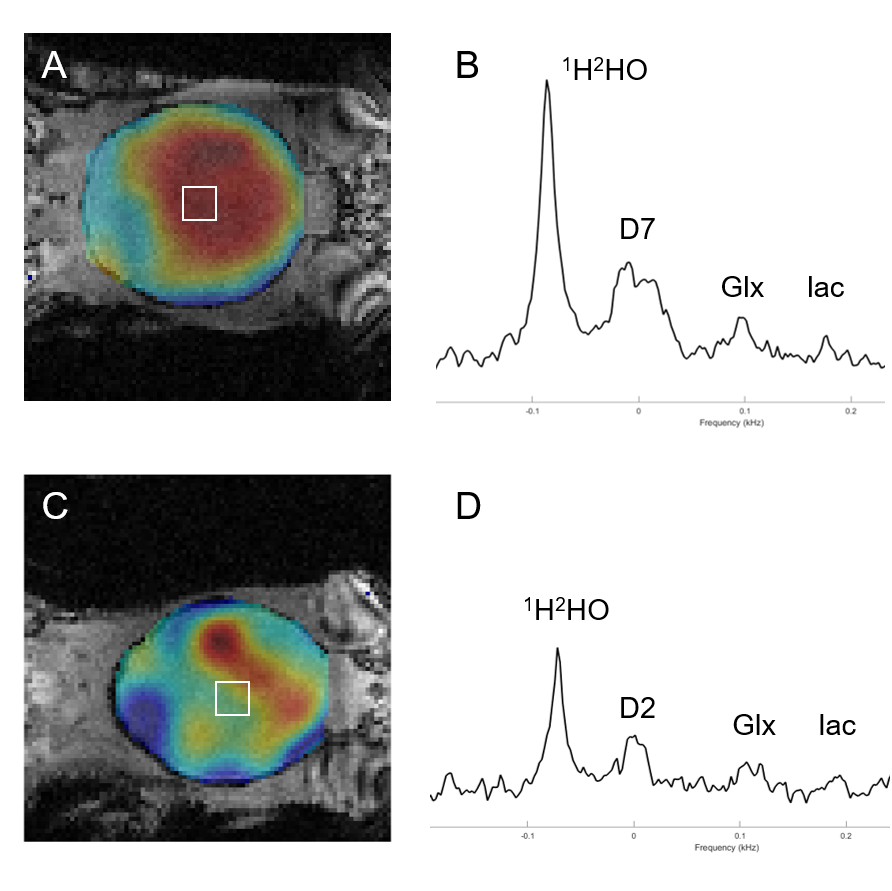
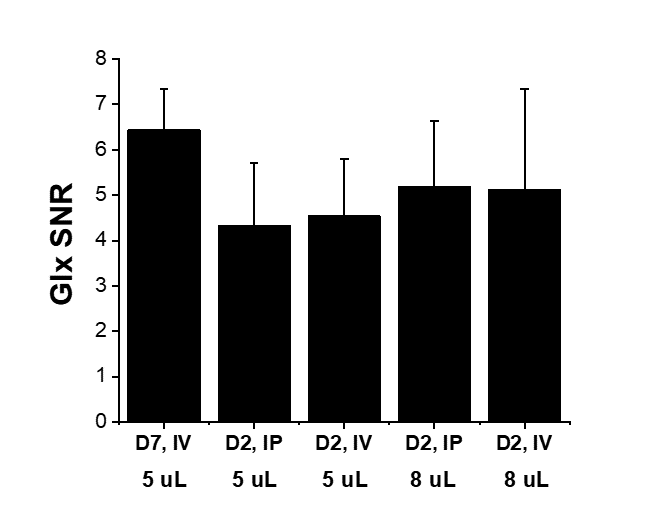
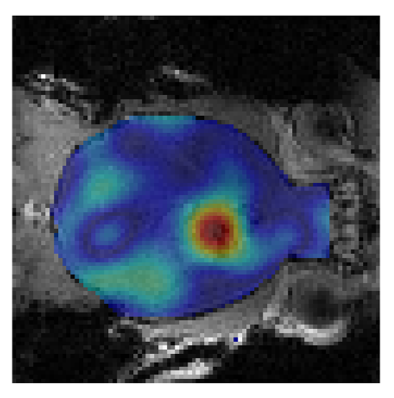
Figure 2 shows DMI-based metabolic maps of 2H-labeled Glx overlaid on coronal anatomical MR images, and examples of individual 2H MR spectra originating from the indicated 5 uL voxel. The data shown in Figure 2A were acquired 90 min after the start of IV infusion of D7-glucose. The data in Figure 2B were acquired 120 min after IP infusion of D2-glucose. Note the broader peak of D7-glucose compared to D2-glucose in the 2H MR spectra, and the visually lower SNR for Glx and lactate. Figure 3 provides an overview of different levels of 2H-labeled Glx SNR across different infusion methods, types of 2H-labeled glucose, and spatial resolution of DMI. DMI of glucose metabolism in a glioblastoma-bearing mouse is shown in Figure 4, which depicts the map of 2H-labeled lactate, illustrating the local increase in labeled lactate in the tumor region.Discussion
Using a simple RF coil design we showed that DMI of glucose metabolism in mouse brain is feasible, achieving a nominal spatial resolution of 5 uL in a 35 min acquisition. A clear SNR advantage is achieved by using glucose that is labeled in both the 1st and 6th carbon position. Note that we used D7-glucose because [1,6,6’-2H3]-glucose is not readily commercially available. The deuterons on carbons 2,3,4 and 5 do not contribute to labeling of Glx or lactate. During IV infusion of 2H-labeled glucose Glx reaches steady state faster than IP infusion (data not shown). However, when taking this delay into account and starting DMI acquisition 120 min after start of IP infusion, DMI data can be acquired with similar SNR than during IV infusion.Conclusion
DMI of glucose metabolism in mouse brain is feasible, with the highest SNR being achieved by using D7-glucose administered via intravenous infusion. Regional differences in glucose metabolism were clearly visualized using DMI in the GL261 mouse model of glioblastoma.Acknowledgements
This research was supported by NIH grant R01- EB025840.References
1. De Feyter HM, Behar KL, Corbin ZA, et al. Deuterium metabolic imaging (DMI) for MRI-based 3D mapping of metabolism in vivo. Sci. Adv. 2018;4:eaat7314 doi: 10.1126/sciadv.aat7314.
2. De Feyter HM, Behar KL, Rao JU, et al. A ketogenic diet increases transport and oxidation of ketone bodies in RG2 and 9L gliomas without affecting tumor growth. Neuro-Oncol. 2016;18:1079–1087 doi: 10.1093/neuonc/now088.
Figures