4711
Influence of formalin-based fixatives on the MR properties of whole post-mortem pig brains
Azadeh Nazemorroaya1, Ali Aghaeifar1, Hildegard Schulz1, Thomas Shiozawa-Bayer2, Bernhard Hirt2, Klaus Scheffler3,4, and Gisela Hagberg4,5
1Max Planck Institute for Biological Cybernetics, Tuebingen, Germany, 2Clinical Anatomy, University of Tübingen, Tuebingen, Germany, 3High Field Magnetic Resonance,, Max Planck Institute for Biological Cybernetics, Tuebingen, Germany, 4Biomedical Magnetic Resonance, University of Tübingen, Tuebingen, Germany, 5High Field Magnetic Resonance, Max Planck Institute for Biological Cybernetics, Tuebingen, Germany
1Max Planck Institute for Biological Cybernetics, Tuebingen, Germany, 2Clinical Anatomy, University of Tübingen, Tuebingen, Germany, 3High Field Magnetic Resonance,, Max Planck Institute for Biological Cybernetics, Tuebingen, Germany, 4Biomedical Magnetic Resonance, University of Tübingen, Tuebingen, Germany, 5High Field Magnetic Resonance, Max Planck Institute for Biological Cybernetics, Tuebingen, Germany
Synopsis
Post-mortem brain MRI can yield valuable information. However, tissue preservation and MR-compatibility of fixation agents are challenging. Here we investigated the effect of four MR-compatible formalin-based fixatives on the MR properties of pig brains at several timepoints after start of fixation up to one month. The inclusion agents known to improve the dielectric properties of the fixatives lead to greater R2* difference between GM-WM than conventional fixatives. Vice versa these agents lead to a decrease in T1 contrast.
Introduction
Magnetic resonance imaging of post-mortem brain permits long imaging sessions without movement artifacts. Acquired data can reveal valuable information about different brain properties and clinical disease1-3. However, there are challenges in terms of ex-vivo brain tissue preservation and their MR imaging, e.g., MR properties. These can be altered through factors like natural tissue decomposition, chemical fixation, post-mortem interval (PMI), fixation time, and temperature change. Significant reductions in the MR relaxation times (T1 and T2) have been reported for formalin-fixed-brains4-5 and may be reversed by washing out the formalin from the fixed tissue5. Additionally, the fixative agent should be MR-compatible and not degrade image quality. The chemicals used should not cause any chemical shift artifacts6 and the magnetic susceptibility and dielectric properties should be adjusted to achieve a good B0 and B1 homogeneity7. Here we developed four formalin-based fixative agents with some additives to assure tissue fixation while maintaining MRI-compatibility. The fixation effect of these fixatives on the MR properties of pig brain was investigated up to one month after immersion fixation.Method
Four formalin-based fixative agents (Fix01, Fix02, Fix03 and Fix04) were developed considering MRI-compatibility. The NMR spectra of the additives were checked by the online NMR spectra predictor tool provided in www.nmrdb.org. The dielectric properties of final solutions were measured using SPEAG Dielectric Assessment Kit, Probe DAK-12. Measurements were carried out for four independently prepared set of each fixative. The averaged results are listed in figure 1.B.Four pig brain samples were bought from a slaughter house and placed in fixative solutions with a PMI of less than 6h. An elliptical container divided into four equal segments (figure 1.A) was filled with roughly 700 ml of each fixative, and the sample was fixed in the middle of the segment with gauze. This setup enabled simultaneous scanning of all samples at different times after start of fixation (12 hours, 1, 2, 3, 4, 13, 19, and 28 days). MRI measurements were performed at 9.4T in a Siemens whole body MR scanner using a 16-channel transmit array in combination with a 31-element receive array8. The data acquired on different days were co-registered using SPM12 and were mapped to the same spatial grid using nearest neighbor interpolation. The employed acquisition parameters were as follows:
- T1 sequence: MP2RAGE [9]; Inversion times, TI1/TI2=900/3500 ms; TE/TR=2.3/6ms; volume TR=9s; FA=4/6°; voxel size=0.8 mm isotropic, GRAPPA factor=3; 6/8 partial Fourier factor
- R2* sequence: Multi-echo GRE; TE= 6.03, 12, 18, 24, 30 ms; TR=34 ms; FA =15°; voxel size=0.4 mm isotropic; FoV=204×165.8×46 mm3
Results
Figure 2 shows an increase of gray matter (GM)-white matter (WM) R2* contrast and WM R2* values with fixation time. This effect is greater in Fix01 and Fix02 fixed-brains than in Fix03 and Fix04 fixed-brains. A progressive reduction in T1 and GM-WM contrast occurred in all samples but was most prominent for Fix01 and Fix02-immersed-brains (Figure 3). T1 values highly depend on molecular tumbling of water molecules in the tissue. With increasing fixation time, fixative penetration and thus water immobilization and protein cross-linking improve which affect molecular tumbling and consequently T1 values. The R2* and T1 variation rate slows down after day 13 which means the fixation procedure takes roughly 3 weeks to complete.Figure 4 demonstrates that the overall shape of R2* and T1 histograms of four fixed brains after 12 hours of fixation are similar except that they are scaled with the sample size. By fixation time, R2* and T1 value of GM, and WM change. This evolution causes relevant changes in the histogram shape, in terms of distinct peaks and shoulder emerging in the R2* and T1 histograms of day 28. The leftward shift of the R2* and T1 histogram during fixation time are depicted in Figure 5.A. It shows that Fix01 and Fix02-immersed-brains had a smaller R2* reduction and a larger T1 reduction than the Fix03 and Fix04-immersed-brains.
Pixel-wise T1 and R2* differences between 12 hours and 28 days are shown in Figure 5.B. demonstrating prominent R2* increase and T1 reduction in the WM, especially for Fix01 and Fix02-immersed brains. Several of the GM pixels appeared with decreased T1 and R2* values.
Discussion and conclusion
We investigated the effect of four MR-compatible formalin-based fixatives on the MR properties of post mortem pig brain. The results demonstrated a progressive T1 and R2* decrease with fixation time. The reduction rate was different for different fixatives and was stabilized after 3 weeks of immersion. An increased in WM R2* values Future work could be the segmentation of pig brain tissue classes (GM, WM and apparent CSF in the fixative-filled ventricles) using probabilistic atlases to plot related T1 and R2* histograms individually and track the changes by fixation time. Another suggestion would be washing out the fixatives from the fixed brains using Phosphate-buffered saline (PBS) to investigate any possible changes in their MR properties.Acknowledgements
No acknowledgement found.References
- Loureiro J. R., Himmelbach M. et al. In-vivo quantitative structural imaging of the human midbrain and the superior colliculus at 9.4T. NeuroImage. 2018; 177: 117-128.
- Gouw A. A., Seewann A., Vrenken H., Van der Flier W. M. , Rozemuller J.M., Barkhof F., Scheltens P., Geurts J.J., et al. Heterogeneity of white matter hyperintensities in Alzheimer's disease: post-mortem quantitative MRI and neuropathology. Brain. 2008; 131: 3286-3298.
- Dawe R.J., Bennett D.A., Schneider J.A., Vasireddi S.K., Arfanakis K., et al. Postmortem MRI of human brain hemispheres: T2 relaxation times during formaldehyde fixation. Magn. Reson. Med. 2009; 61(4):810–818.
- Dawe R.J., Bennett D.A., Schneider J.A., Leurgans S.E., Kotrotsou A., Boyle P.A., Arfanakis K., et al. Ex vivo T2 relaxation: associations with age-related neuropathology and cognition. Neurobiology of Aging. 2014; 35: 1549-1561.
- Shepherd T., Thelwall P., Stanisz G., Blackband S., et al. Aldehyde fixative solutions alter the water relaxation and diffusion properties of nervous tissue. Magn. Reson. Med. 2009; 62 (1): 26-34.
- Ianniello C, de Zwart JA, Duan Q., et al. Synthesized tissue-equivalent dielectric phantoms using salt and polyvinylpyrrolidone solutions. Magn. Reson. Med. 2018; 80:413-419.
- Hoult DI, Phil D., et al. Sensitivity and power deposition in a high-field imaging experiment. J Magn. Reson. Imaging. 2000; 12: 46–67.
- Shajan G., Kozlov M., Hoffmann J., Turner R., Scheffler K. and Pohmann R., et al. A 16-Channel Dual-Row Transmit Array in Combination with a 31-Element Receive Array for Human Brain Imaging at 9.4 T. Magn. Reson. Med. 2014; 71:870–879.
- Hagberg GE., Bause J., Ethofer T., Ehses P., Dresler T., Herbert C., Pohmann R., Shajan G., Fallgatter A., Pavlova MA., et al. Whole brain MP2RAGE-based mapping of the longitudinal relaxation time at 9.4 T. Neuroimage. 2017; 144(Pt A):203-216.
- Hagberg GE., Indovina I., Sanes JN., Posse S., et al. Real‐time quantification of T(2)(*) changes using multiecho planar imaging and numerical methods. Magn. Reson. Med. 2002; 48: 877–882.
Figures
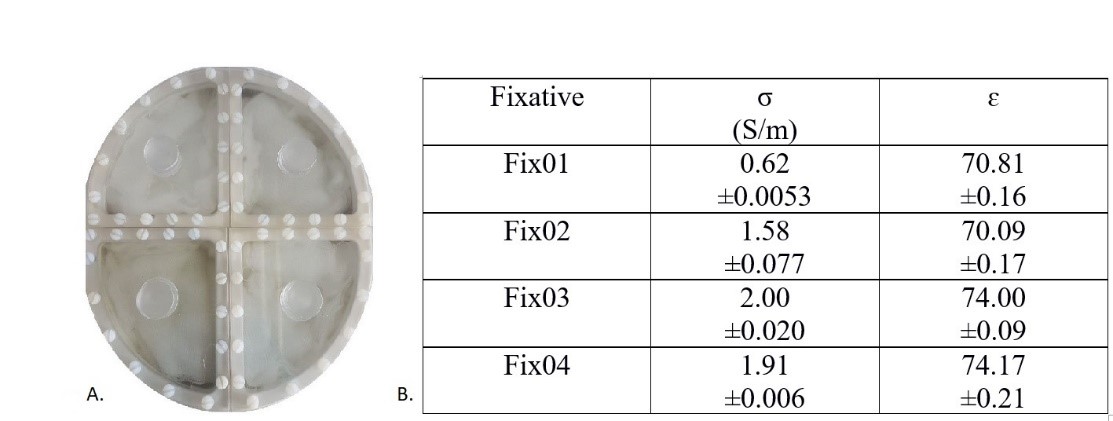
Figure 1: A) Elliptical container divided into
four segments to facilitate parallel measurement of four fixed brains within
Fix01, Fix02, Fix03 and Fix04. B) Average conductivity, σ (S/m), and permittivity, ɛ
(without unit) and standard deviation obtained for four fixatives at 400 MHz (9.4T)
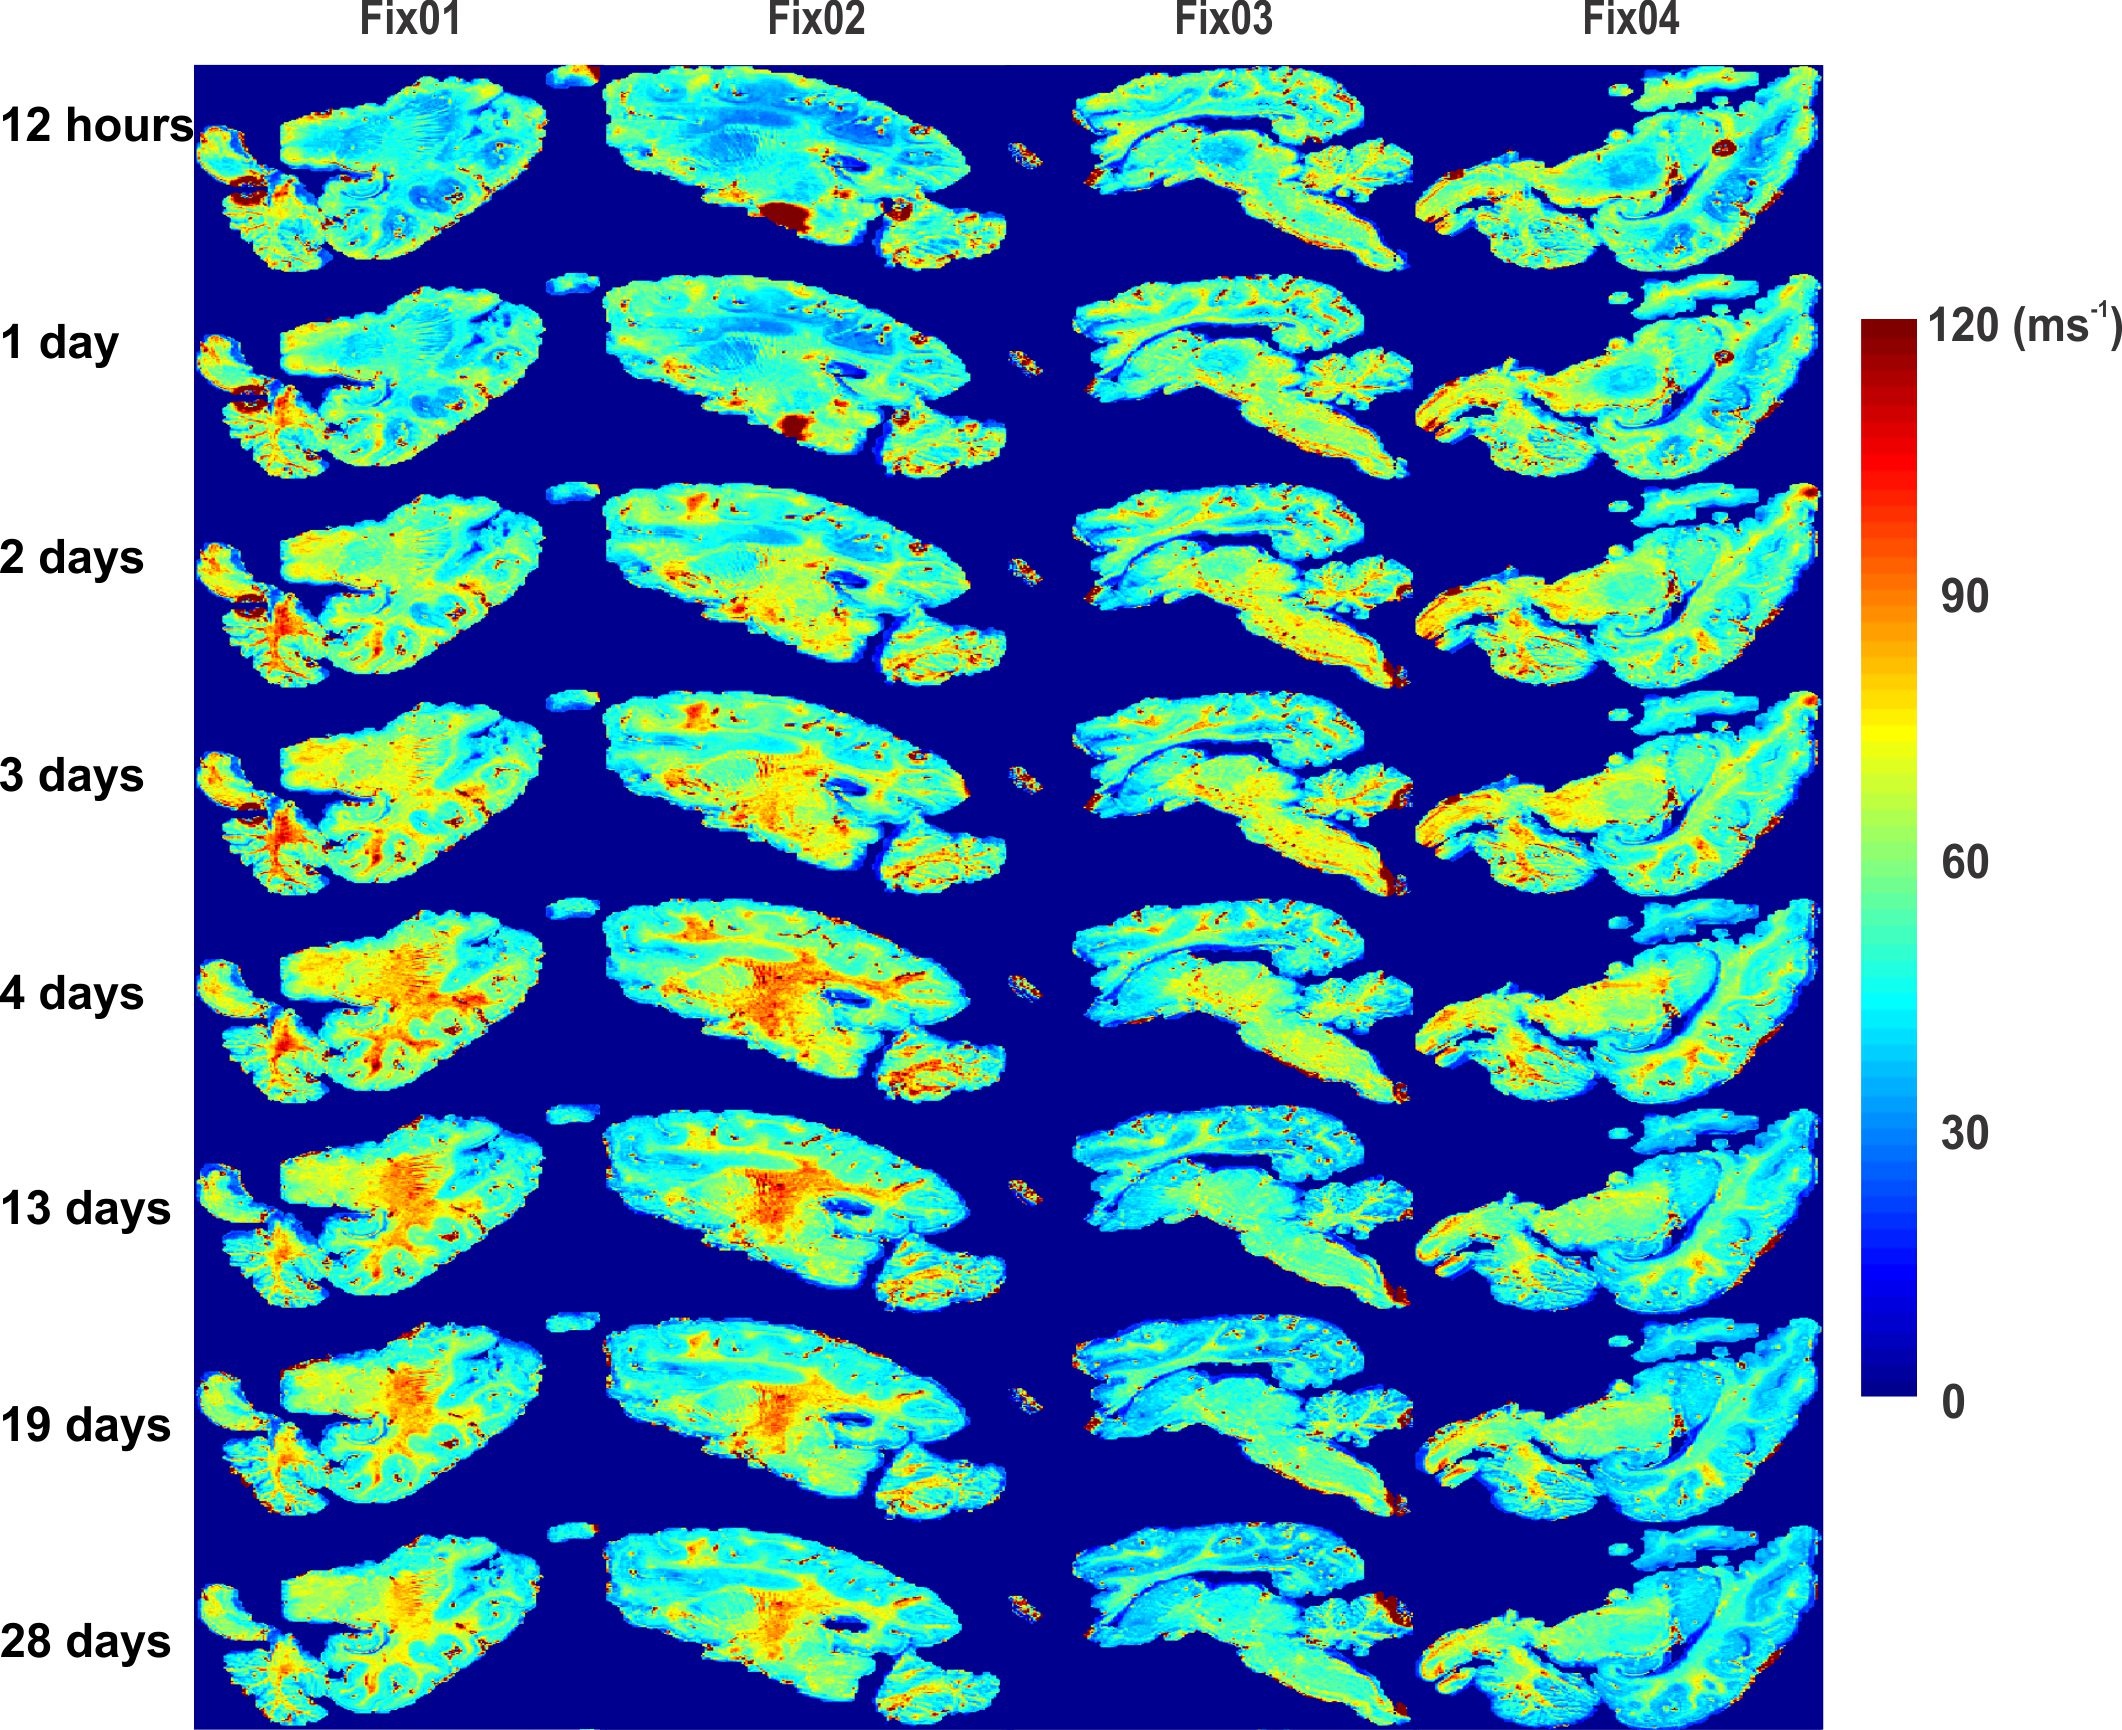
Figure
2: R2* maps for chemically fixed brains on
different measurement days demonstrate an enhanced GM-WM contrast especially
for brains in Fix01 and Fix02. The variation rate slows down after 13 days of
fixation indicating that the fixation procedure has been completed.
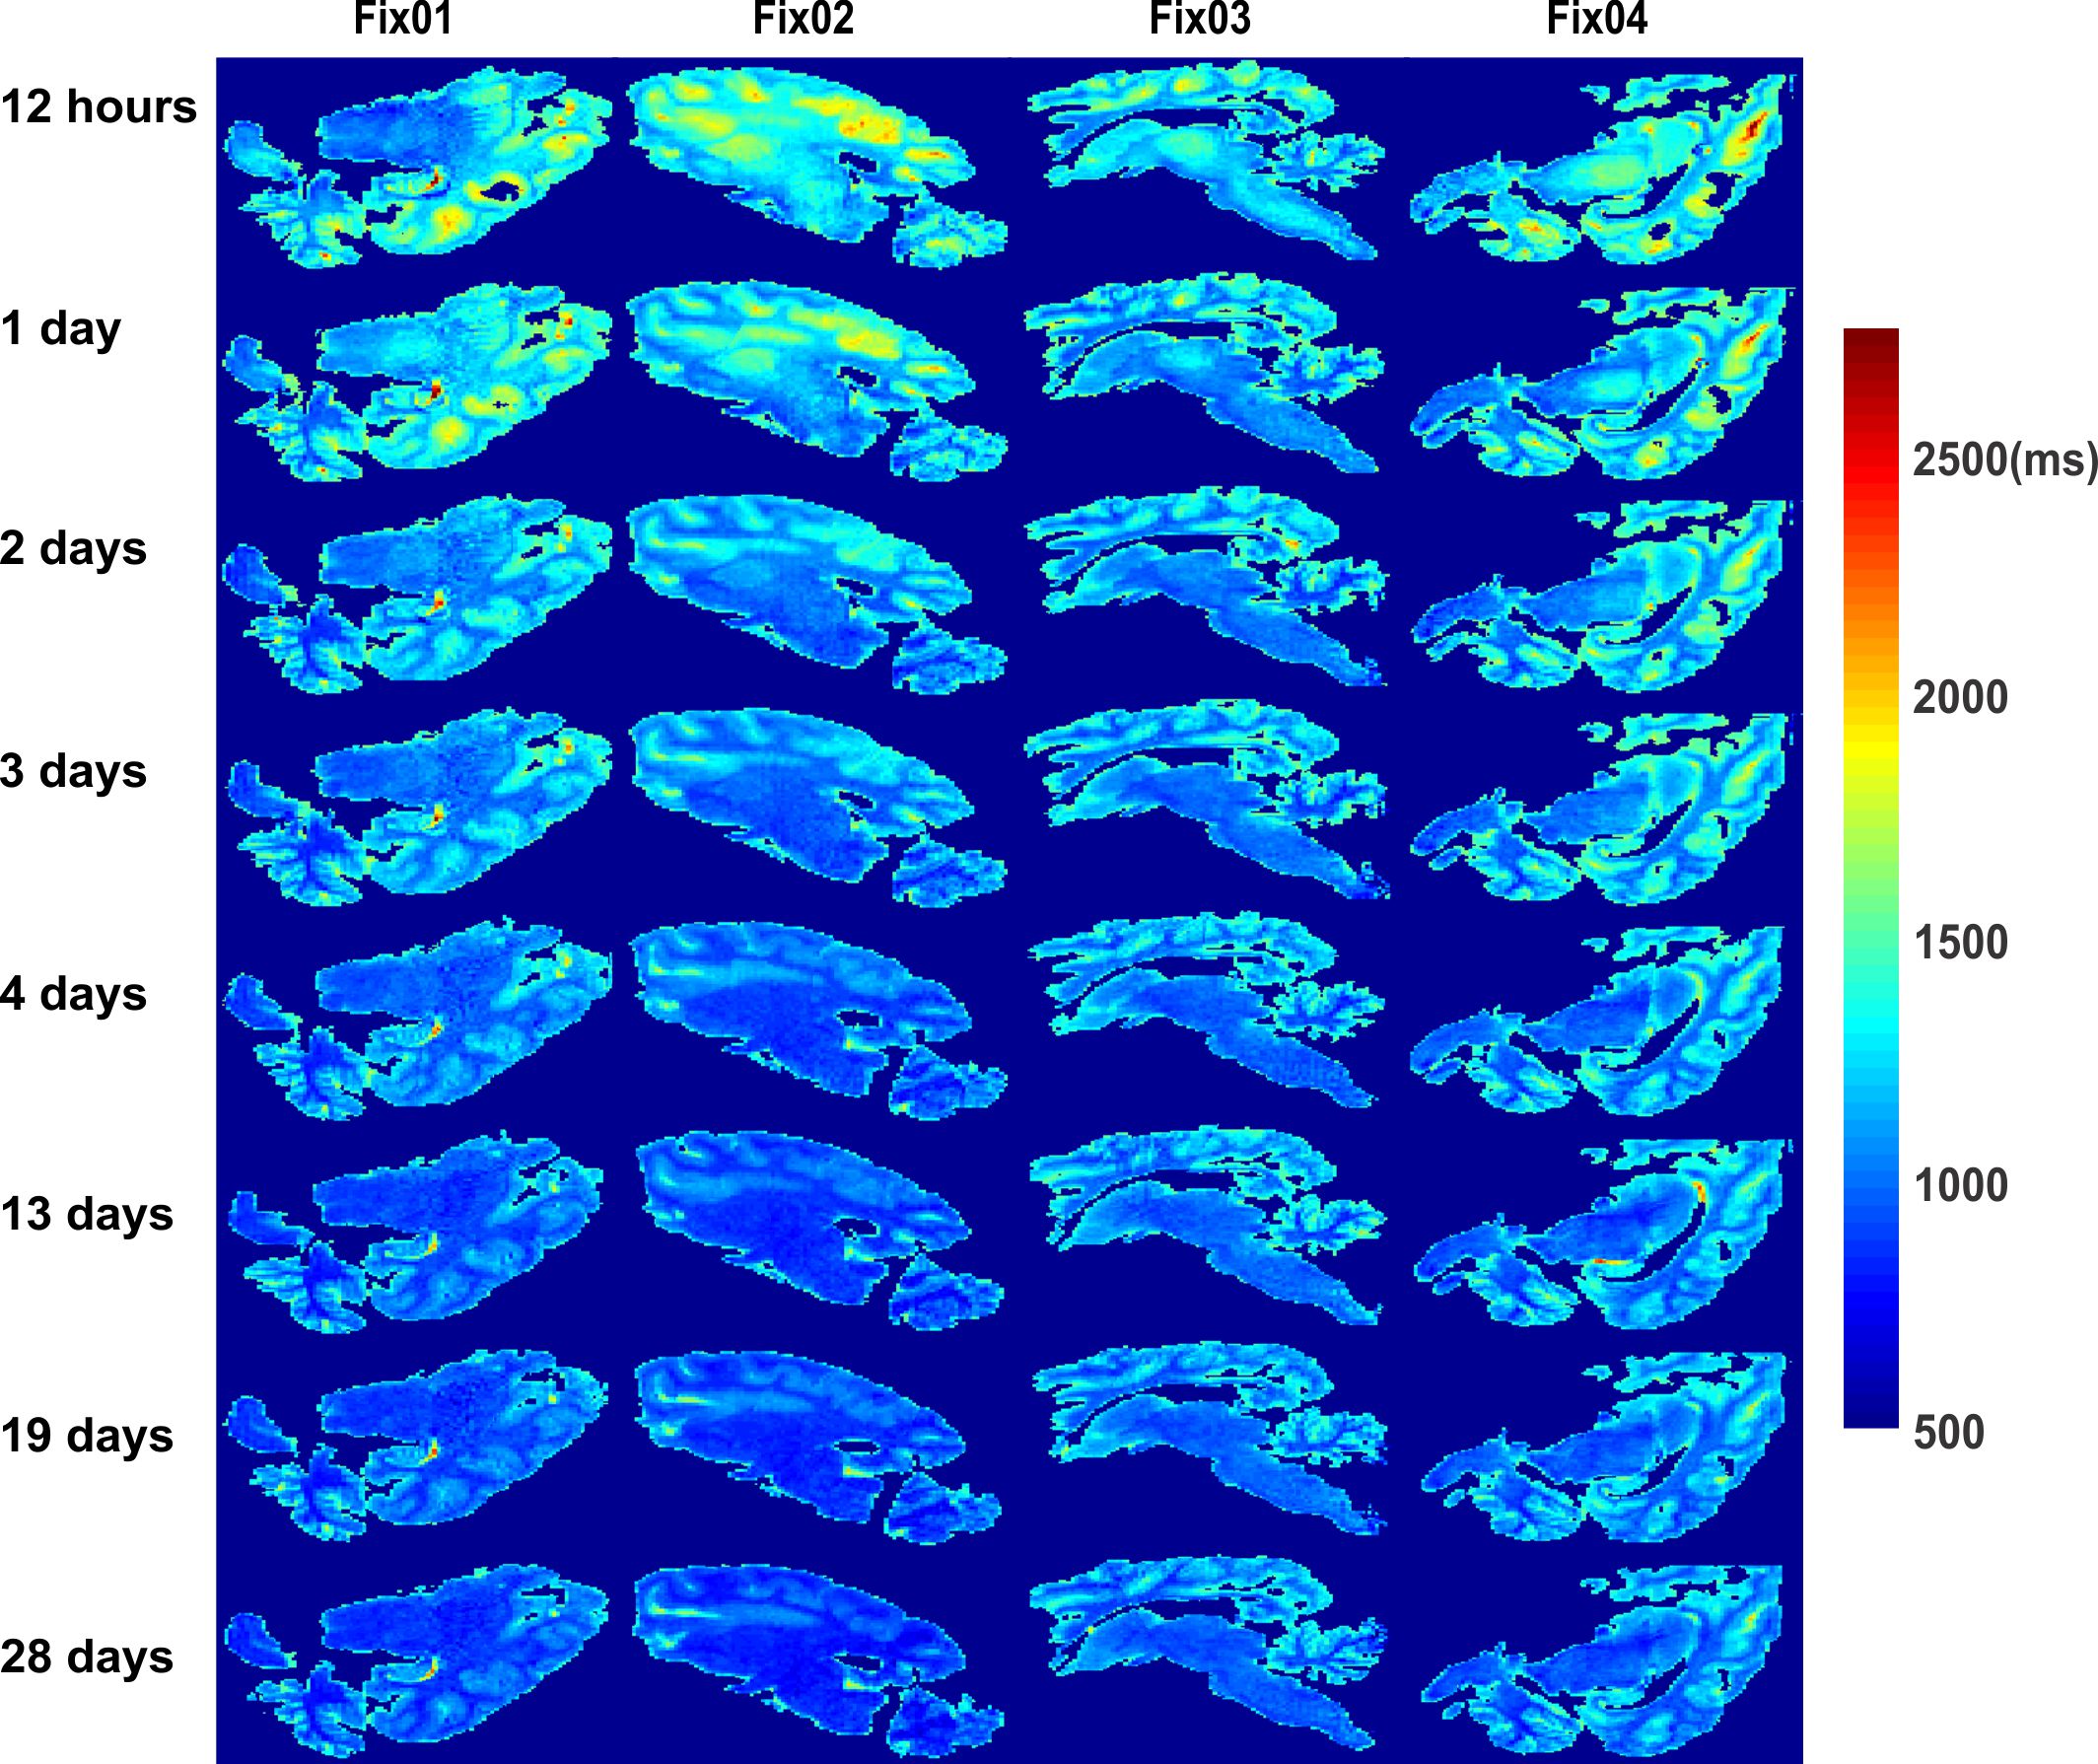
Figure 3: T1
maps for chemically fixed brains on different measurement days shows a
progressive T1 reduction in all samples being more enhanced for
Fix01 and Fix02. The T1 change rate was slowed down by the chemical
fixation progress from day13 and onwards.
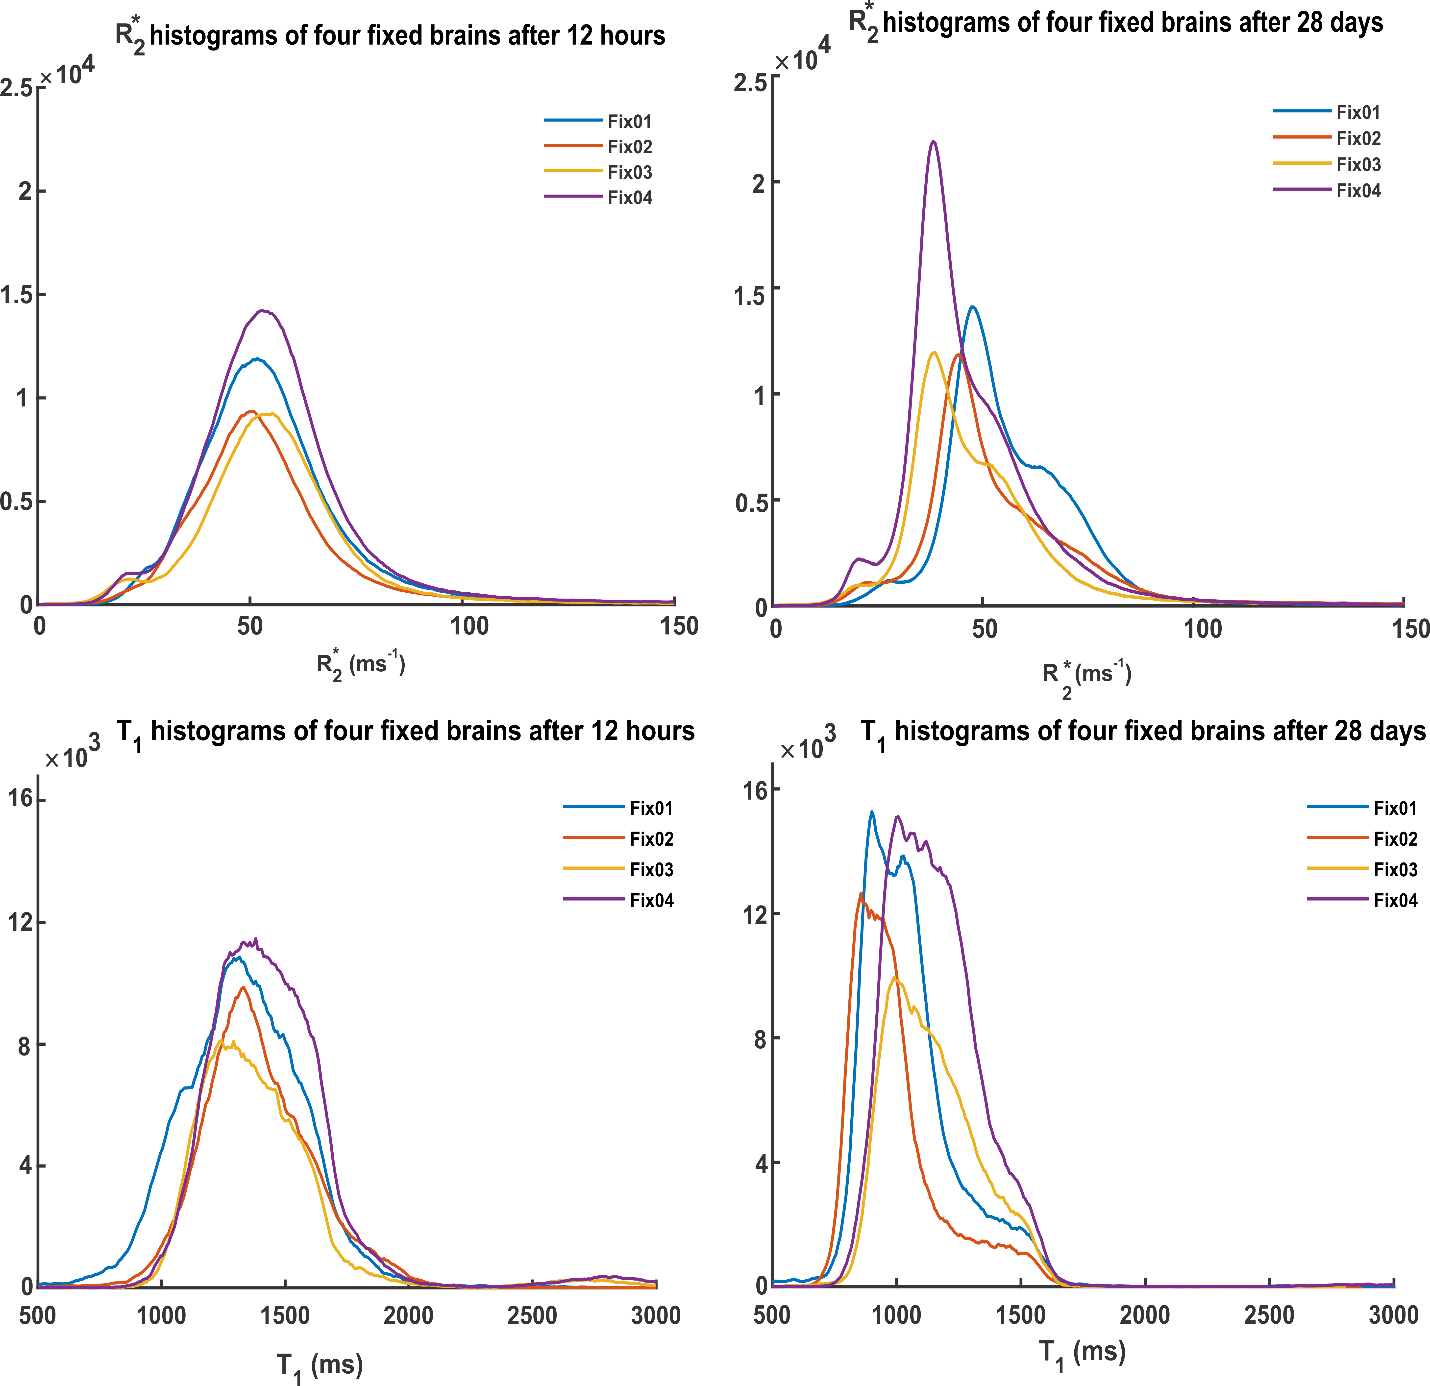
Figure 4: R2*
and T1 histograms of four fixed brains after 12 hours and 28 days of
fixation. Within the first hours, the four histograms converge. With increasing
fixation time, distinct peaks and shoulders appeared as a result of changes of
R2* and T1 in GM, WM and the fixative filled
ventricles.
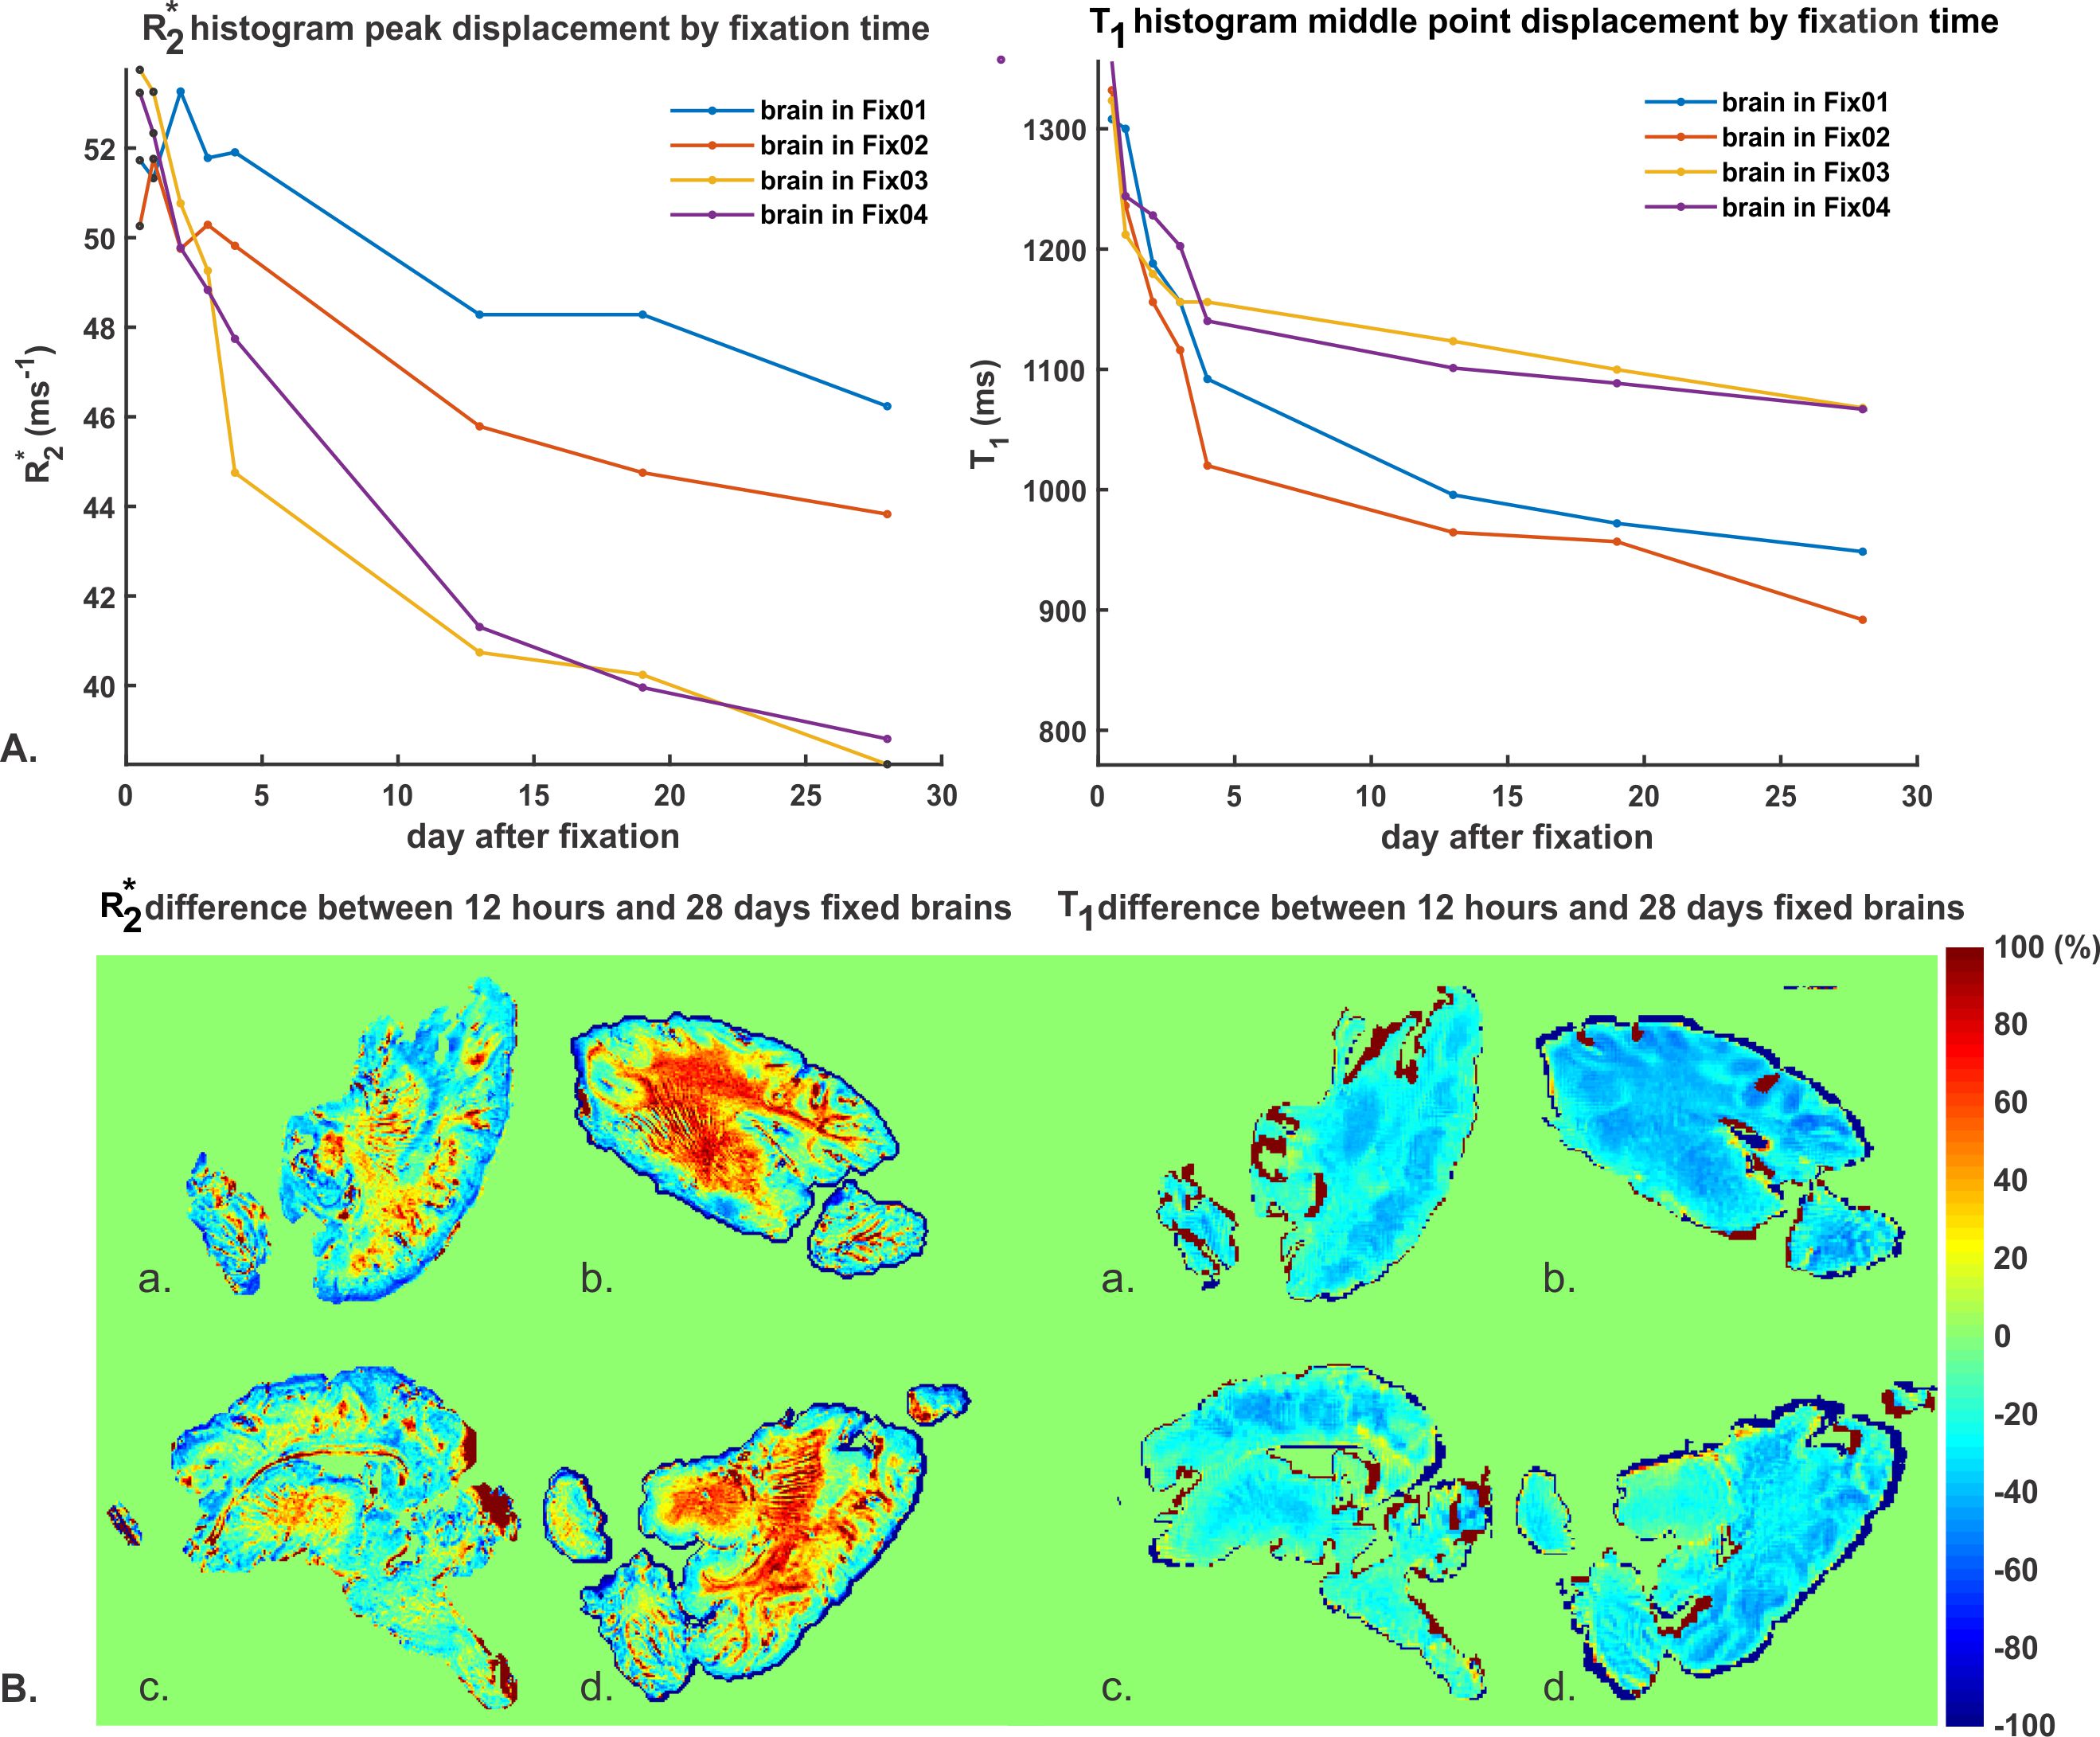
Figure 5: A) Change in peak R2* and T1
values for each fixed brain with fixation time. Peaks were determined from the
linear interpolation of handpicked middle points in the T1
histograms and the main peak in the R2* histogram at each
measurement day. B) Pixel-wise
T1 and R2* change (in percentage) between 12
hours and 28 days after start of fixation: a. Fix04, b. Fix02, c. Fix03, d. Fix01.