4710
Extracellular Volume Fraction (ECV) of Liver Tumors: Mapping of VX2 Tumors in Rabbits before and after Therapy.1Yale University, New Haven, CT, United States
Synopsis
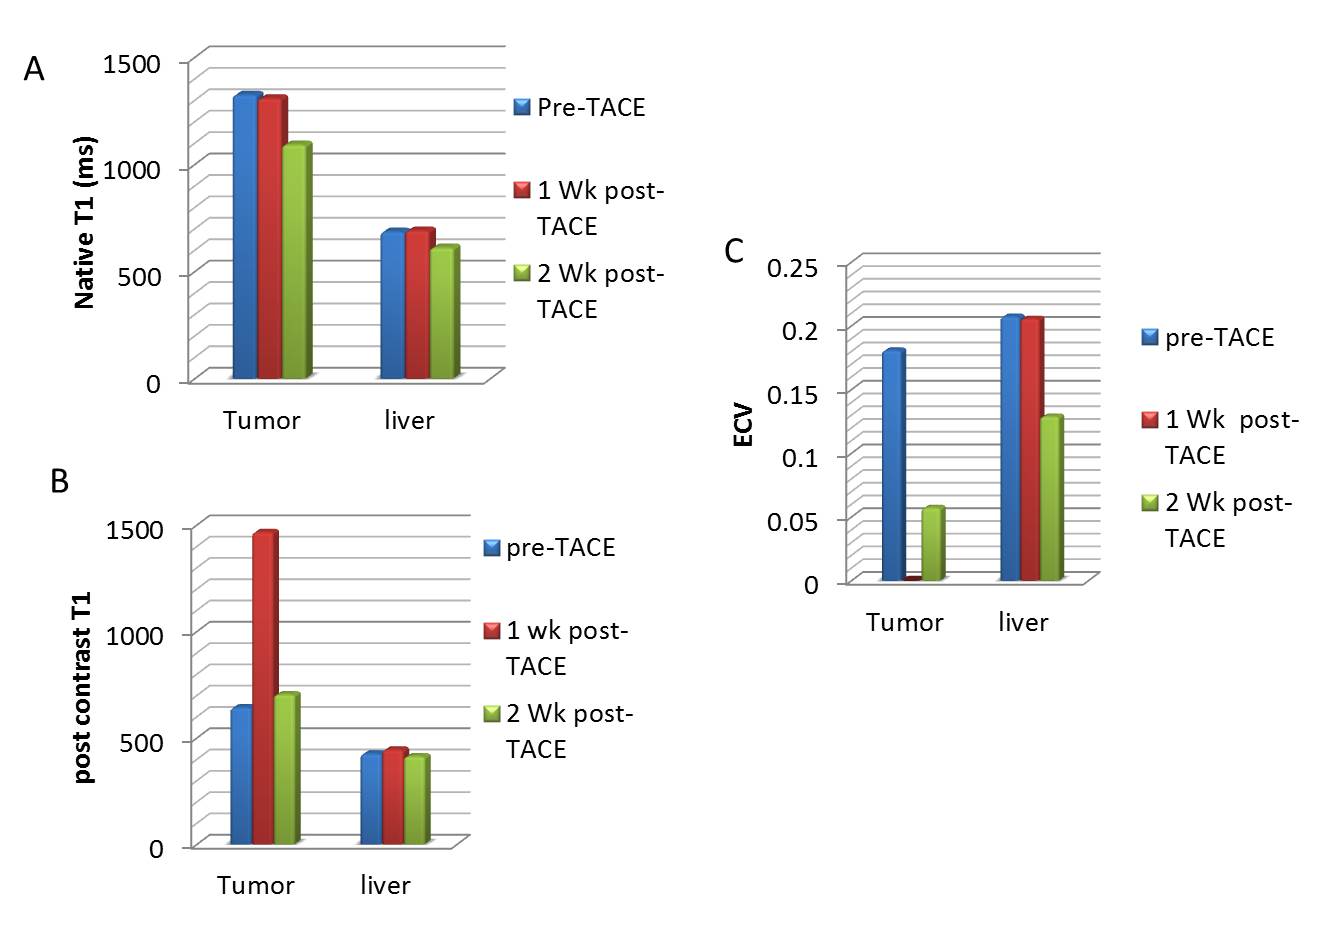
In this work, we studied a VX2 tumor in rabbits, which provides a model for hepatocellular carcinoma. The rabbits were imaged with T1 mapping (pre- and post-contrast), which was used to generate extracellular volume fraction (ECV) maps. The average ECV for normal liver and tumor was 20 +/-11 % and 18 +/- 7%, respectively. One week after TACE, tumor ECVs fell to zero, but recovered slightly at two weeks, while normal liver ECV values changed variably after TACE. This preliminary study shows that ECV mapping can depict the highly heterogeneous tumor morphology.
Introduction
Hepatocellular carcinoma (HCC) often occurs in patients with underlying cirrhotic liver disease, with hepatocytes replaced by extracellular matrix/fibrotic tissue. Diagnosis of HCC is important, and is accurately performed using multiphase dynamic contrast enhanced (DCE) MRI. Liver cirrhosis can also be assessed by MRI, usually using fat-water imaging, and MR elastography, which is currently the method most accurate compared to biopsy at detecting fibrosis (1). In this work, we studied a VX2 tumor in rabbits, which resemble HCC from an imaging and metabolic perspective (2). Although this model does not have cirrhosis, the tumors were imaged before and after chemoembolization, which devascularizes the tumor, and may have effects on normal liver. The rabbits were studied with T1 mapping (pre and post-contrast) (3) and extracellular volume fraction. Extracellular volume fraction, very recently investigated for the liver (4-6), might have a role in evaluating cirrhosis and fibrosis in the liver. Here we studied ECV measures of liver fibrosis in livers with implanted tumor before and after therapies. We hypothesized that 1) ECV would be diminished in the tumor after therapy. 2) TACE might cause changes in ECV in normal surrounding liver. Similarly, we investigated changes in native liver T1s, in both regions of tumor and normal liver.Methods
New Zealand white rabbits were imaged at three time-points each. Rabbits were surgically implanted with VX2 tumors in the liver as previously established by our co-investigators (3), with growth for two weeks after implantation, after which trans-arterial chemoembolization (TACE) was performed. Imaging was performed pre-TACE and at 1 and 2 weeks follow-up after TACE. All imaging was performed on a 3.T Prisma scanner (Siemens, Erlangen, Germany) in a 16 channel Knee coil. 3D T1 mapping was performed prior to DCE and immediately following it, using 3D GRE, with a 5, 8, 12,15° flip angles, with B1-mapping for correction of flip angles, and offline fitting in Matlab (5). Scan parameters were: resolution: 0.5 x 0.5 x 2.5mm, 200mm x 120 mm FOV, 192 x 100 matrix. DCE was performed during an injection of 0.1mmol/kg of gadovist, using a 3D VIBE sequence with CAIPIRINHA parallel imaging factor of 2 in both ky and kz (6). Scan parameters were: TR/TE/θ= 3.4ms/1.3ms/9°, 0.5 x 0.5 x 2.5mm, 200mm x 120 mm FOV, 192 x 100 matrix, partial Fourier factor 6/8, 32 slices, fat suppression with SPAIR. The frame time was 3 s per volume. The DCE data was analyzed to estimate contrast concentrations pixel by pixel, and arterial concentration. ECV was calculated using the equation:ECV =(1-hct)*(1/T1post –1/T1pre)/(1/T1b-post- 1/T1b-pre)
Pre and post-contrast T1 maps were used, hct was assumed as 0.45, pre-contrast blood T1b-pre was assumed to be 1600ms at 3T and T1b-post was estimated from the final blood T1 by the derived DCE concentration curves, due to concern that the post-contrast T1 maps might be unreliable in the vasculature, due to inflow.
Results
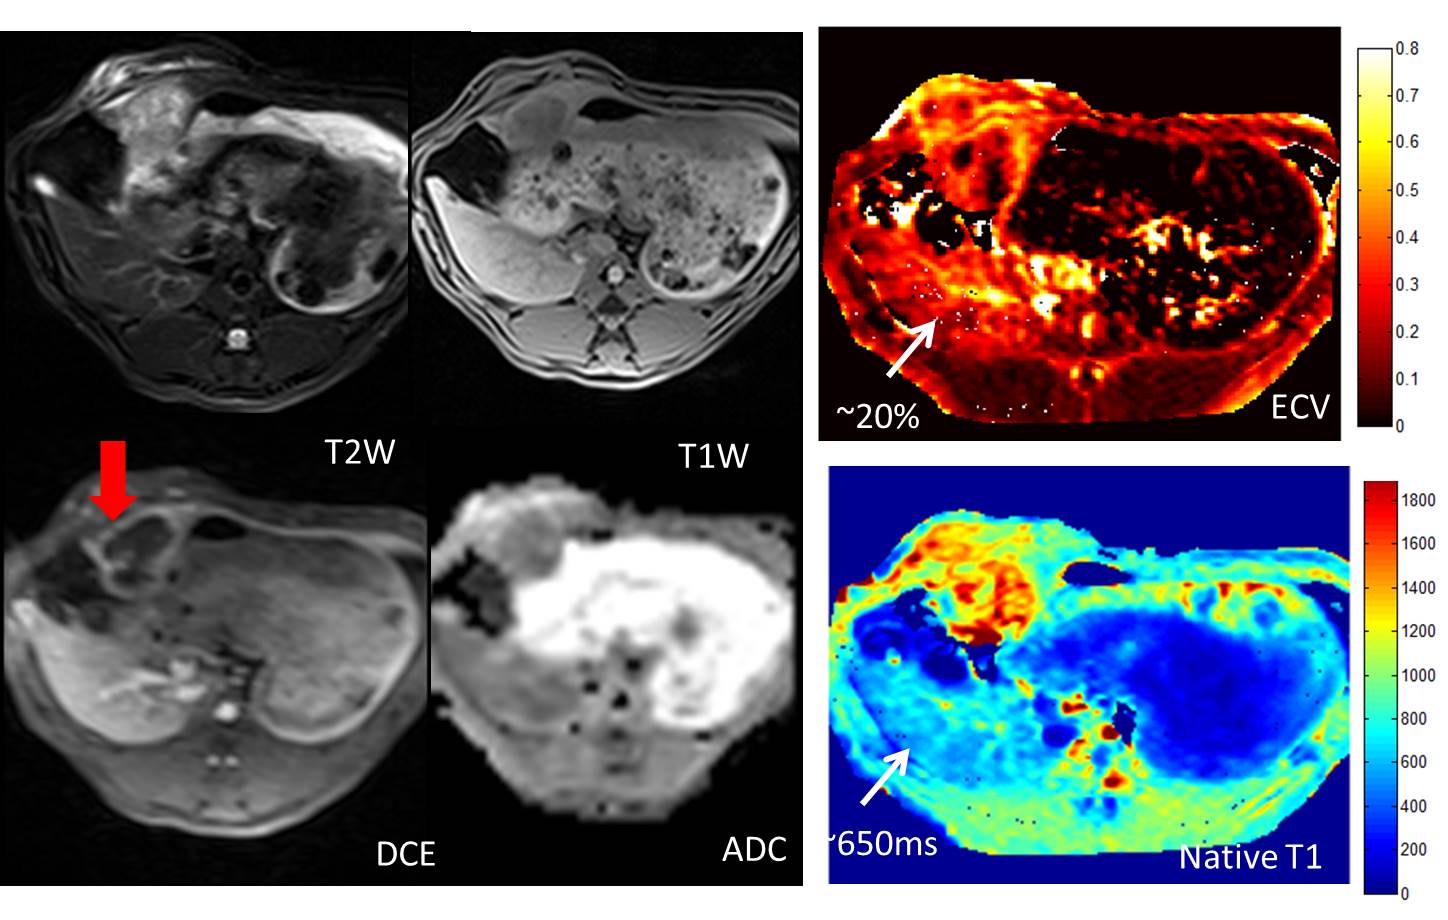
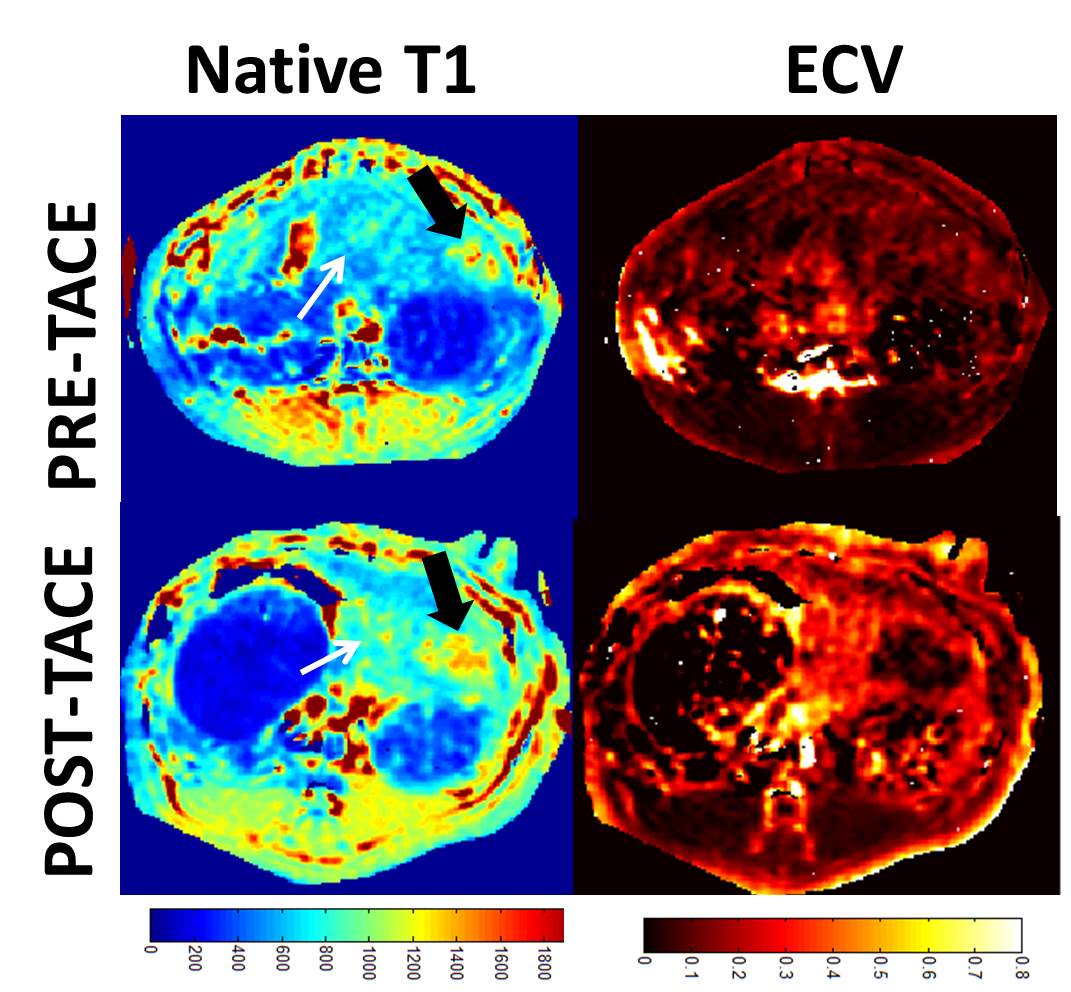
Figure 1 shows multi-parametric mapping (native T1 map, and ECV, compared to other maps) in a rabbit with a large untreated liver tumor. The tumor exhibits heterogeneity, which is reflected in each quantitative map. Figure 2 compares native T1 and ECV maps, in rabbits prior to TACE, and at 1 week post-TACE. In these studies, complete devascularization of the tumor is evident from the very low ECV in the tumor post-TACE. In these subjects, the normal liver appears to have a higher ECV after TACE, although this result was variable among all rabbits. Figure 3 presents data from four rabbits at 3 time-points.Discussion
This preliminary study shows that ECV mapping can depict the highly heterogeneous tumor morphology. Our values are lower than those found in patients with liver-disease (3), but similar to the ECV measured in a prior animal study (20-30%) (4). Although post-contrast T1 imaging was performed early after injection (4 minutes), a recent study found that ECV is relatively constant for times post-injection greater than 5 minutes. Other T1 mapping methods (e.g. MOLLI) have been studied in the liver (4), and appear to provide similar or greater accuracy compared to the variable flip angle method used here, albeit with much lower speed per slice. The post-contrast arterial T1 was an estimate and might be a source of error. The potential utility of liver ECV for replacing biopsy requires further investigation.Acknowledgements
This work was supported by NIH (R01 CA206180, R01 EB-023366, P30 NS-052519).References
1. Yin M,et al. Clin Gastroenterol Hepatol 2007;5(10):1207–1213.e2.
2. Savic LJ et al. Clin Cancer Res. 2019
3. Chen HL et al. Magn Reson Med. 2006.
4. T Terkes et al, MR Materials in physics biology and Medicine (2019)/
5.
J Luetkens
et al. European Radiology Experimental. (2019).
6. H Kim et al., Radiology 2008.
Figures