4709
Fast 3D T1 mapping with isotropic high resolution using ultrashort TE MRI
Jin Zhang1, Karl Kiser1, and Sungheon Gene Kim1
1New York University School of Medicine, New York, NY, United States
1New York University School of Medicine, New York, NY, United States
Synopsis
It remains challenging to acquire 3D isotropic high resolution T1 mapping in in vivo MRI experiments. The increase of T1 mapping resolution and coverage are typically limited by the scan time. The purpose of this study is to investigate the feasibility of estimate 3D isotropic high resolution T1 mapping using the variable flip angle (VFA) method1 and 3D-UTE-GRASP sequence2 for small animal imaging at 7T within 3 minutes.
Introduction
T1 mapping plays an important role in quantitative dynamic contrast enhanced (DCE) MRI studies. Owing to the limited scan time for in vivo studies, it remains challenging to obtain high resolution T1 mapping for quantitative DCE-MRI analysis. In our previous study2, we developed the 3D-UTE-GRASP method for 3D high resolution DCE-MRI study based on the Golden-angle Radial Sparse and Parallel (GRASP) technique3. In this study, we investigated the feasibility of using the same 3D-UTE-GRASP sequence, combined with the variable flip angle (VFA) method1 to achieve 3D isotropic high resolution T1 mapping within 3 minutes. This method was tested for small animal imaging at 7T.Methods
Six to eight-week-old C57BL6 mice (n = 5) (2 with GL261 mouse glioma models) were used for this study. MRI experiments were performed on a Bruker 7T micro-MRI system, with 1H four-channel phased array receive-only MRI coil. The mice were treated in strict accordance with the National Institutes of Health Guide for the Care and Use of Laboratory Animals, and this study was approved by the Institutional Animal Care and Use Committee. Data Acquisition: T1 measurement was performed with three methods listed in Table 1. In method I, the conventional UTE3D sequence provided by the vendor was run three times (51,360 center-out spokes in each run) with flip angles 8o, 2o and 12o respectively. In method II, the UTE sequence was modified to use the 3D golden angle sampling followed by image reconstruction using compressed sensing and parallel processing, referred to as 3D-UTE-GRASP2 as reported in our previous study. The 3D-UTE-GRASP was run for 3 minutes using the same three flip angles in series with 12,776 spokes for each flip angle. In method III, 2D RARE-VTR sequence was used to measure T1 in three orthogonal planes for comparison with the 3D methods. T1 Map Estimation: For method I, fully sampled images from 3D UTE with three flip angles were used to estimate T1 maps. For method II, the 3D-UTE-GRASP image reconstruction2 was conducted to generate images with temporal resolution T = 10 s (5 frames for each flip angle with totally 15 frames). T1 estimation was carried out using the VFA method with the center frames from each flip angle segment. For method III, the Image Sequence Analysis (ISA) function of the manufacturer was used to obtain T1 maps with 64 x 64 matrix size and extrapolated to 128 x 128 to match the 3D maps from other methods.Results
Figure 1 shows an example of the 3D volume rendering and mid-coronal/sagittal/axial slice images for method I/II/II. Figure 2 shows corresponding estimated T1 maps in sagittal/coronal/axial planes for each method. Figure 3 shows the Bland Altman plots for comparison between the methods with pooled T1 values from the sagittal/coronal/axial directions as showed in Figure 2. It can be seen that the proposed method (method II) has better consistence with Bruker RARE-VTR measurement (method III) with the smallest mean or median difference and the regression slope. The relatively larger difference was observed between method II and method I; mean ± standard deviation = -7.5% ± 29.2%, with median value -11.0% and 25 ~ 75 quartile range [-19.9% ~ -1.2%]. The mean and standard deviation of relative error between method III and method I is -1.39% ± 33%, with median value -6.7% and 25 ~ 75 quartile range [-14.4% ~ -4.0%]). Hence the proposed method (method II) provided T1 values similar to that what RARE-VTR (method III) would do, but for a substantially higher resolution and image matrix size within 3 minutes. Experiments from the other four mice showed similar performance.Discussion and Conclusion
This study shows the possibility of using the 3D-UTE-GRASP method for fast 3D isotropic high resolution T1 map estimation, which is essential for whole tumor high resolution quantitative DCE-MRI studies as well as other T1-based tissue characterization.Acknowledgements
NIH R01CA160620, NIH R01CA219964, P41EB017183, NIH/NCI 5P30CA016087References
- H. M. Cheng and G. A. Wirght, MRM 55:566-574, 2006
- J. Zhang, L. Feng, R. Otazo and S. Kim, MRM, 2019 Jan;81(1):140-152.
- L. Feng, R. Grimm, K. T. Block, H. Chandarana, S. Kim, J. Xu, L. Axel, D. K. Sodickson, R. Otazo, MRM, 2014;72(3):707-717.
Figures
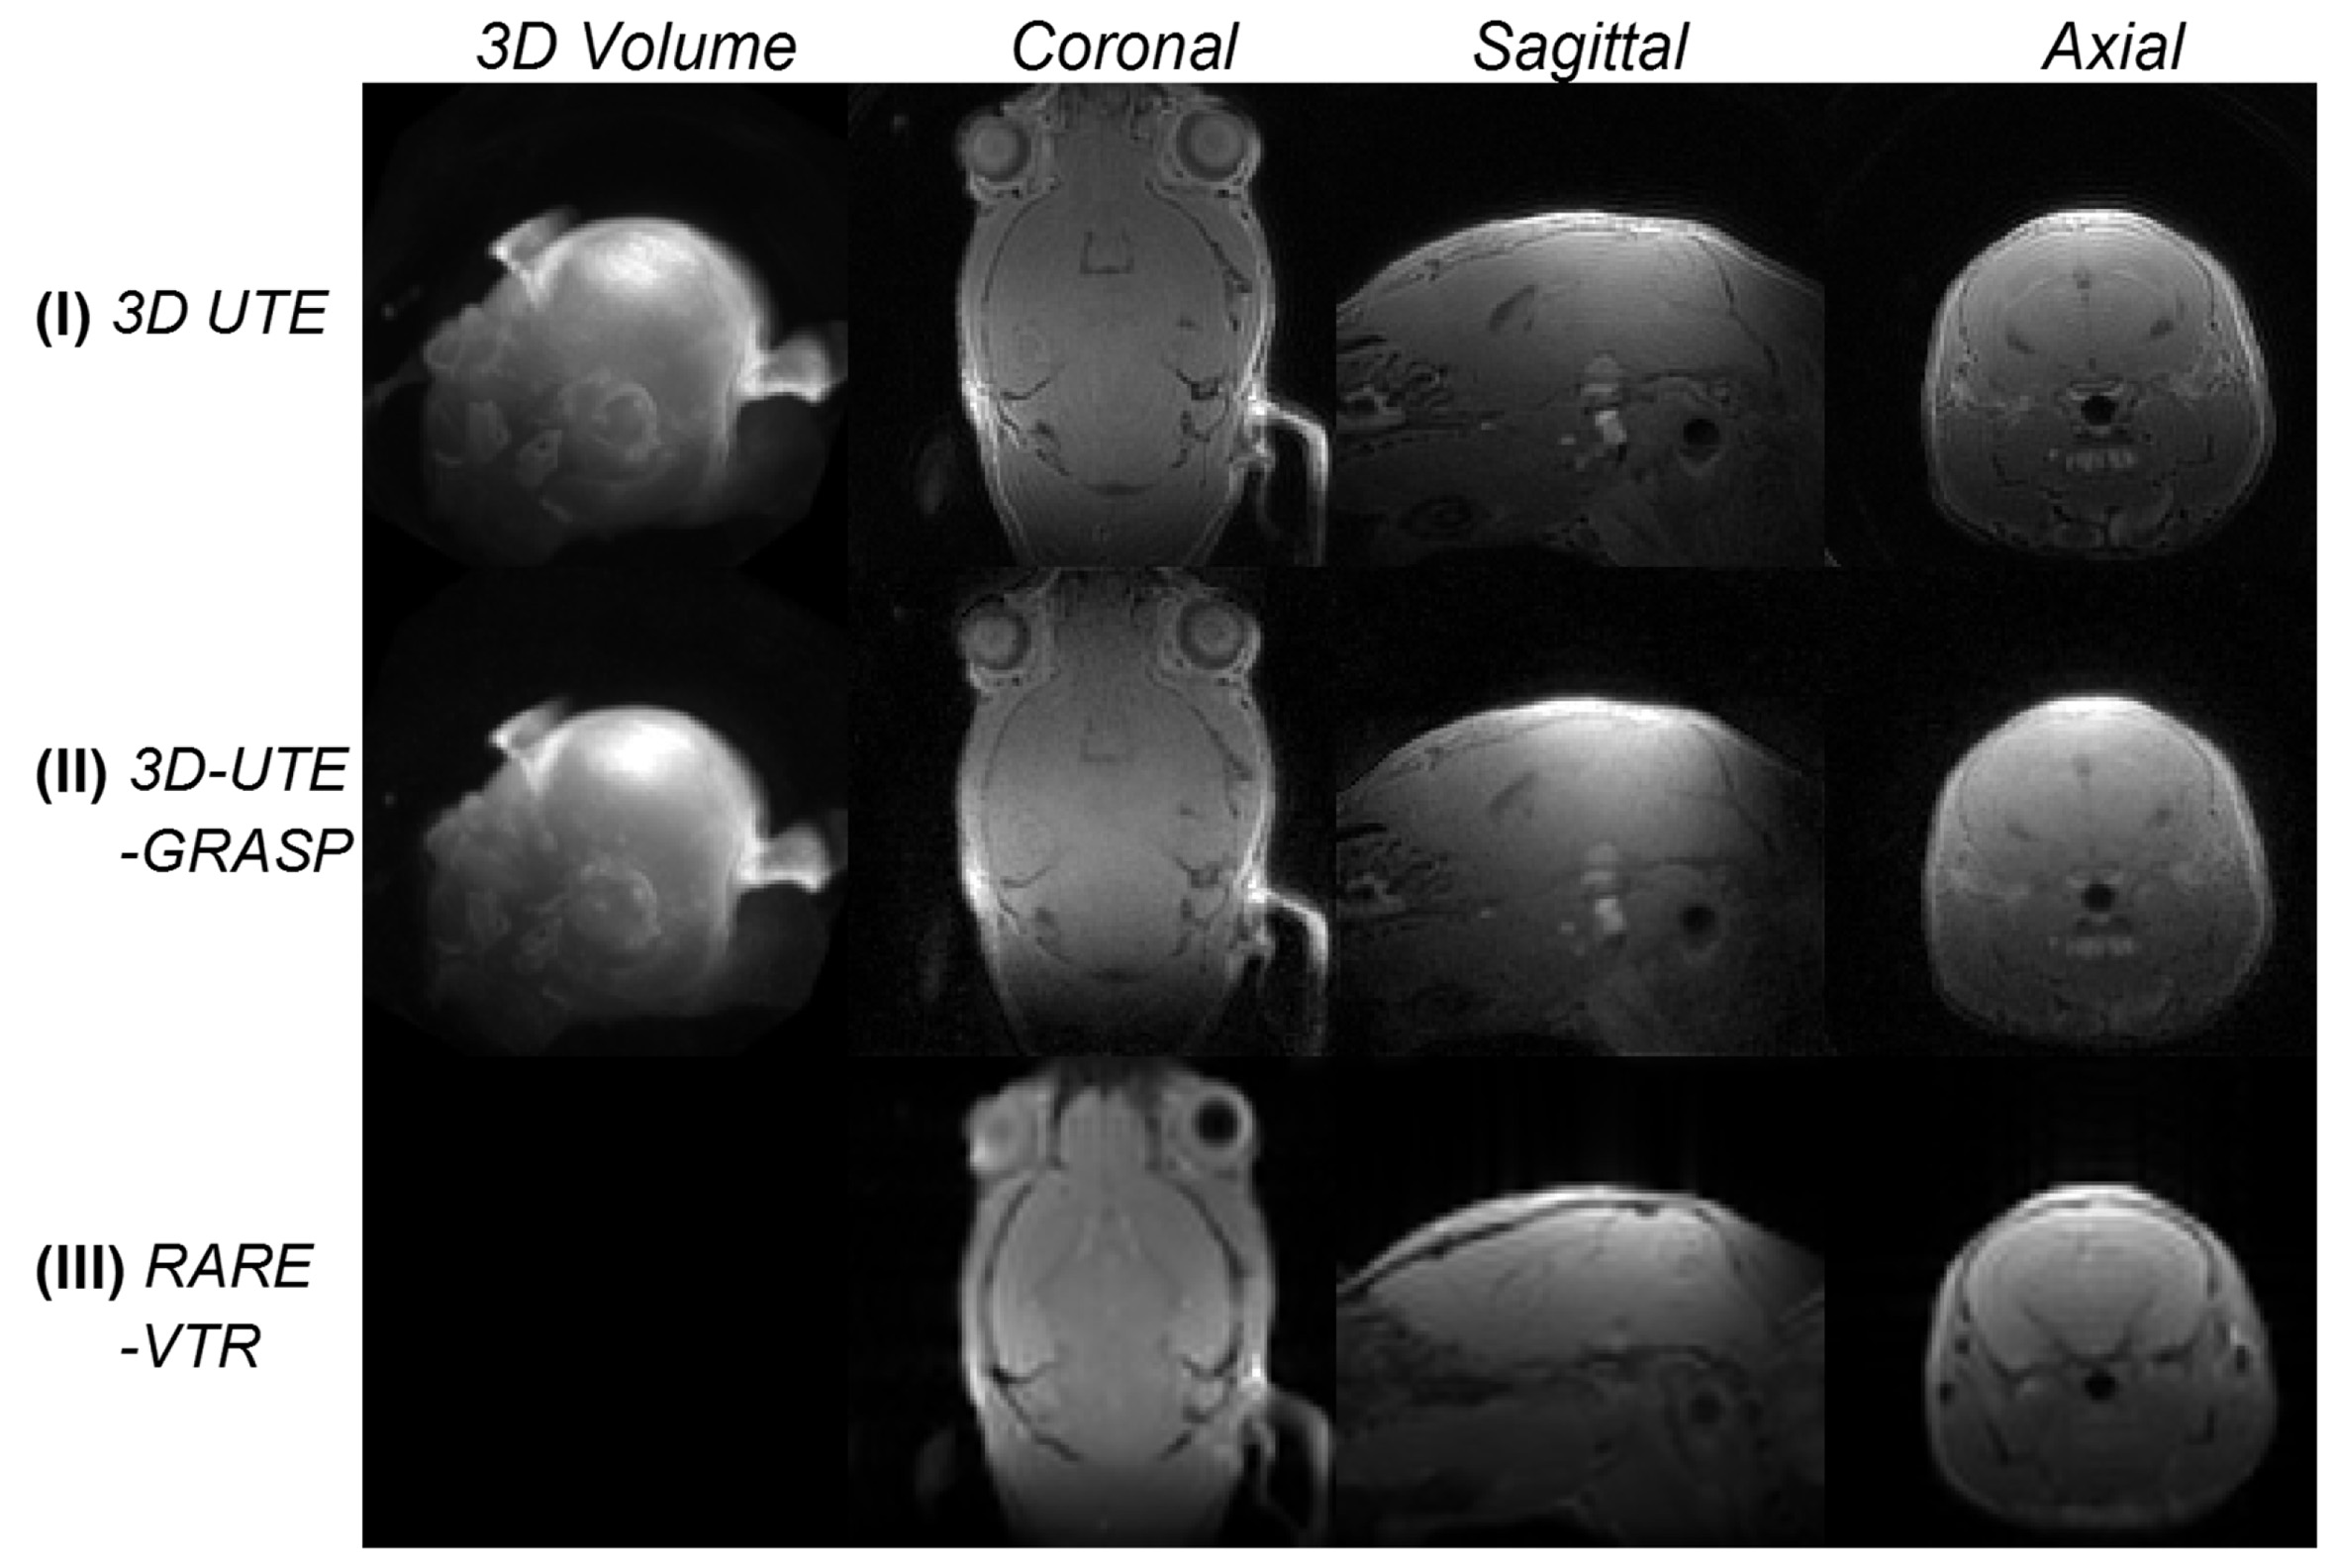
Figure 1. 3D rendering of the mouse brain (flip angle = 8o)
and mid-coronal/sagittal/axial slices acquired/reconstructed using the three
methods.
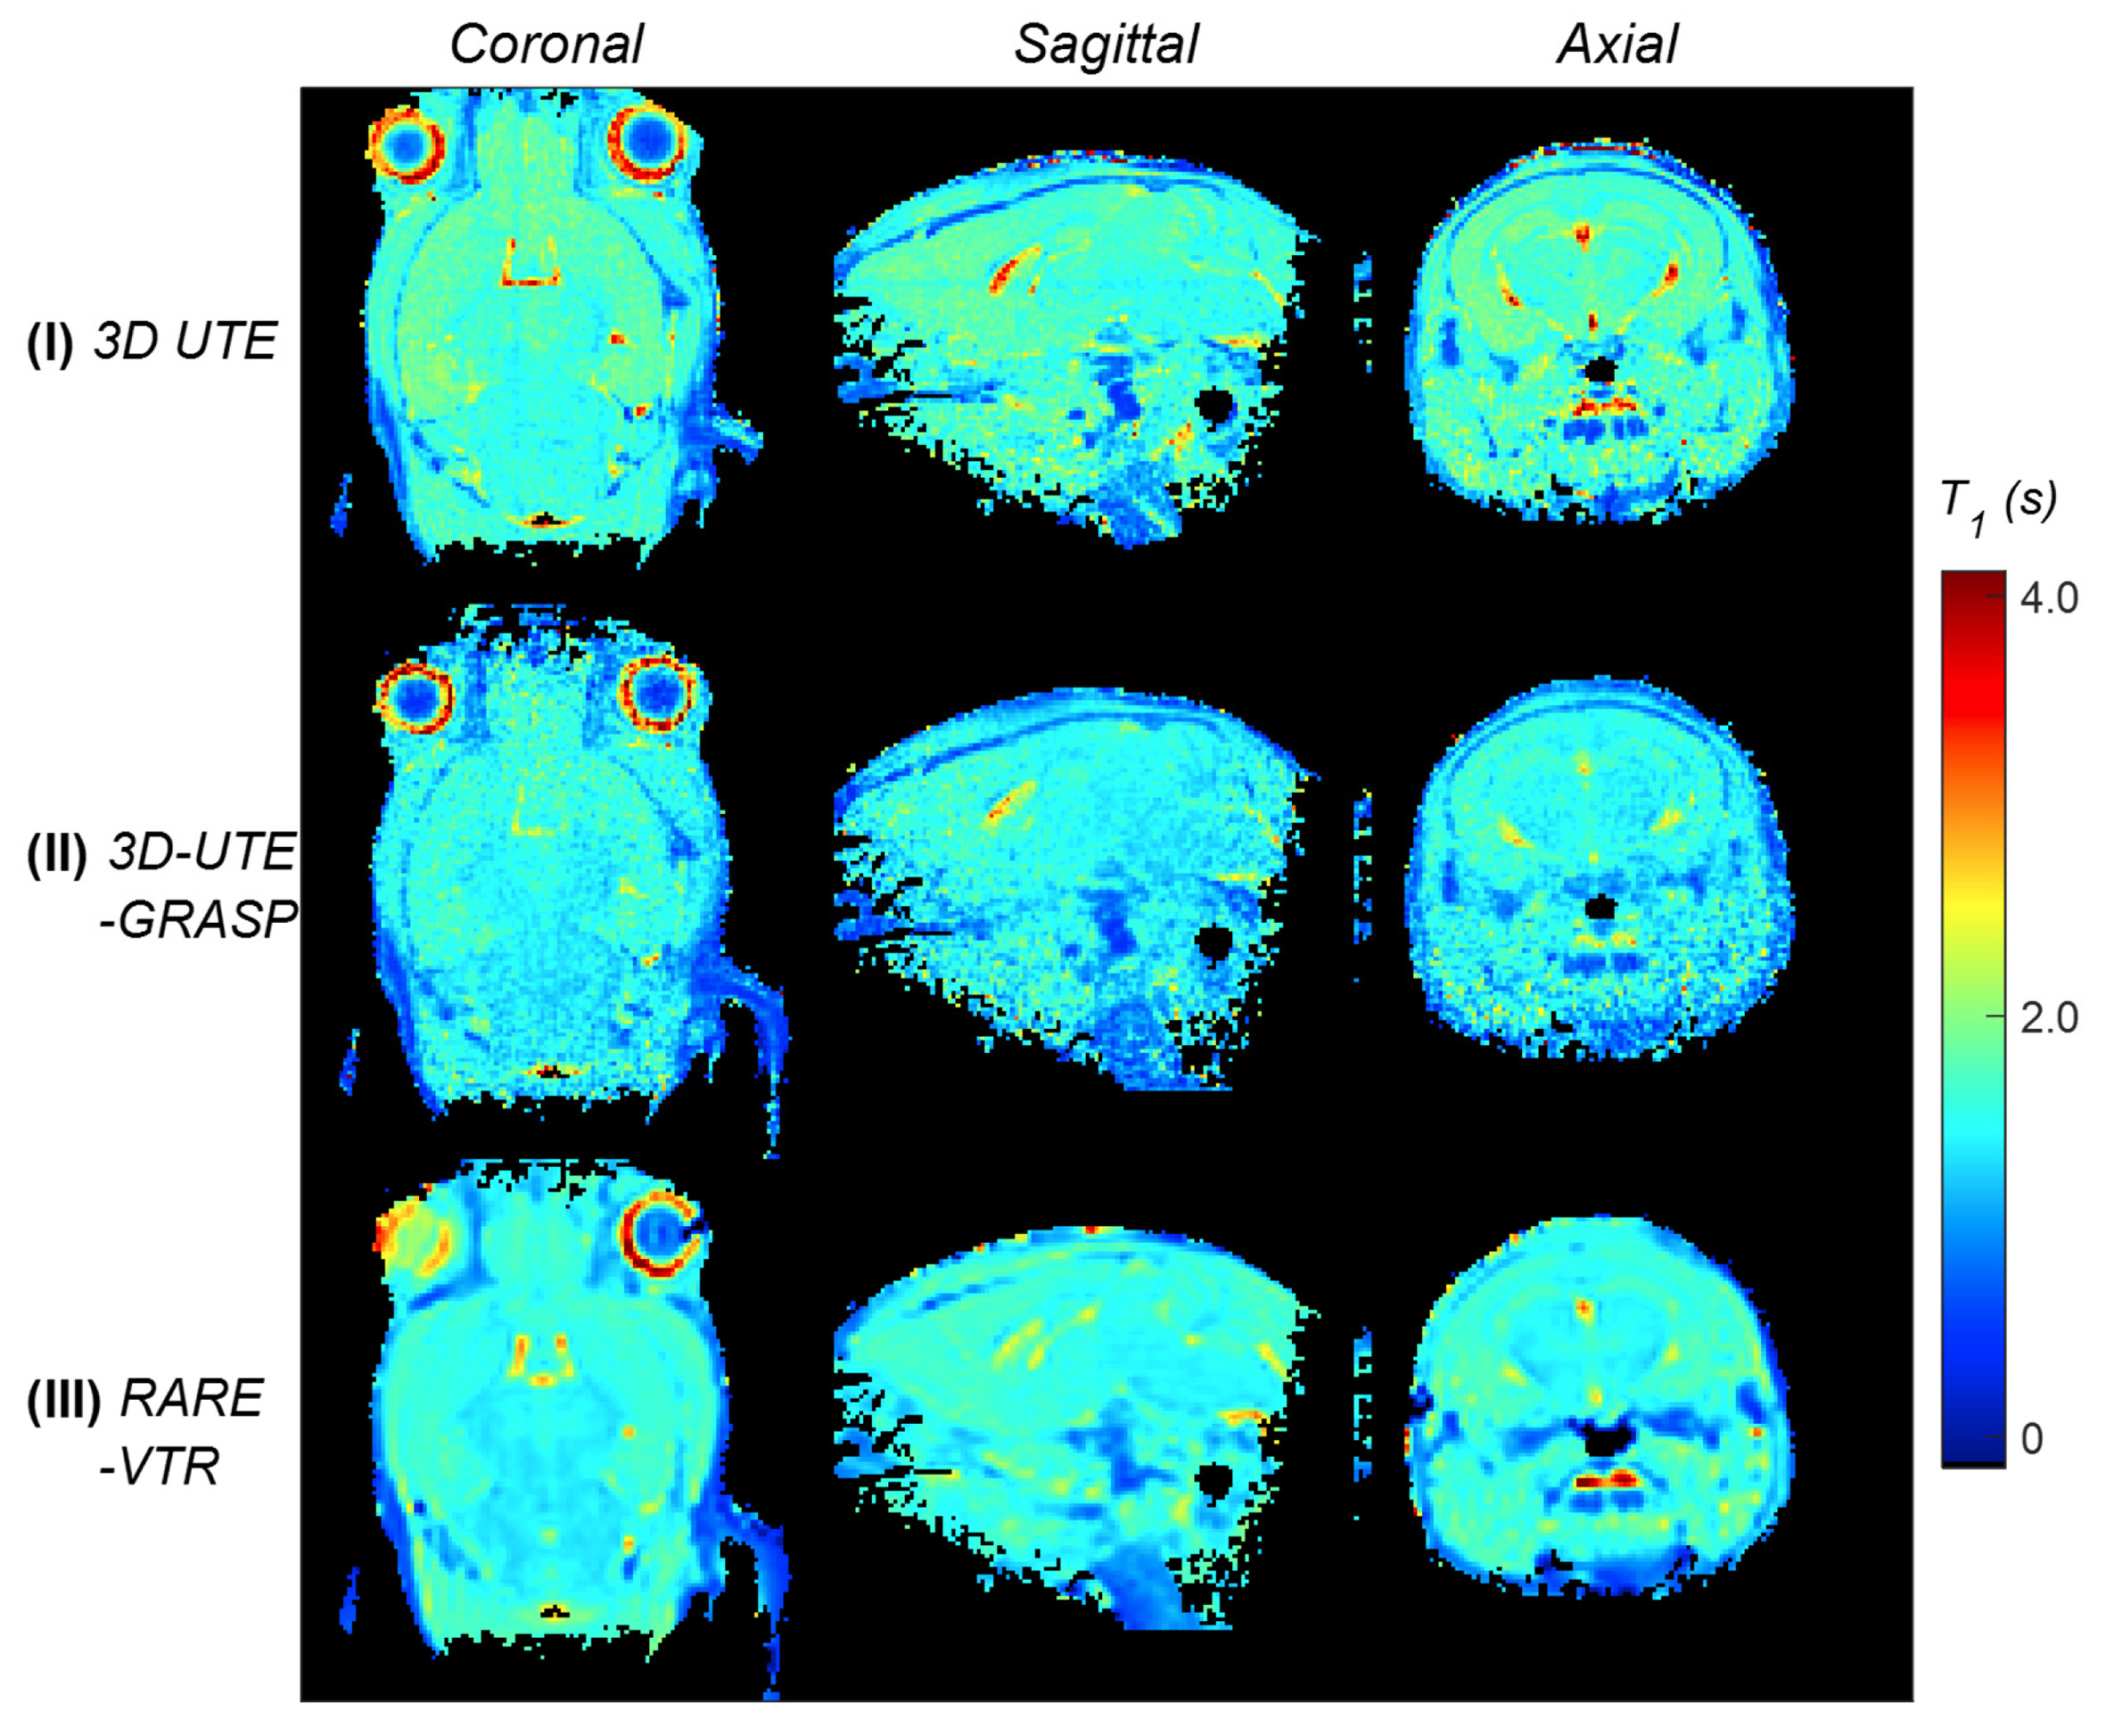
Figure 2. Estimated T1
maps in mid-coronal/sagittal/axial direction from the three methods.
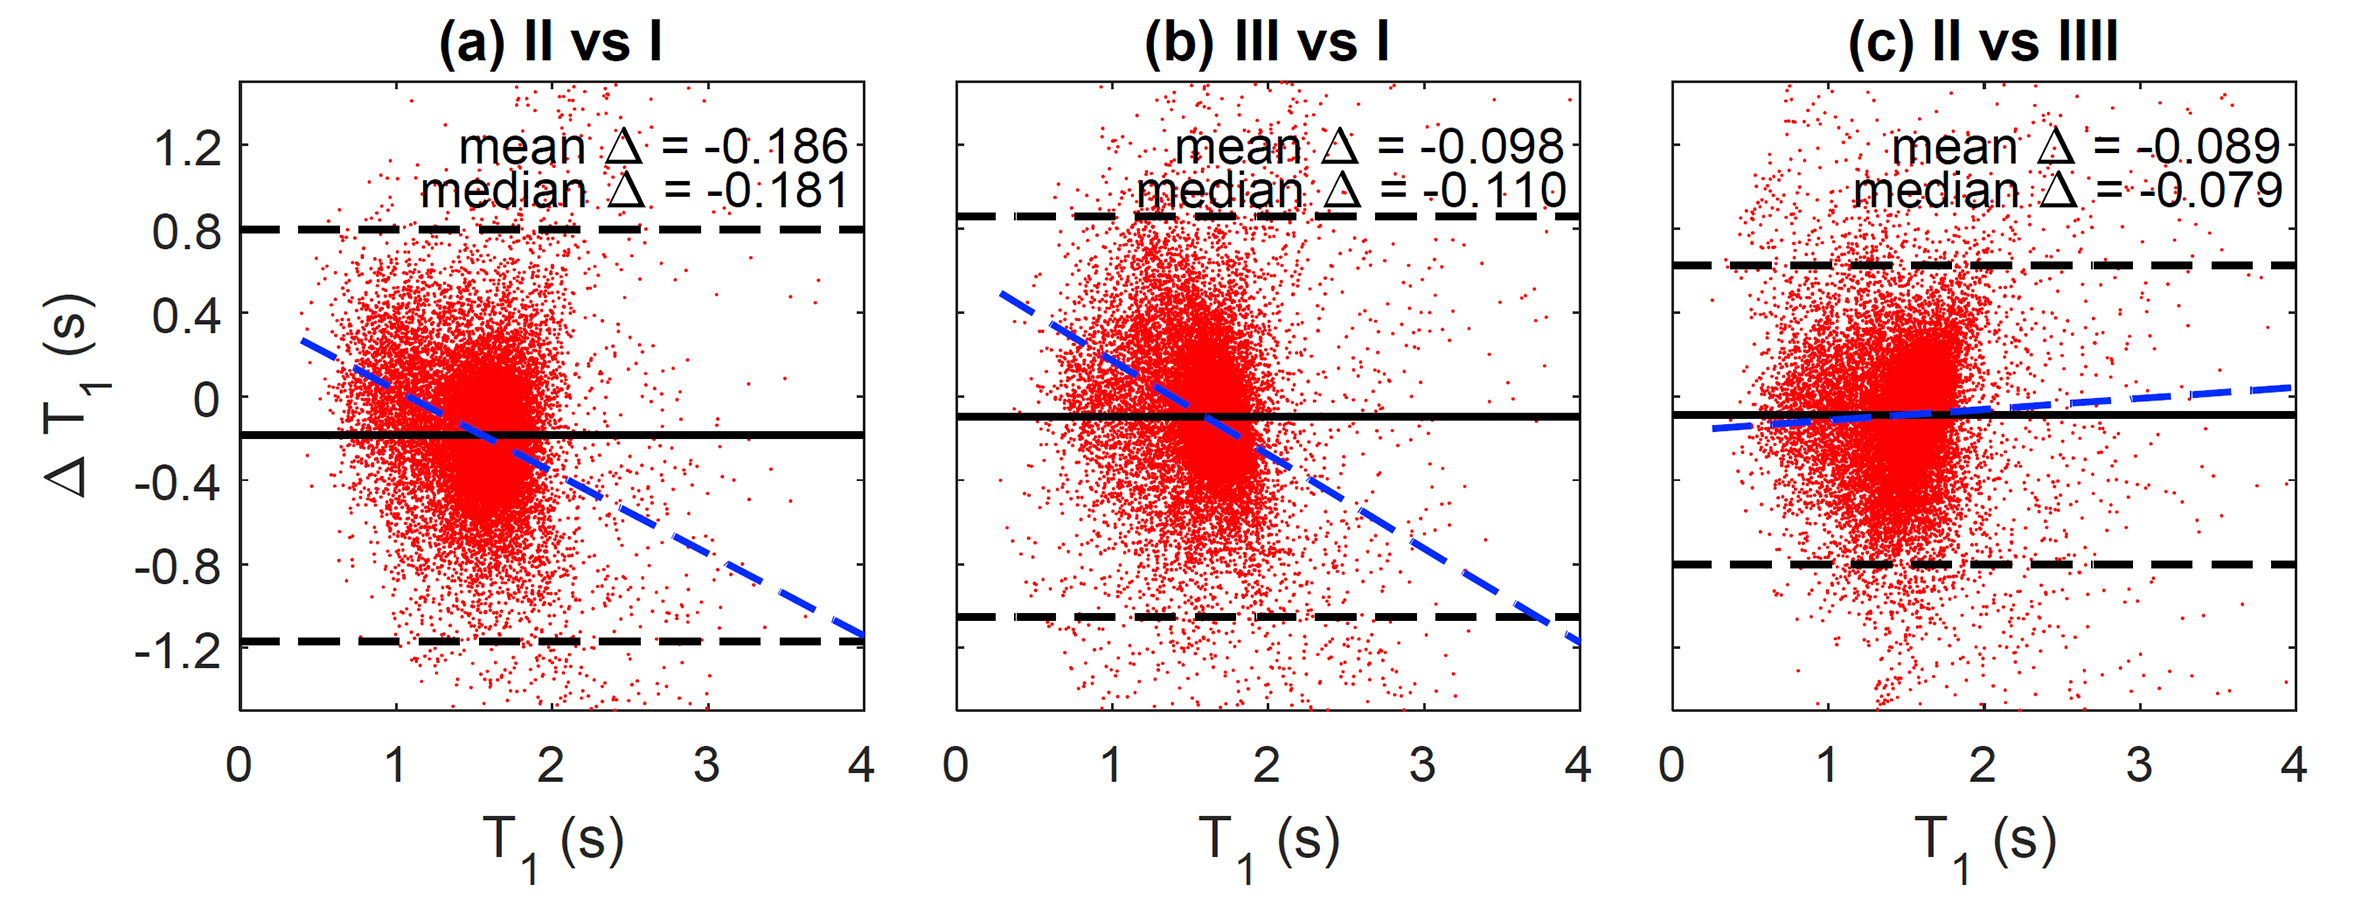
Figure 3. Bland-Altman plots comparison between the
methods. (a) Method II .vs. method I; (b) Method III .vs. method I and (c)
Method II .vs. method III.

Table 1. Three T1
map acquisition methods used in this study.