4708
Diffusion kurtosis imaging features of renal cell carcinoma: a preliminary study1Northern Jiangsu People’s Hospital, Yangzhou, China, 2GE Healthcare, Beijing, China
Synopsis
We aimed to investigate if diffusion kurtosis imaging (DKI) can be applied to differentiate different types of renal cell carcinoma (RCC). For MD, a significant higher value was shown in CCRCC (3.12±0.26) than the rest RCCs (1.03±0.25 for PRCC, 1.78±0.31 for ChRCC and 1.68±0.30 for CDC, p<0.05). For MK,KA and RK, a significant higher value was shown in PRCC (1.52±0.27, 1.93±0.36, 1.21±0.37) than the rest RCCs (1.16±0.23 1.29±0.26, 0.83±0.31 for ChRCC; 0.88±0.21, 1.19±0.33, 0.62±0.29 for CDC and 0.41±0.09, 0.53±0.13, 0.36±0.10 for CCRCC, p<0.05).
Introduction
Some research demonstrated the feasibility of diffusion kurtosis imaging (DKI) in the human kidney. [1] These studies however, did not include patients with renal diseases. To study this, our aims were thus to evaluate the feasibility of DKI in differentiating different types of renal cell carcinoma (RCC).Materials and Methods
SubjectsIn total, 71 patients (mean age: xxx) were recruited in this study. Of them, 46 patients were with clear cell RCC (CCRCC), 10 with papillary RCC (PRCC), 8 with chromophobe RCC (ChRCC), and 7 with collecting duct carcinoma (CDC). All patients were examined with DKI technique for kidney imaging.
MRI experiment
All MRI experiments were performed on a 3.0 T clinical scanner (Discovery 750w, GE Healthcare, USA) equipped with a a GEM-flex 16-chanels surface-coil. For DKI measurement, two b values of 500 and 1000 s/mm2 with 30 diffusion directions for each b value were adopted. echo time (TE) = 59.2 ms, repetition time (TR) = 5000 ms, number of excitations (NEX=2), matrix = 192 ×192, field of view (FOV) = 400 mm. ASSET as a parallel imaging method was applied with an acceleration factor of 2.
Data analysis
All DKI data were processed with a vendor-provided software at a GE workstation (AW 4.6 GE Medical Systems). The acquired DKI images were fitted voxel-by-voxel using equation 1: $$ S=S0·exp(-b·D+b2·D2 . k/6 ). $$ , where b is the applied b value, D represents the apparent diffusion coefficient derived from non-Gaussian diffusion and K represents apparent kurtosis coefficient. The resultant DKI derived parametric maps were generated, including Mean Diffusivity (MD), fractional Anisotropy (FA), mean kurtosis (MK), kurtosis anisotropy (KA) and radial kurtosis (RK).
Statistical Analysis
Statistical analysis was performed using SPSS version 17.0 statistical software (SPSS, Chicago, IL, USA). Numeric data were expressed as means ± standard deviations (SD). Each DKI derived parameters were compared between different RCC types by applying analysis of variance (ANOVA) and post-hoc test (Tukey). Values of P <0.05 were considered statistically significant.
Results
The mean SNRs of DKI images at b =0, 500 and 1000 s/mm2 were 32.8±2.9, 14.2±2.1 and 9.1±1.8, respectively. For MD,a significant higher value was shown in CCRCC (3.12±0.26, Fig.a) than the rest renal tumors {1.03±0.25 for PRCC(Fig.b), 1.78±0.31 for ChRCC(Fig.c) and 1.68±0.30 for CDC(Fig.d), p<0.05}. In addition, both ChRCC and CDC have larger MD values than PRCC (both p<0.05), while comparable MD values were found between ChRCC and CDC (p>0.05). For MK,KA and RK, significant higher values were respectively shown in PRCC (1.52±0.27, 1.93±0.36, 1.21±0.37) than the rest renal tumors (0.41±0.09, 0.53±0.13, 0.36±0.10 for CCRCC; 1.16±0.23 1.29±0.26, 0.83±0.31 for ChRCC and 0.88±0.21, 1.19±0.33, 0.62±0.29 for CDC, p<0.05). In addition, both ChRCC and CDC have larger MK, KA and RK values than CCRCC (all, p<0.05). PRCC has larger MK, KA and RK values than ChRCC (p<0.05). In comparison, comparable MK, KA values were found between ChRCC and CDC (p>0.05), except for RK values between ChRCC and CDC (p<0.05). Using MD values of 2.13 as the threshold to differentiate CCRCC from other RCC types, the best result obtained had a sensitivity of 92.6% and specificity of 89.8%. Using MK, KA and RK values of 1.19, 1.59 and 1.01 as the thresholds for differentiating PRCC from other RCC types, the best result obtained had a sensitivity of 89.7%, 85.6% and 90.7%, and specificity of 89.8%, 86.6 and 86.0%.Discussion
As shown in this study, the MD values were highest for CCRCC and lowest for PRCC (P<0.05). Many studies consider that higher MD is attributed to higher cellularity. [2] PRCC showed greater MK, KA and RK values than CCRCC, ChRCC and CDC (P<0.05). Tissue structure can influence MK, KA and RK. [3] The increased MK, KA and RK values are likely caused by increasing viscosity in the tissue. Conclusion: In conclusion, our initial results demonstrated the clinical feasibility of DKI in differentiating different renal cell carcinoma diseases, given an adequate SNR of DKI images.Acknowledgements
References
[1]. Huang Y, Chen X, Zhang Z, et al. MRI quantification of non-Gaussian water diffusion in normal human kidney: a diffusional kurtosis imaging study. NMR Biomed. 2015; 28:154-161
[2]. Minervini A, Di Cristofano C, Gacci M. Prognostic role of histological necrosis for nonmetastatic clear cell renal cell carcinoma: correlation with pathological features and molecular markers. J Urol 2008; 180: 1284-1289
[3]. Inoue T, Ogasawara K, Beppu T, et al. Diffusion tensor imaging for preoperative evaluation of tumor grade in gliomas . Clin Neurol Neurosurg 2005; 107: 174-180
Figures

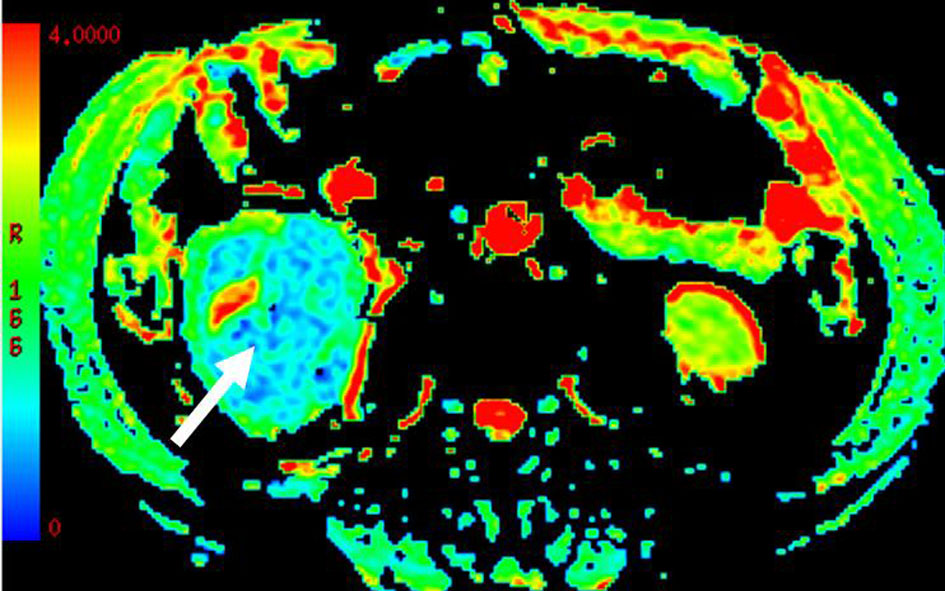
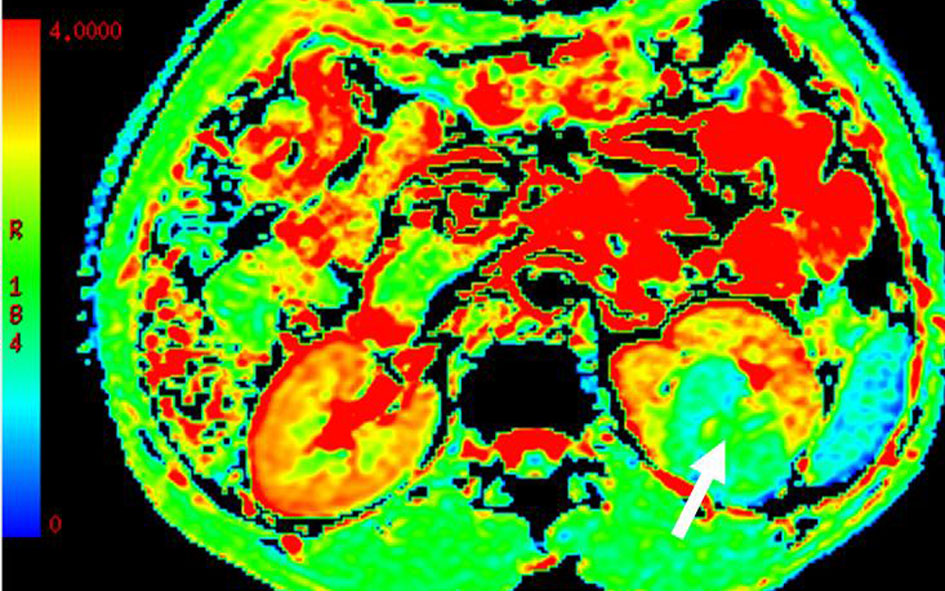

Fig.d
Fig (a-d): MD features of CCRCC (a), PRCC (b), ChRCC (c) and CDC(d), respectively. A significant higher value was shown in CCRCC 3.09±0.22 han the rest renal tumors (0.97±0.19 for PRCC, 1.71±0.26 for ChRCC and 1.66±0.27 for CDC).