4705
3D High Resolution T1 and T2 Mapping at Ultrahigh Fields Using Magnetic Resonance Fingerprinting1Department of Biomedical Engineering, Case Western Reserve University, Cleveland, OH, United States, 2High Magnetic Field Laboratory, Chinese Academy of Sciences, Hefei, China, 3Department of Radiology, Case Western Reserve University, Cleveland, OH, United States, 4Department of Radiology, University of Michigan, Ann Arbor, MI, United States, 5Cleveland Clinic Pre-Clinical Magnetic Resonance Imaging Center, Cleveland Clinic Foundation, Cleveland, OH, United States, 6Department of Physiology and Biophysics, Case Western Reserve University, Cleveland, OH, United States
Synopsis
This study demonstrates the development of a 3D T2-prepared MRF sequence, in combination with a stack-of-spirals trajectory, for simultaneous T1 and T2 mapping of an ex vivo macaque monkey (Macaca mulatta) brain with a voxel size of 0.35x0.35x1 mm3. Retrospective evaluation of the undersampling accuracy showed that, for an undersampling rate of up to 16, the normalized root mean square error was within 6% and 15% in T1 and T2 mapping, respectively. These results suggest that 3D simultaneous T1 and T2 mapping can be in <30 min with unprecedented spatial resolution.
Introduction
Magnetic resonance fingerprinting (MRF) provides the opportunity for simultaneous, multiparametric mapping with drastically undersampled data. Previously we have developed a 2D FISP-based MRF method for preclinical applications at high-fields. It allowed simultaneous T1 and T2 mapping in mouse brain with 156-µm in-plane resolution in 2 min acquisition time. However, the method is sensitive to errors in B1 calibration. Hence, for imaging larger animals such as primates, the accuracy of parameter estimation can be compromised due to B1 field inhomogeneity. In a recent study, Hamilton et al1 developed a T2-prepared MRF method that used small flip angles to achieve B1 insensitivity. In this study, we aimed to evaluate the accuracy of using T2-prepared MRF method for 3D high-resolution T1 and T2 mapping in monkey brain at ultrahigh field.Methods
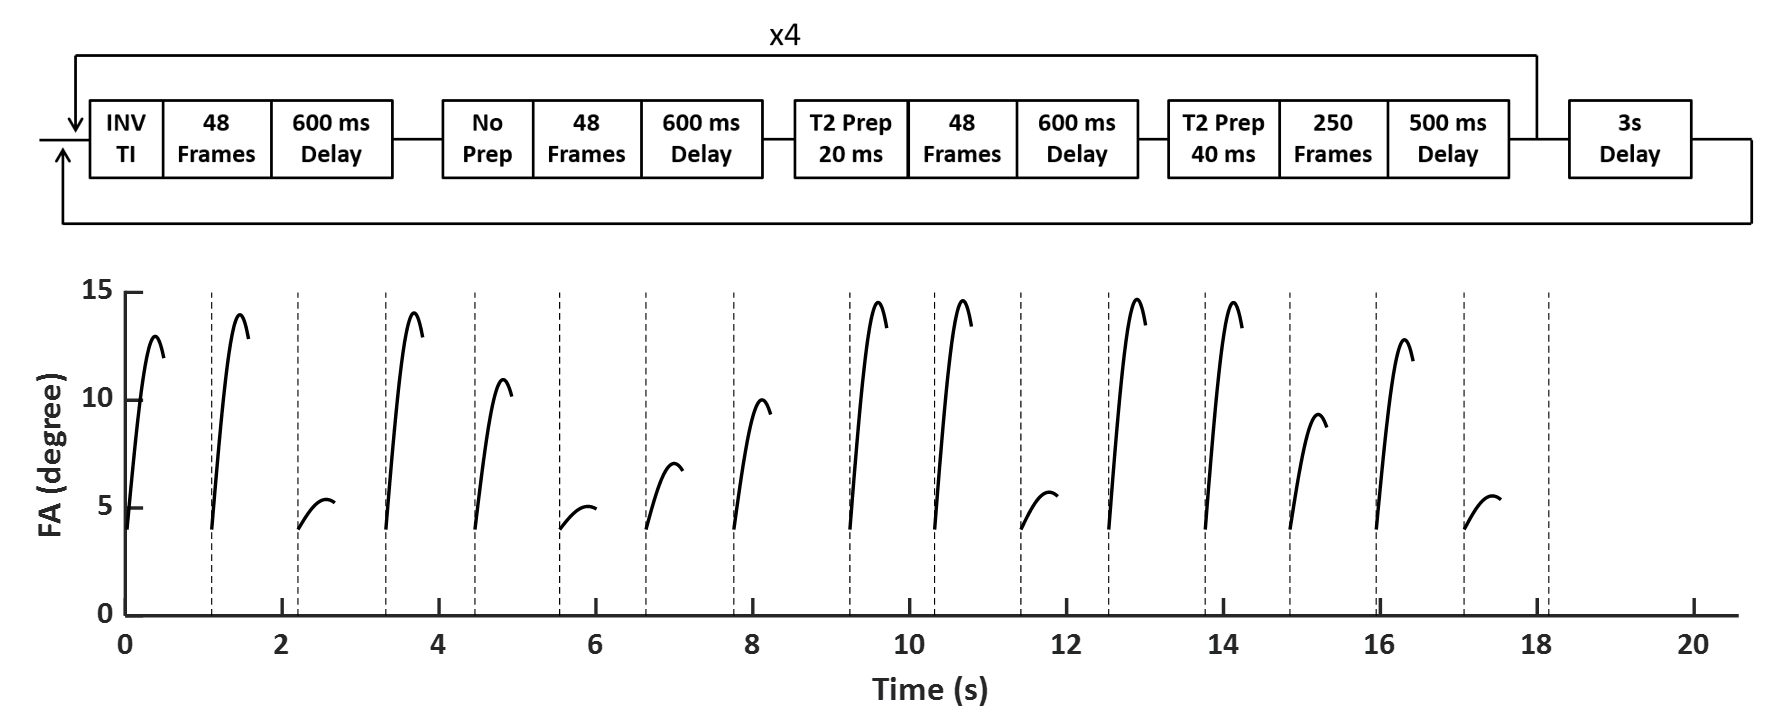
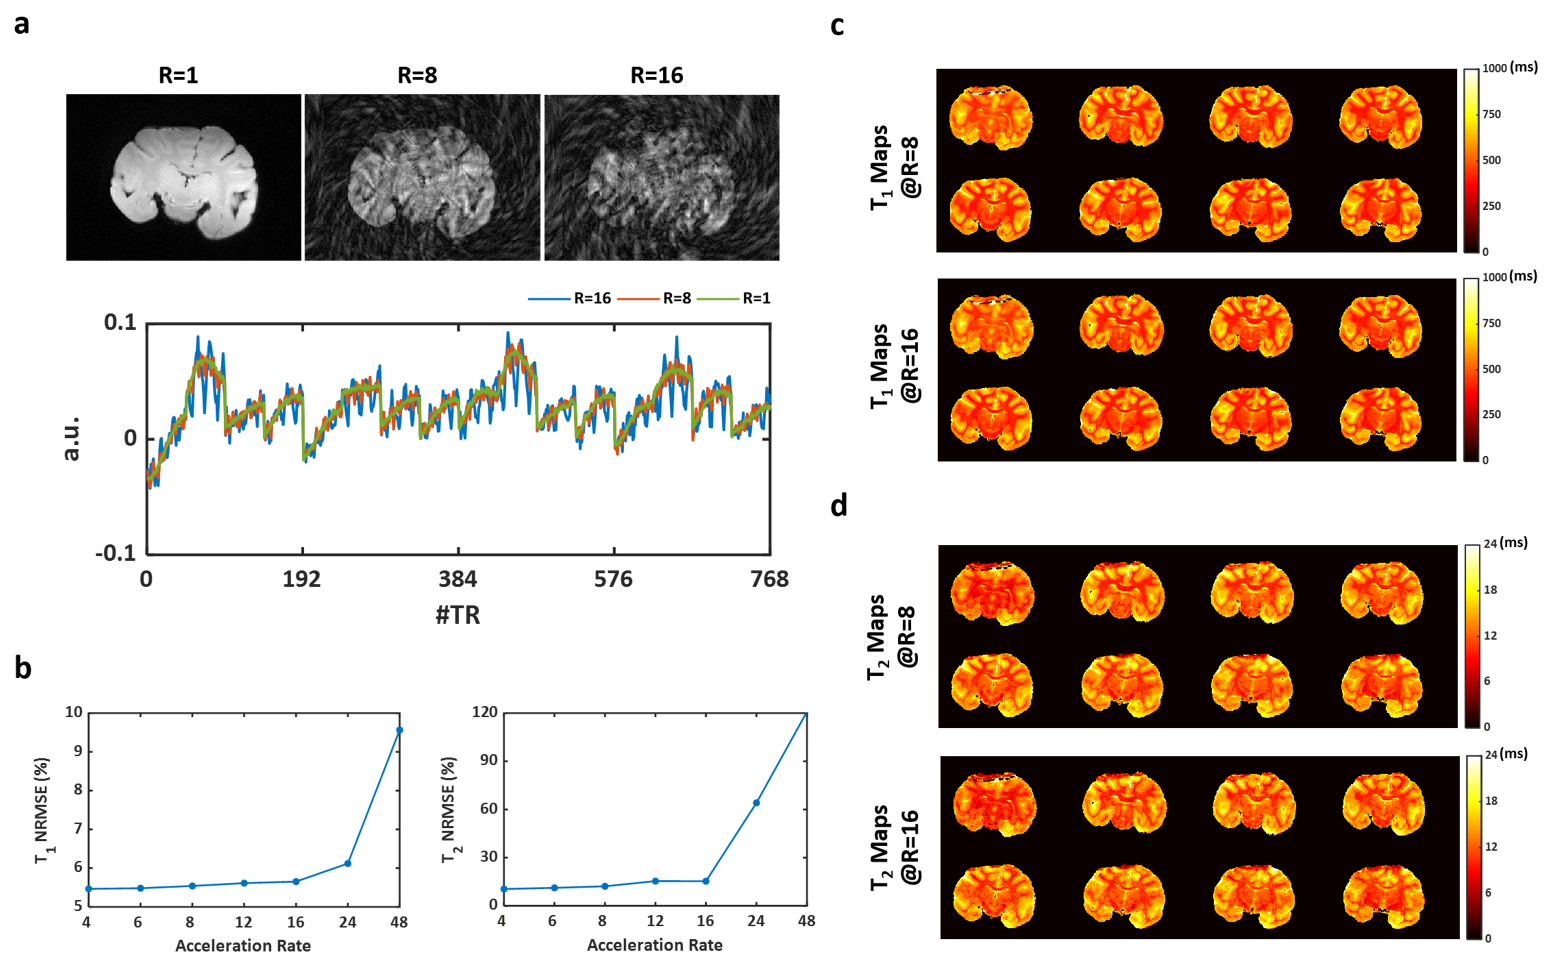
MRF Sequence: Fig. 1 shows the FISP-based, T2-preprared MRF sequence used in the current study. The sequence consisted of the acquisition of 768 frames partitioned into 16 segments (48 frames/segment). 4 segments were preceded by an inversion pulse and 8 segments were preceded by a T2-preparation module with the mixing time alternating between 20 and 40 ms. The flip angle in each segment was ramped up sinusoidally from 4° to a maximal value between 6° and 15°. A 600-ms delay was applied between each segment to allow partial signal recovery. Data acquisition used constant TE and TR of 1.7 and 10 ms, respectively. A 4π dephasing per voxel was applied along the slice-selective direction. Total acquisition time of a single fingerprint was ~20 s.Ex Vivo Imaging Study: The MRF method was evaluated in ex vivo imaging of brain tissue from macaque monkey (Macaca mulatta). 3D MRF data were acquired using a stack-of-spirals trajectory. A variable density spiral readout trajectory was designed to fully sample the inner 20x20 k-space with 48 interleaves and the entire k-space with 96 interleaves. The FOV and matrix size were 90x90x8 mm3 and 256x256x8, respectively, yielding a nominal voxel size of 0.35x0.35x1 mm3. A fully sampled dataset was acquired in ~4.3 hours. T1 and T2 maps were obtained from retrospectively undersampled data in the readout plane with an undersampling rate of up to 16. The accuracy of T1 and T2 mapping using undersampled data were compared to that using fully sampled data by calculating the normalized root mean square error (NRMSE).
Results
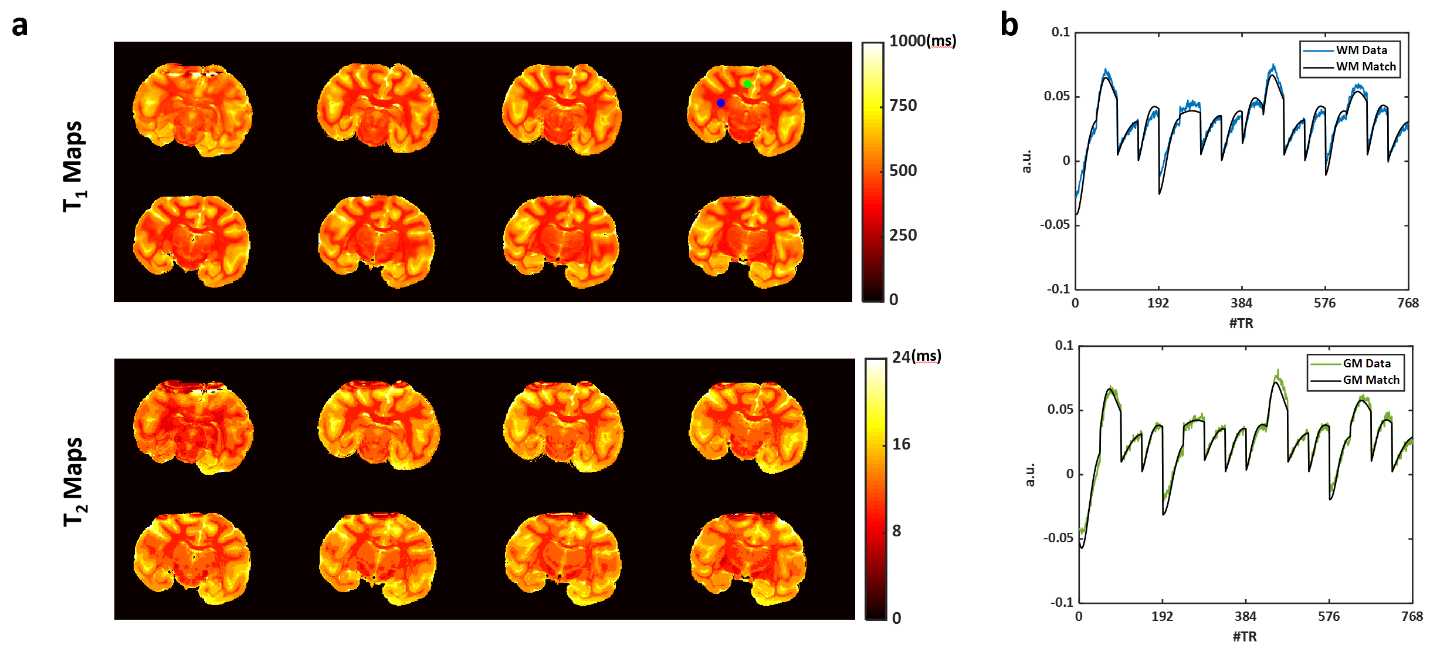
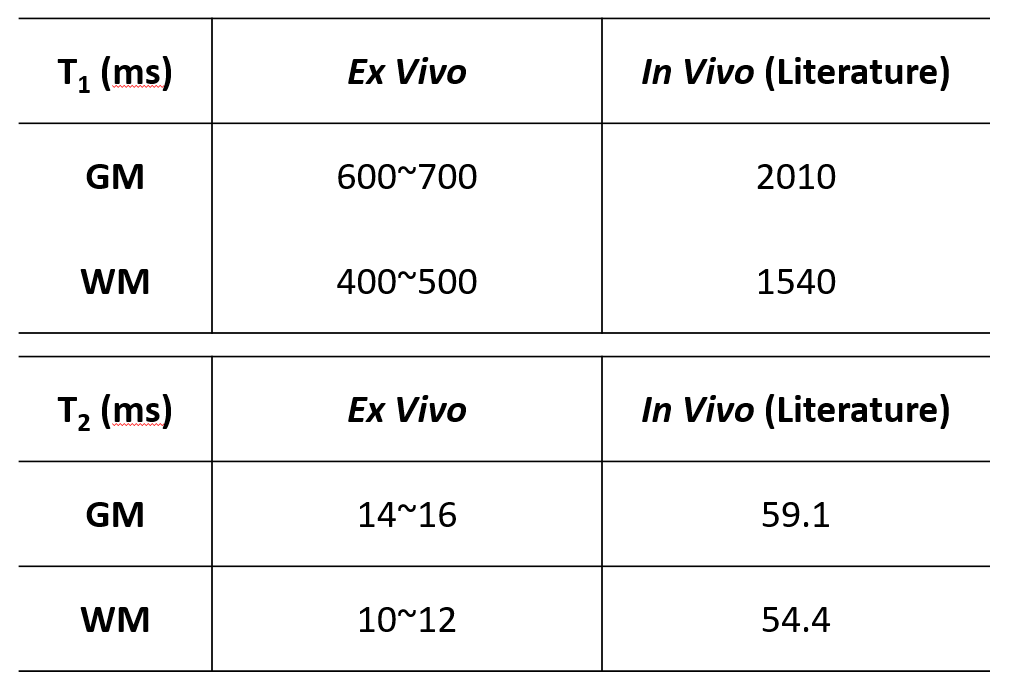
3D T1 and T2 Mapping: Results of T1 and T2 mapping from fully sampled MRF data are shown in Fig. 2. A large field inhomogeneity was observed at the ventral side of the brain, causing a visible distortion to the T2 map. With a nominal spatial resolution of 0.35x0.35x1 mm3, both T1 and T2 maps showed clear distinction between the white and gray matters. Comparing to in vivo results published in literature2 (Table 1), T1 in the ex vivo brain was significantly lower, ranging from 600 to 700 ms in the gray matter, and from 400 to 500 ms in the white matter. T2 ranged from 14 to 16 ms in gray matter and from 10 to 12 ms in white matter, which was also significantly shorter than T2 values in vivo.Undersampling Capacity: T1 and T2 mapping from retrospectively undersampled data are shown in Fig. 3. NRMSE remained within 6% and 15% for T1 and T2 mapping, respectively, with an undersampling rate of up to 16 (Fig. 3b). T1 and T2 maps generated from 8- and 16-fold undersampled data are shown in Fig. 3c-d. With 16-fold undersampling, the acquisition time can be significantly reduced to 2 min/slice.
Conclusion and Discussion
T2-prepared MRF enabled 3D T1 and T2 mapping of monkey brain at a spatial resolution of 0.35x0.35x1 mm3 with drastically undersampled data. This method provides the opportunity for in vivo parameter mapping at unprecedented spatial resolution with feasible acquisition time.Acknowledgements
This work was supported by a grant from the National Institute of Health (R01 EB23704).References
1. Hamilton JI, Jiang Y, Chen Y, Ma D, Lo W-C, Griswold M, Seiberlich N. MR fingerprinting for rapid quantification of myocardial T1 , T2 , and proton spin density. Magn Reson Med. 2017;77:1446–1458.
2. Pfeuffer J, Merkle H, Beyerlein M, Steudel T, Logothetis NK. Anatomical and functional MR imaging in the macaque monkey using a vertical large-bore 7 Tesla setup. 2004;22:1343–1359.
3. Ma D, Jiang Y, Chen Y, McGivney D, Mehta B, Gulani V, Griswold M. Fast 3D magnetic resonance fingerprinting for a whole-brain coverage. Magn Reson Med. 2018;79:2190–2197.
Figures