4701
Fibre specific tract profiles of children with ADHD: Evidence from fixel-based analysis
Ian Fuelscher1, Emma Sciberras1,2,3, Daryl Efron2,3,4, Vicki Anderson4,5, Christian Hyde1, and Timothy J Silk1,4,5
1School of Psychology, Deakin University, Geelong, Australia, 2Population Health, Murdoch Children's Research Institute, Melbourne, Australia, 3Department of Paediatrics, University of Melbourne, Melbourne, Australia, 4The Royal Children's Hospital, Melbourne, Australia, 5Clinical Sciences, Murdoch Children's Research Institute, Melbourne, Australia
1School of Psychology, Deakin University, Geelong, Australia, 2Population Health, Murdoch Children's Research Institute, Melbourne, Australia, 3Department of Paediatrics, University of Melbourne, Melbourne, Australia, 4The Royal Children's Hospital, Melbourne, Australia, 5Clinical Sciences, Murdoch Children's Research Institute, Melbourne, Australia
Synopsis
Diffusion tensor imaging (DTI) studies examining white matter microstructure in children with attention-deficit/hyperactivity disorder (ADHD) have provided conflicting results, possibly reflecting limitations of the DTI framework. We leverage fixel-based analysis (FBA), a fibre specific assessment of white matter microstructure, to comprehensively evaluate white matter tract profiles of children with ADHD. Relative to controls, children with ADHD show both reduced fibre density and reduced fibre cross section across association, projection and commissural fibres. FBA metrics further correlate with ADHD symptom severity. We conclude that ADHD symptomatology in childhood may be subserved by altered communication pathways across the brain.
Introduction
Diffusion tensor imaging (DTI) has provided valuable evidence that white matter microstructure may be atypical (relative to controls) in children with Attention-deficit/hyperactivity disorder (ADHD). However, findings have been inconsistent1,2. This is unsurprising given that voxel-averaged DTI metrics are not fibre specific and difficult to interpret, particularly in crossing-fibre areas that constitute most of the brain’s white matter3,4. To this end, the aim of the present study was to comprehensively evaluate tract profiles of white matter microstructure in children with and without ADHD using fixel-based analysis (FBA)4, a novel and powerful fibre specific analysis framework that allows for assessment of white matter quantitative measures in the presence of complex fibre populations.Methods
Participants. This study reports on an Australian community sample of 144 children aged 9-11 years. Diagnostic status was confirmed with the NIMH Diagnostic Interview for Children-IV, resulting in 76 children with diagnostically confirmed ADHD (56 male; mean age = 10.4, age range = 9.4 to 11.5 years) and 68 non-ADHD control participants (38 male; mean age = 10.4, age range = 9.6 to 11.9 years). Parent report of the Conners 3 ADHD index5 was used to assess ADHD symptom severity.Acquisition and processing. MR scanning was conducted using a 3T Siemens Tim Trio MRI scanner. High angular resolution diffusion imaging (HARDI) data were acquired using the following protocol: b = 2800 s/mm2, 60 directions, TR/TE = 3200/110 ms, voxel-size = 2.4 mm3 isotropic, with four interleaved b = 0 volumes. DWI images were pre-processed in MRtrix3 (v. 2b8e7d0c) using steps from a recommended FBA pipeline4,6. Pre-processing included denoising, eddy-current correction motion correction and bias field correction. We subsequently applied single-shell constrained spherical deconvolution (CSD)7 and population-specific fibre orientation distribution (FOD) based registration to derive subject per-fixel FBA quantitative metrics using a recommended MRtrix3 pipeline4,6.
Tractography. We initially reconstructed a comprehensive set of 72 white matter tracts using TractSeg (v. 2.1)8,9, a semi-automated tractography algorithm that uses probabilistic tractography on tract specific FOD function peaks to create bundle specific tractograms (see Figure 1). These tracts were subsequently combined across hemispheres and structures, resulting in a final set of 19 tracts. TractSeg was applied to the study specific population template and white matter tracts were then converted to tract specific fixel maps for each participant as per the conventional FBA metrics4, including fibre density (a microscopic estimate of axon density within a fibre population, FD) and fibre cross-section (a morphological measure of the macroscopic change in cross-sectional area during template registration, FC).
Statistical analysis. To evaluate differences in tract profiles between children with and without ADHD, we compared each fixel metric between groups using a General Linear Model10. For each tract, we performed connectivity-based smoothing and statistical inference using connectivity-based fixel enhancement12. Family-wise error (FWE) corrected p-values were then computed for each fixel using non-parametric permutation testing. To examine the dimensional association between white matter properties and ADHD symptom severity, we selected all fixels that showed altered white matter properties (as per the FBA metrics) in children with ADHD and subsequently correlated the corresponding fixel metric with scores from the Conners 3 ADHD index. We covaried for age and sex across all analyses. In light of recent evidence that FC may be influenced by anatomical differences in head size11, analyses involving FC were further adjusted for intracranial volume (ICV).
Results
Children with ADHD displayed altered tract profiles across several white matter pathways. Figure 2 shows tract specific streamline segments that had a significant decrease in FD in the ADHD group. Significant decreases were observed across association (inferior longitudinal fasciculus, inferior occipito-frontal fasciculus) and projection fibres (cortico-spinal tract, fronto-pontine tract). Individual differences in FD were associated with ADHD symptom severity in each of these tracts. With respect to differences in FC (see Figure 3), analyses highlighted reduced FC in the ADHD group across association (uncinate fasciculus), commissural (commissure anterior) and projection fibres (corticospinal tract, parieto-occipital pontine tract). Individual differences in FC were associated with ADHD symptom severity in the uncinate fasciculus only. Importantly, analysis demonstrated both shared (across tracts) and tract specific fixels showing white matter alterations in children with ADHD (see Figure 4).Discussion
Results support the view that white matter organisation of several well-known association and projection pathways may be reduced in children with ADHD. Results further indicate that decreased white matter microstructure may be associated with ADHD symptom severity along these pathways. Based on the assumption that decreased FD/FC may reflect reduced transfer of information across the brain4, these findings are consistent with the possibility that altered communication between different regions of the brain may be associated with ADHD symptomatology in childhood.Conclusion
This has been the first study to comprehensively evaluate white matter tract profiles of children with ADHD using fixel-based diffusion metrics. Findings significantly enhance our understanding of the neurobiological basis of ADHD in childhood and provide an important step towards fibre specific mapping of white matter microstructural properties in ADHD. Future research should evaluate white matter tract profiles in ADHD longitudinally and model the degree to which changes in white matter microstructure may be associated with developmental changes in the symptom profile of ADHD.Acknowledgements
We would like to thank the families and children enrolled in the NICAP study for their time and participation. We would also like to thank the contributions of Michael Kean for implementing advances in imaging acquisition at the Royal Children's Hospital, Parkville, Australia.References
- van Ewijk H, Heslenfeld DJ, Zwiers MP, Buitelaar JK, Oosterlaan J. Diffusion tensor imaging in attention deficit/hyperactivity disorder: a systematic review and meta-analysis. Neuroscience & Biobehavioral Reviews. 2012 Apr 1;36(4):1093-106.
- Aoki Y, Cortese S, Castellanos FX. Research Review: Diffusion tensor imaging studies of attention‐deficit/hyperactivity disorder: meta‐analyses and reflections on head motion. Journal of Child Psychology and Psychiatry. 2018 Mar;59(3):193-202.
- Farquharson S, Tournier JD, Calamante F, Fabinyi G, Schneider-Kolsky M, Jackson GD, Connelly A. White matter fiber tractography: why we need to move beyond DTI. Journal of Neurosurgery. 2013 Jun 1;118(6):1367-77.
- Raffelt DA, Tournier JD, Smith RE, Vaughan DN, Jackson G, Ridgway GR, Connelly A. Investigating white matter fibre density and morphology using fixel-based analysis. Neuroimage. 2017 Jan 1;144:58-73.
- Conners CK. Conners 3. MHS.
- Tournier JD, Smith R, Raffelt D, Tabbara R, Dhollander T, Pietsch M, Christiaens D, Jeurissen B, Yeh CH, Connelly A. MRtrix3: A fast, flexible and open software framework for medical image processing and visualisation. Neuroimage. 2019 Aug 29:116137.
- Tournier JD, Calamante F, Connelly A. Robust determination of the fibre orientation distribution in diffusion MRI: non-negativity constrained super-resolved spherical deconvolution. Neuroimage. 2007 May 1;35(4):1459-72.
- Wasserthal J, Neher P, Maier-Hein KH. Tractseg-fast and accurate white matter tract segmentation. NeuroImage. 2018 Dec 1;183:239-53.
- Wasserthal J, Neher P, Hirjak D, Maier-Hein KH. Combined tract segmentation and orientation mapping for bundle-specific tractography. Medical Image Analysis. 2019 Dec;101559.
- Winkler AM, Ridgway GR, Webster MA, Smith SM, Nichols TE. Permutation inference for the general linear model. Neuroimage. 2014 May 15;92:381-97.
- Smith R, Dhollander T, Connelly, A. On the regression of intracranial volume in Fixel-Based Analysis. Proceedings of the ISMRM. 2019, 3385.
- Raffelt DA, Smith RE, Ridgway GR, Tournier JD, Vaughan DN, Rose S, Henderson R, Connelly A. Connectivity-based fixel enhancement: Whole-brain statistical analysis of diffusion MRI measures in the presence of crossing fibres. Neuroimage. 2015 Aug 15;117:40-55.
Figures
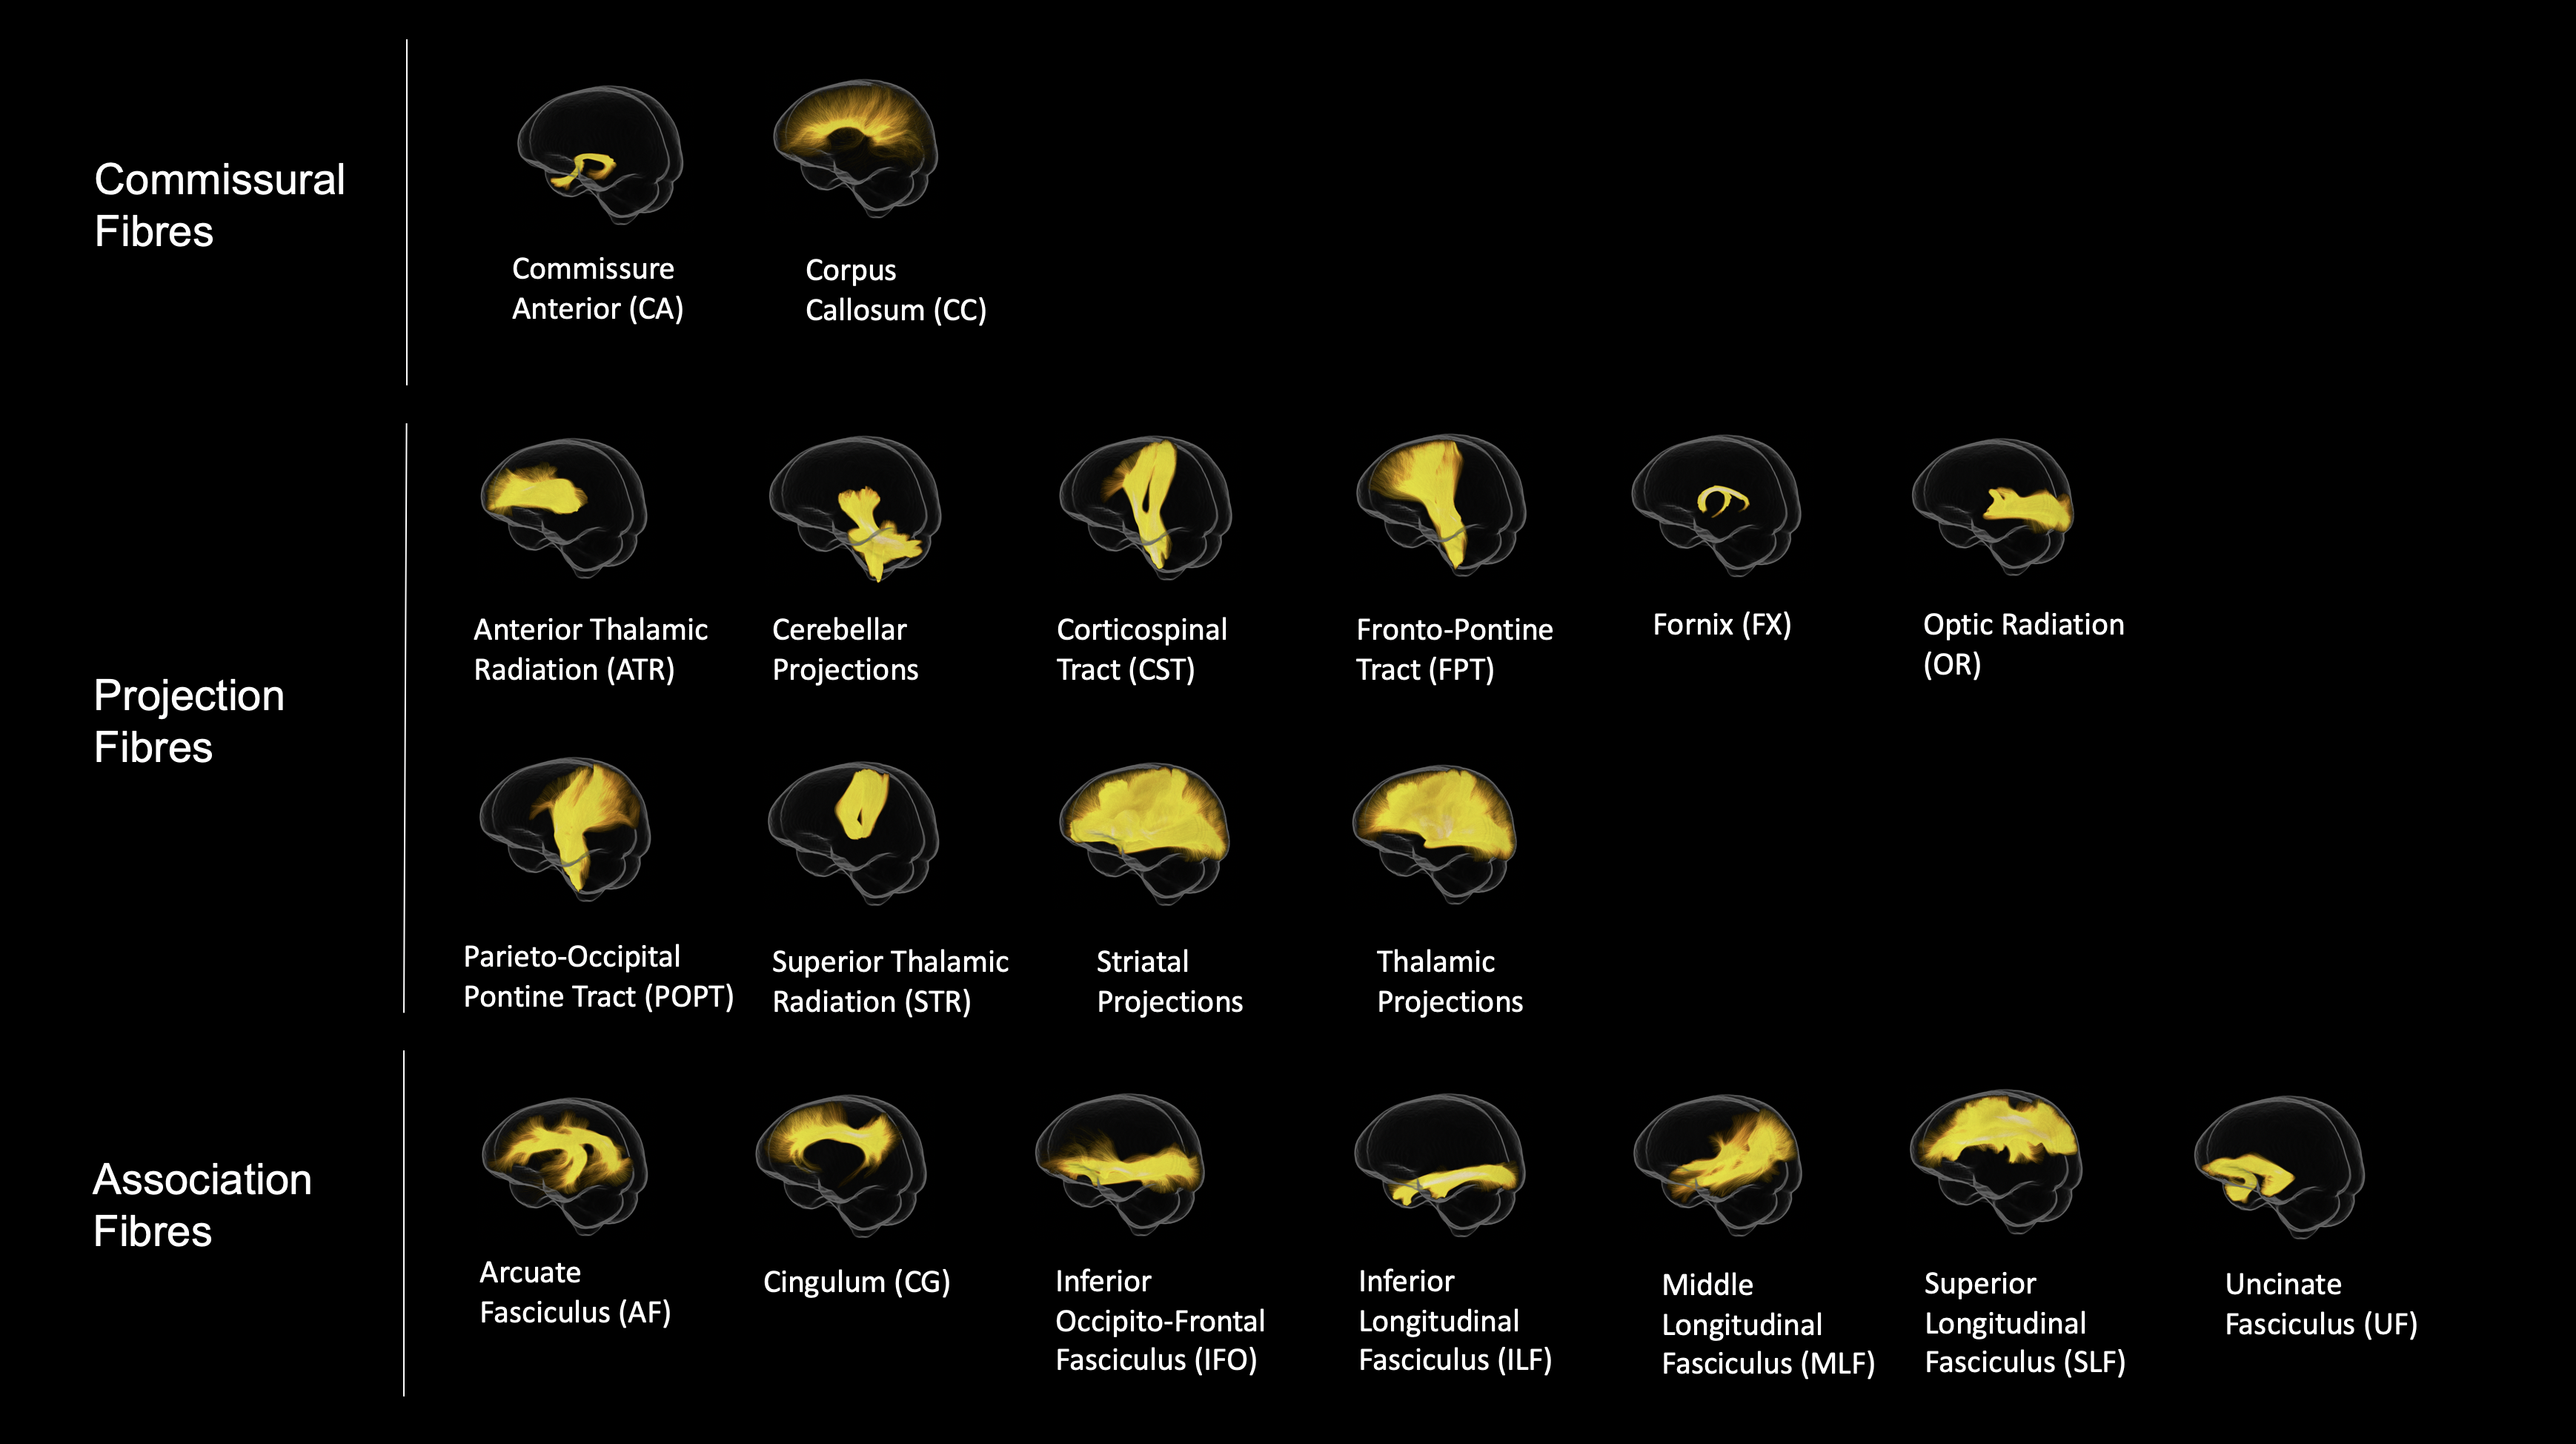
Figure 1. White matter pathways reconstructed using TractSeg (applied to the fibre orientation distribution population template) and visualised in MRtrix3. We initially reconstructed 72 tracts. These tracts were subsequently combined across hemispheres and structures, resulting in a final set of 19 tracts.
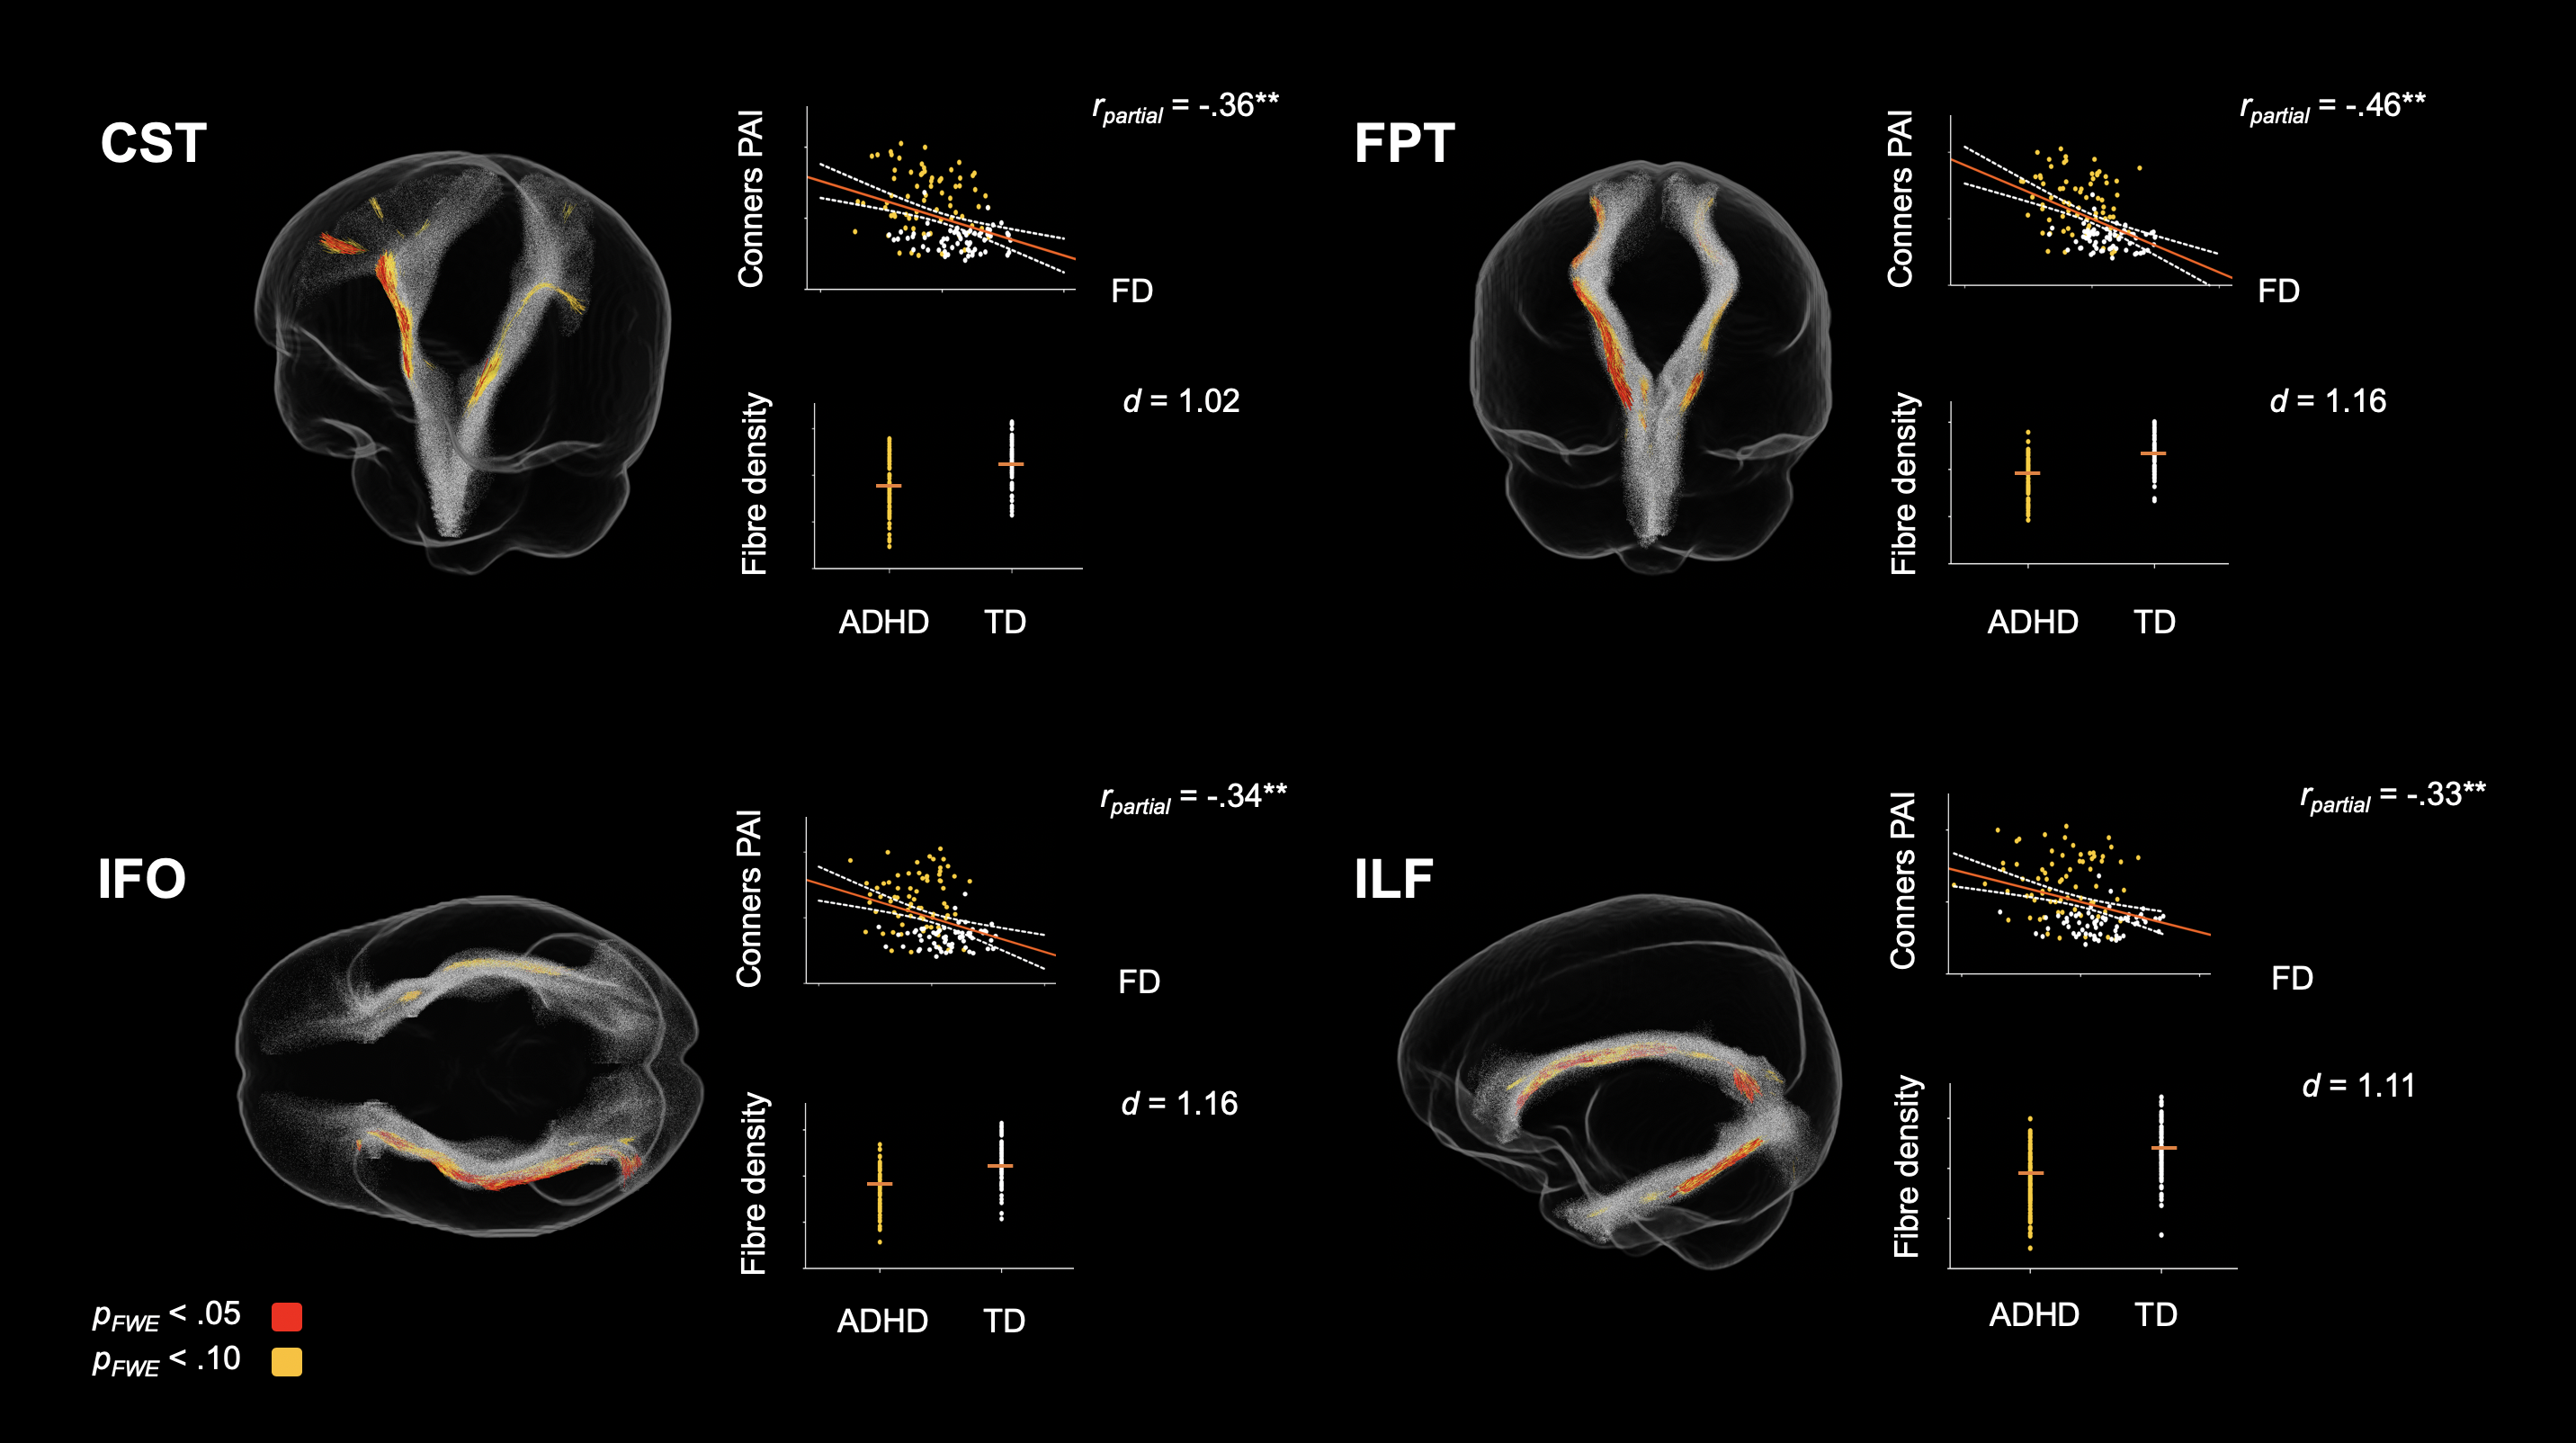
Figure 2. Tract specific streamline segments that showed a significant decrease in fibre density (FD) in the ADHD group. Individual data points (orange bars represent mean FD) and scatterplots showing the dimensional association between FD and ADHD symptom severity are presented next to each tract. All values are adjusted for age and sex. d = Cohen’s d; *p < .05; **p < .01 (FDR corrected).
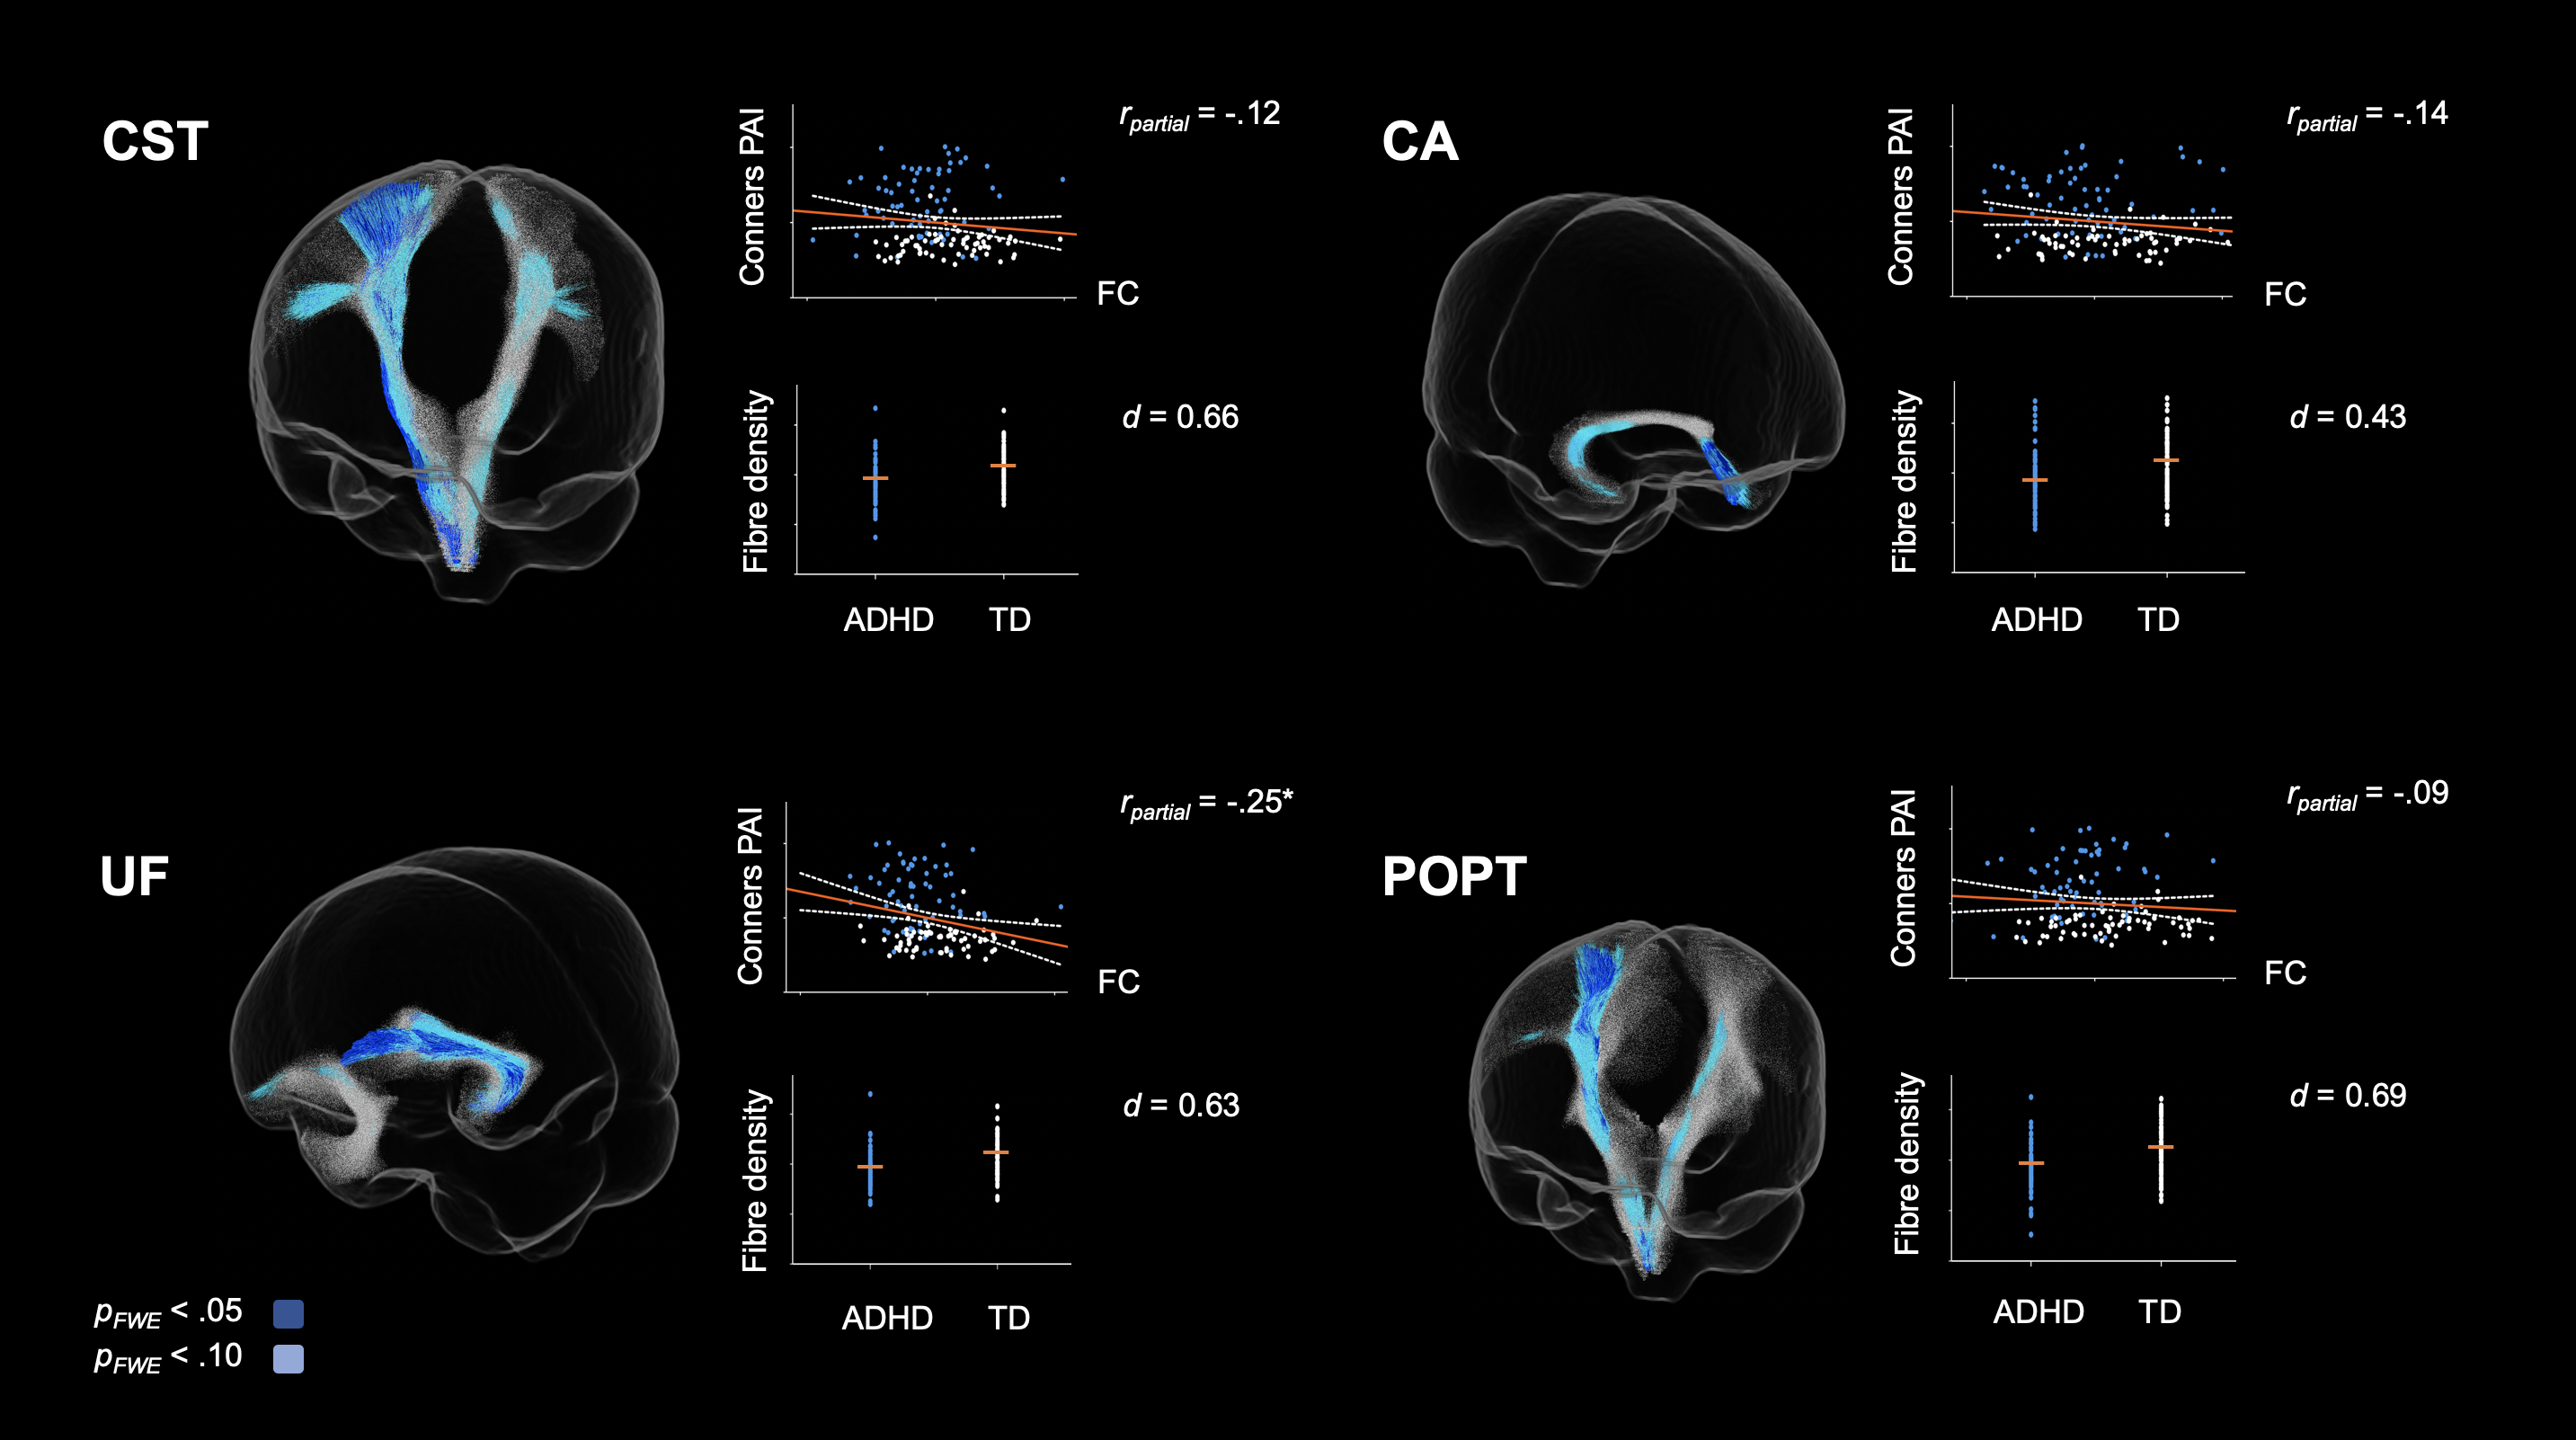
Figure 3. Tract specific streamline segments that showed a significant decrease in fibre cross-section (FC) in the ADHD group. Individual data points (orange bars represent mean FC) and scatterplots showing the dimensional association between FC and ADHD symptom severity are presented next to each tract. All values are adjusted for age, sex and intracranial volume (ICV). d = Cohen’s d; *p < .05; **p < .01 (FDR corrected).
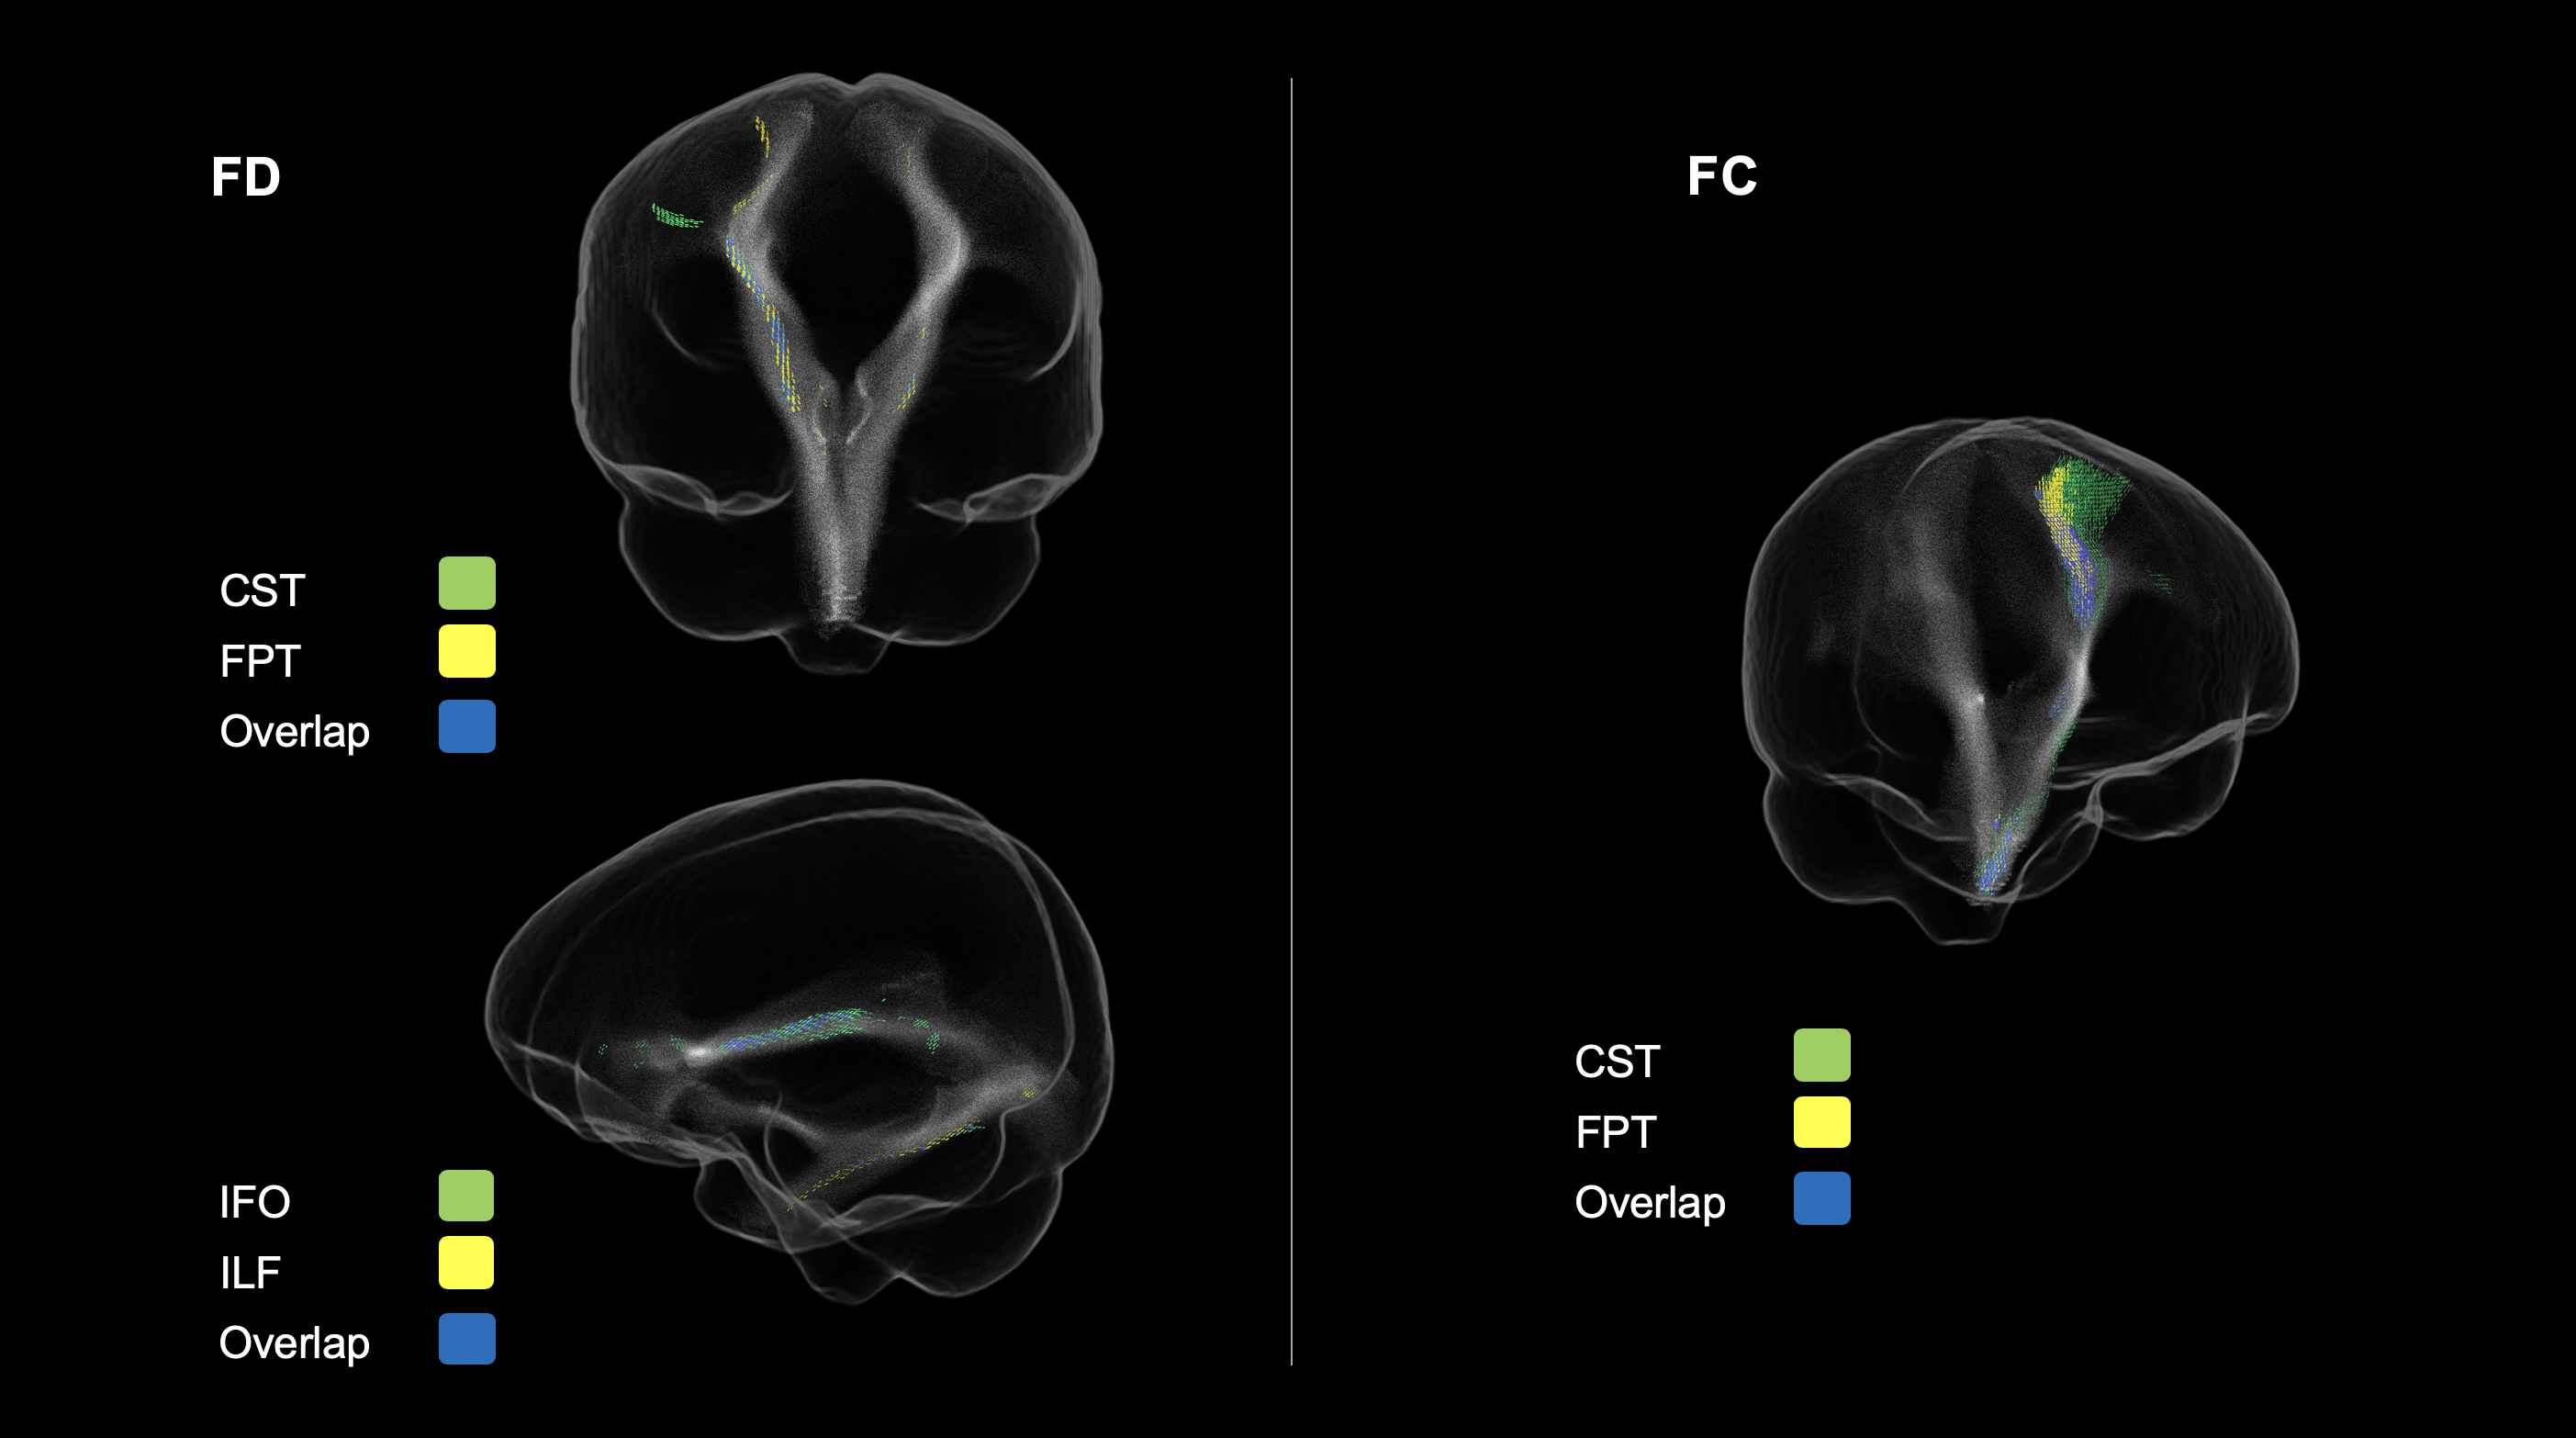
Figure 4. Significant fixels colour-coded according to their corresponding tract. Fixels that corresponded to more than one tract are represented in blue. FD = Fibre density; FC = Fibre cross-section.