4699
Measuring CSF shunt flow with MRI using flow enhancement of signal intensity (Shunt-FENSI)1Department of Bioengineering, University of Illinois at Urbana-Champaign, Urbana, IL, United States, 2Beckman Institute, University of Illinois at Urbana-Champaign, Urbana, IL, United States, 3Department of Electrical & Computer Engineering, University of Illinois at Urbana-Champaign, Urbana, IL, United States, 4Carle Foundation Hospital, Urbana, IL, United States
Synopsis
Ventriculo-peritoneal shunts are used for the treatment of hydrocephalus in pediatric patients. Monitoring the condition of CSF flow through the shunt is vital for identifying possible shunt failure. We propose an MRI-based monitoring technique, Shunt-FENSI, for accurate, quantitative and non-invasive shunt flow measurement. The Shunt-FENSI technique uses pseudocontinuous sub-voxel labeling to build up signal due to flow within a larger imaging voxel. We demonstrate high accuracy in phantom scans, where we match our tagged signal measurement with a simulation which includes tagging, flow, and T1 recovery.
Introduction
Treatment of hydrocephalus in pediatric patients often requires repeated shunt revision since about 50% of shunts that are placed fail within two years.1,2,3 Malfunction due to blockage and infection prevents proper drainage of the cerebrospinal fluid (CSF) and causes a variety of neurological symptoms.4 However, there is no reliable non-invasive method to measure that the flow is obstructed. The purpose of this project is to provide an accurate, quantitative and non-invasive measurement of CSF flow by applying a localized spin tagging technique to image very slow flow (~500 mL/day).Methods
The sequence design of flow enhancement of signal intensity used to measure CSF shunt flow (Shunt-FENSI) is based on the Quantitative Flow Enhancement of Signal Intensity (qFENSI) method.5,6 The qFENSI sequence repeatedly saturates a thin tagging plane in the middle of the imaging slice over a few seconds of time, with pairs of 45° RF pulses, to generate a large build-up of saturated spins to make a tag image. A control image is generated after every tag image by applying a 180° phase shift to the second 45° RF pulse to achieve an effective 0° excitation. Using Echo Planar Imaging (EPI) as the readout method, the sequence is able to rapidly collect data to measure the small tag from the very slow flow.Several changes are required to convert qFENSI to Shunt-FENSI, optimizing the acquisition for imaging coherent flow in a shunt that is very slow. First, the tag spacing, and duration are optimized for the expected flow rates, resulting in a long (8 s) tagging time. Since T1 relaxation rate over this long tagging time will have a large impact, the T1 recovery needed to be taken into account by making a simulation between the signal change and the flow rate (0 ~ 0.4 ml/min). Ten tag/control pairs are acquired in a 3-minute acquisition.
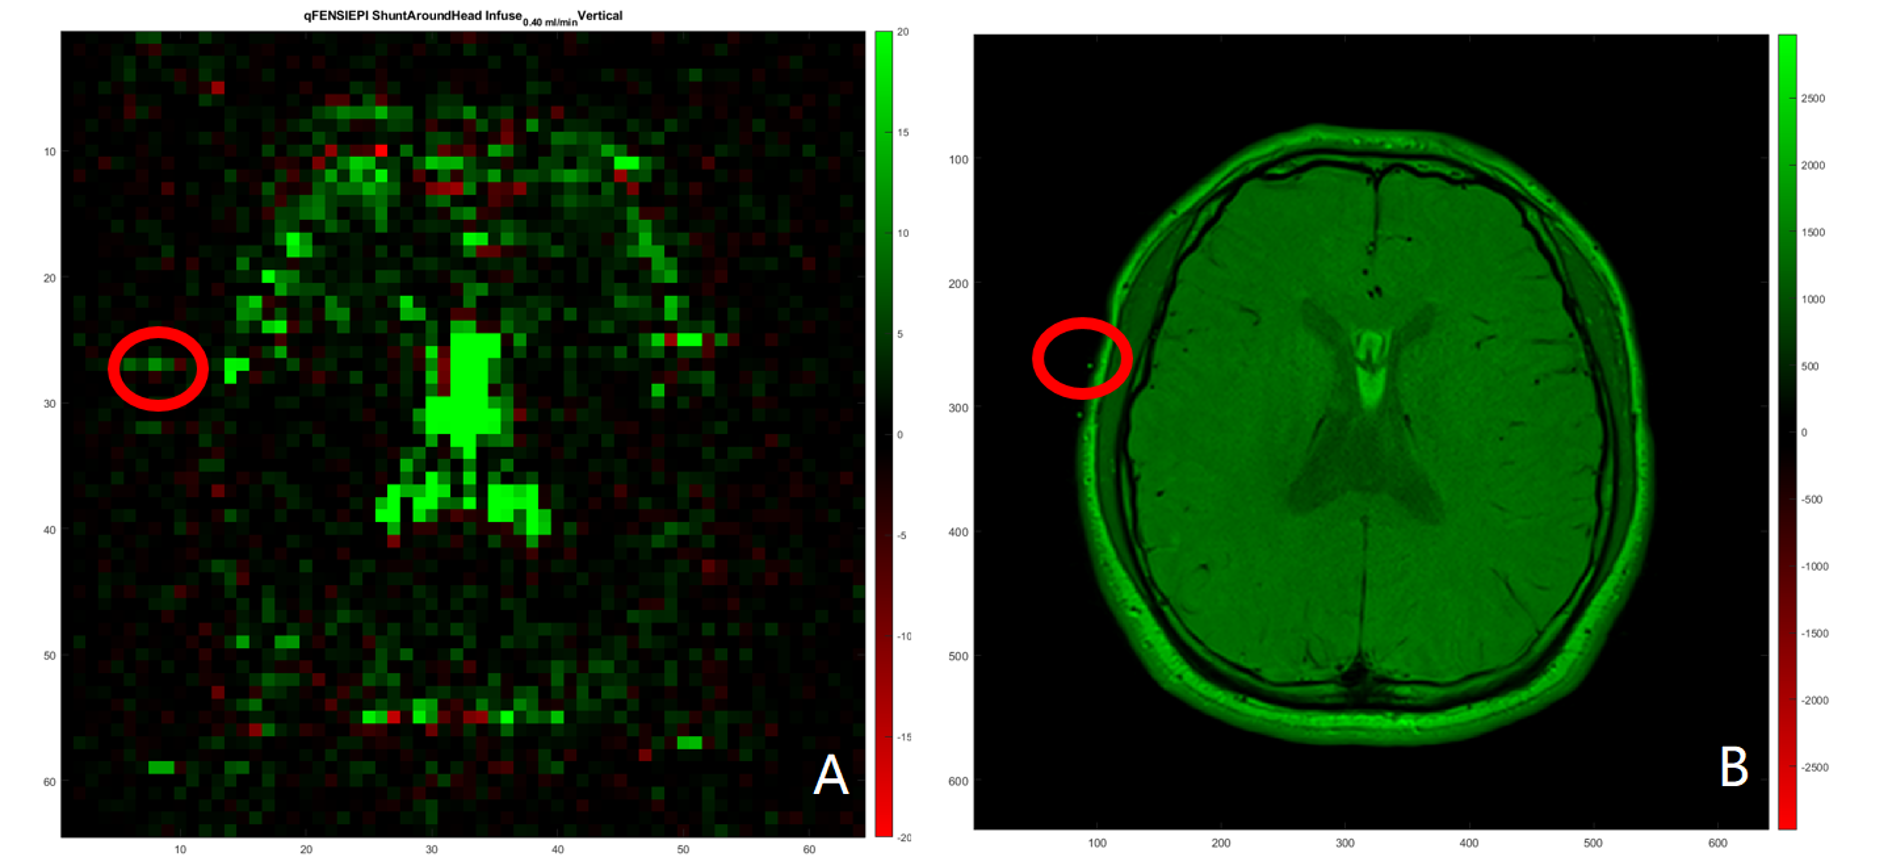
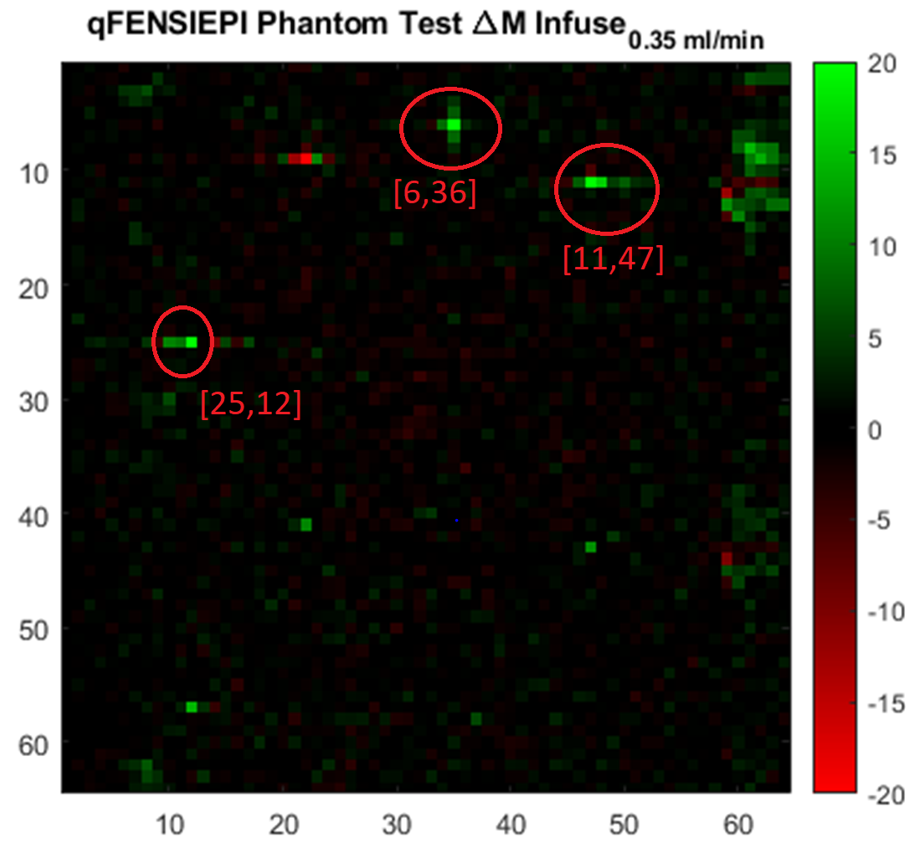
A phantom and a volunteer human subject were scanned to test the flow measurement accuracy of Shunt-FENSI. A tube was wrapped around the phantom/head and driven by an MRI compatible flow pump to set values of flow in the range of 0.1 – 0.4 mL/min. The tube was located in the images with the help of a T2 turbo spin echo (TSE) image (Fig. 1). After subtracting the tag images from the corresponding control image, a flow-weighted image (Fig. 2) was obtained by dividing by a non-tagged image:
$$ Total Signal Percent Loss of Voxel = \dfrac{{\Delta}M}{I_{Untagged}} = \dfrac{I_{Ctrl} - I_{Tag}}{I_{Untagged}} $$
A simulation of the flow, tagging, and T1-recovery was performed using the same imaging dimensions and dimensions of the shunt to provide a reference for determining accuracy of the flow measurement. Coefficients of determination (R-squared) between the simulated and each experimental curve (at different set velocities) were calculated to assess their relationship. In the flow test in human experiment, we fixed the shunt/tube with known flow rates outside and used the same procedure described above. We measured the T1 of the fluid in the shunt to be 1.678 s.
Results
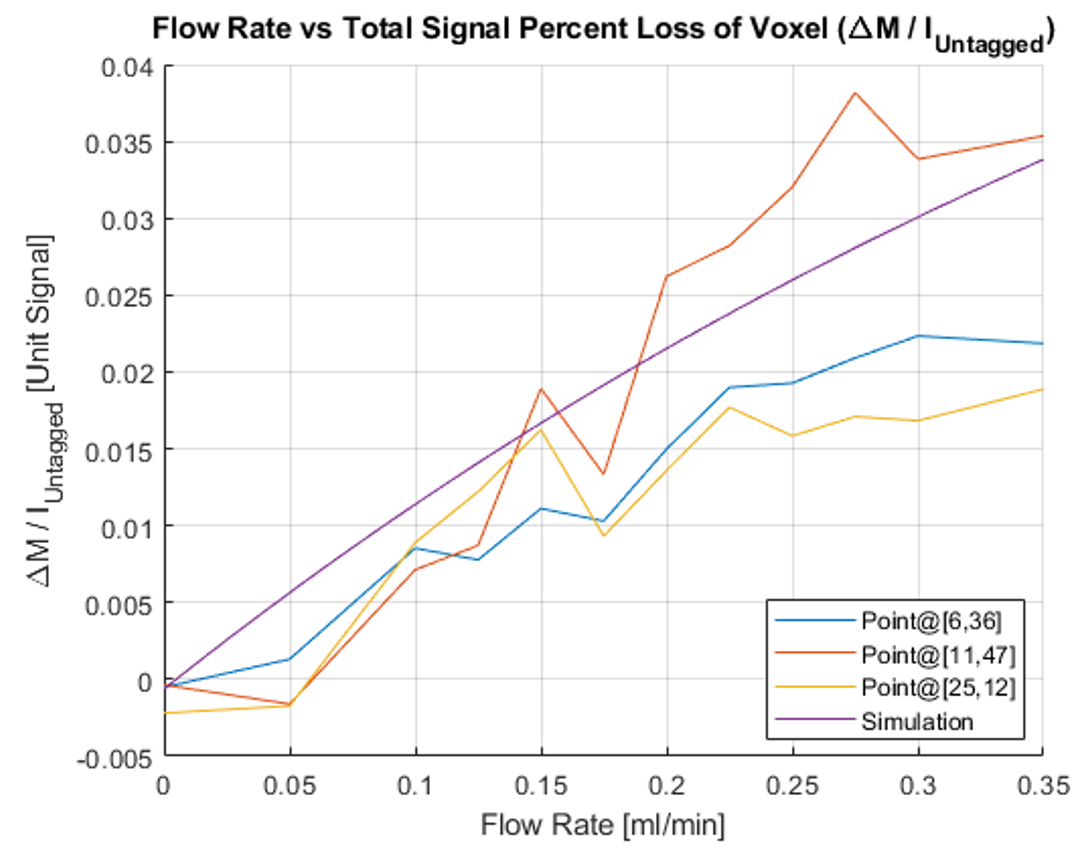
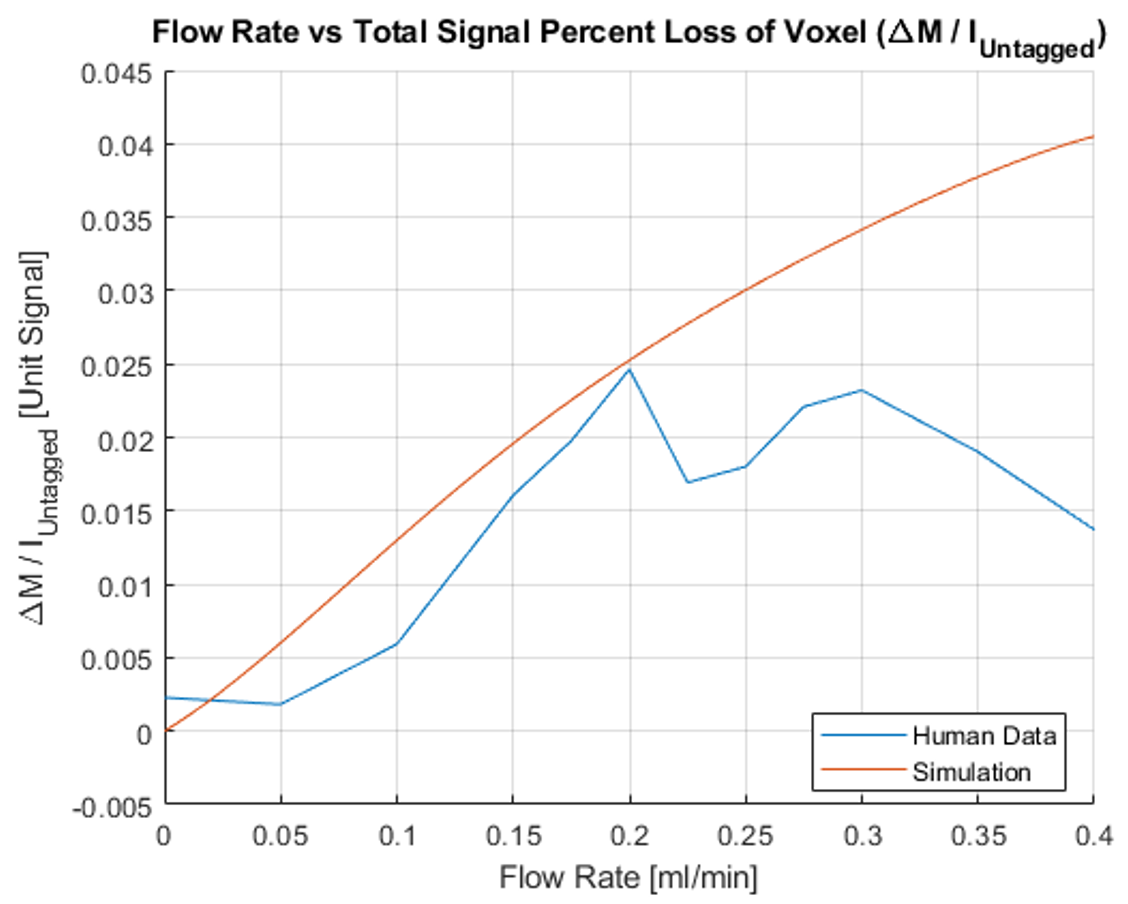
According to the phantom test result (Fig. 3), the increasing pattern of the measured curves matched the simulated curve with T1 recovery effect using the measured T1 value. The experimental data at the locations of where the shunt intersected the imaging plane have R-square values of 0.9557, 0.9080, and 0.8187, correspondingly, when fitted to the simulated curve. The human test result is shown in Fig. 4. The curve follows the simulated profile up to 0.2 mL/min, but deviates past that, potentially due to motion as the different flow rates were run on the human subject sequentially over the course of an hour, an issue that will be addressed in future runs.Discussion
Currently the phantom test demonstrated the ability of Shunt-FENSI to non-invasively and quantitatively measure CSF flow rate in a shunt, with the R-square values of near 0.9 between experimental data and simulated curves across a range of velocities 0.1- 0.4 mL/min. The sequence is short, taking just 3 minutes to get 10 tag/control pairs for the measurement. Our simulations closely match the experimental data further enabling optimization studies for transitioning this to shunt patients.Acknowledgements
Research reported in this publication was supported by the Eunice Kennedy Shriver National Institute Of Child Health & Human Development of the National Institutes of Health under Award Number R21HD095314. The content is solely the responsibility of the authors and does not necessarily represent the official views of the National Institutes of Health
References
- Browd SR, Ragel BT, Gottfried ON, Kestle JR. Failure of cerebrospinal fluid shunts: part I: Obstruction and mechanical failure. Pediatr Neurol. 2006;34(2):83-92.
- Kestle J, Drake J, Milner R, Sainte-Rose C, Cinalli G, Boop F, Piatt J, Haines S, Schiff S, Cochrane D, Steinbok P, MacNeil N. Long-term follow-up data from the Shunt Design Trial. Pediatr Neurosurg. 2000;33(5):230-6.
- Pollack IF, Albright AL, Adelson PD. A randomized, controlled study of a programmable shunt valve versus a conventional valve for patients with hydrocephalus. Hakim-Medos Investigator Group. Neurosurgery. 1999;45(6):1399-408; discussion 408-11.
- Stein SC, Guo W. Have we made progress in preventing shunt failure? A critical analysis. J Neurosurg Pediatr. 2008;1(1):40-7.
- Sutton BP, Ouyang C, Ching BL, Ciobanu L. Functional imaging with FENSI: flow-enhanced signal intensity. Magn Reson Med. 2007;58(2):396-401.
- Ouyang C, Sutton BP. Localized blood flow imaging using quantitative flow-enhanced signal intensity. Magn Reson Med. 2012;67(3):660-8. PMCID: 3184373.
Figures