4698
Motor Ability Network Connectivity in Undernourished Young Children in India
Muriel Marisa Katharina Bruchhage1,2, Giang-Chau Ngo1,2, Madhuri Tiwari3, Aarti Kumar3, Vishwajeet Kumar3, Viren D'Sa1,2, and Sean C. L. Deoni1,2,4
1Warren Alpert Medical School, Brown University, Providence, RI, United States, 2Advanced Baby Imaging Lab, Hasbro Children's Hospital, Providence, RI, United States, 3Community Empowerment Lab, Lucknow, India, 4Maternal, Newborn, and Child Health Discovery & Tools, Bill & Melinda Gates Foundation, Seattle, WA, United States
1Warren Alpert Medical School, Brown University, Providence, RI, United States, 2Advanced Baby Imaging Lab, Hasbro Children's Hospital, Providence, RI, United States, 3Community Empowerment Lab, Lucknow, India, 4Maternal, Newborn, and Child Health Discovery & Tools, Bill & Melinda Gates Foundation, Seattle, WA, United States
Synopsis
Early motor skill acquisition is an important developmental stepping stone for more complex cognitive tasks. While cognitive performance and overall health has shown to be negatively impacted by malnutrition, few studies have been conducted to investigate its influence on neurodevelopment. Here, we investigate the relationship of motor ability and brain functional connectivity (fc) in currently underweight and average weight young children (< 2 years) living in an Indian region with one of the worst human development indicators. With increase in motor complexity, fewer fc were available in the undernourished cohort only, possibly indicating an under-recruitment of brain networks.
Introduction
Early motor abilities, such as being able to walk or fine grasp pieces of food to eat independently, are an important aspect of early childhood development and set the basis for mastering more complex cognitive tasks1. In order to learn gross and fine motor coordination, a wide range of brain functional networks is required, increasing in network recruitment with task difficulty2. Neurocognitive functioning in adolescents has been successfully predicted by resting state network functional connectivity (rsFMRI)3, and MRI has been widely used to investigate children’s neurodevelopment4. However, effective ability learning and brain development can be affected by a variety of child health inequalities such as malnutrition and infectious diseases, which in turn can result in underweight and malnourishment5. The prevalence of undernutrition exceedes 900 million people worldwide6. Most of these children live in low and middle income countries (LMICs), where 3.5 million childhood deaths below the age of 5 are attributable to it7. Under- and malnutrition has been linked with lower cognitive performance8, but due to a limited number of neuroimaging centers and difficulty in access, most studies have been conducted in developed countries and very few have been taken place in LMICs9. Here, we investigate the relationship of brain functional connectivity with gross and fine motor abilities as assessed by the Mullen Scales of Early Learning in a cohort of undernourished and average weight children living in the state of Uttar Pradesh in India, one of the regions in India with the worst human development indicators10. Our study focuses on early childhood (< 2 years old), a period during which the brain undergoes fast and important changes, establishing the ground for higher cognition and language development.Methods
MRI data were acquired on 40 underweight and age- and gender-matched 60 children of average weight (Table 1) during natural sleep on a 3 T Philips Achieva scanner.We used the Mullen Scales of Early Learning11 to assess fine and gross motor functioning, a standardised and population normed tool for children from birth through 68 months of age. Weight for age z (WAZ) scores were assessed for all children and used for defining average weight and currently underweight (z score≤-2). Resting state fMRI data acquisition lasted about 6.7min with the following protocol: TE= 30ms; TR=2.5s; voxel resolution= 2.5x2.5x3mm3; 40 slices. Structural scans were obtained with standard MPRAGE. Children with any major neurological disorders were excluded from the study. Functional MRI data were first preprocessed (realignment, centering, motion correction, noise removal, scrubbing) with the CONN fMRI toolbox12 on MATLAB and registered to our child study template using FSL FLIRT13 and ANTS14. The CONN fMRI toolbox was used to extract fc values and perform ROI-to-ROI network connectivity analyses based on an infant atlas of 32 fc networks12 to estimate the impact of undernourishment on their fc correlation patterns with gross and fine motor t values within each group. Nuisance covariates and realignment parameter noises were reduced using CompCor15, and fMRI data were band-pass filtered (0.008 < f < 0.09HZ). As a previous study in the same region of India revealed a significantly higher risk of malnutrition among female children16 and dimorphic connectivity trajectories have been indicated for boys and girls already during infancy17, we controlled all analyses for biological sex and FDR-corrected all results for multiple comparisons at p≤.05.Results
When comparing the fc association with gross motor ability in underweight and average weight children, fewer fc networks were present in the average group (Figure 1). While both groups showed higher fc with increasing gross motor scores, the underweight grouped showed more fc across networks, whereas the average weight group mainly expressed fc within networks. However, this changed for fine motor scores, where mainly within network fc was expressed in the underweight group but highly across network fc in the average weight group (Figure 2). In addition, more negative network fc was present with increasing fine motor ability in the underweight group, while an increase in network fc was present in the average weight group.Discussion
While similar fc networks were present for both gross and fine motor ability associations in underweight and average weight children (Figures 1, 2), fc increased with task complexity (gross to fine motor) in the average weight group. This increase in fc network recruitment parallels previous findings of typical age-dependent rsfMRI brain-behavior investigations of motor2 and even language development18. However, the opposite effect was observed in the undernourished group, possibly indicating an early deviation of typical neurocognitive development. Thus, our results of fewer network fc recruitment and availability with increasing motor skill complexity could imply that with higher demand for nourishment, skill acquisition might be secondary.While more complex skill sets develop later during childhood and are more difficult to assess, the effects of undernourishment are largely irreversible after the first two years of life19, underlining the need for early detection and interventions during early childhood. We hope that our findings provide new insights into the interactions of undernourishment on brain connectivity and underline the urgency to intervene as early as possible.Acknowledgements
We would like to thank the National Institutes of Health (UH3 ODD023313 and R01 MH087510) and the Bill and Melinda Gates Foundation (OPP11002016) for their continuous support of this work.References
1. Silbereis, J. C., et al. (2016). The cellular and molecular landscapes of the developing human central nervous system. Neuron, 89(2). doi: 10.1016/j.neuron.2015.12.008. 2. Marrus, N., et al. (2018). Walking, gross motor development, and brain functional connectivity in infants and toddlers. Cereb Cortex, 28(2), 750-763. 3. Sripada, C., Rutherford, S., Angstadt, M., Luciana, M., Weigard, A., Hyde, L. H., Heitzeg, M. (2019). Prediction of neurocognition in youth from resting state fMRI. Molecular Psychiatry. 4. Gao et al., Neuroscientist, 2017;23(2):169–84. 5. Walker, S. P., Wachs, T. D., Grantham-McGregor, S., Black, M. M., Nelson, C. A., Huffman, S. L., et al. (2011). Inequality in early childhood: risk and protective factors for early child development. The Lancet, 378:1325–38. 6. Food and Agriculture Organization of the United Nations (2010). The State of Food Insecurity in the World - Addressing Food Insecurity in Protracted Crises. FAO; Rome, Italy. 7. Black, R. E., Allen, L. H., Bhutta, Z. A., Caulfield, L. E., de Onis, M., Ezzati, M., Mathers, C., Rivera, J. (2008). Maternal and child undernutrition: global and regional exposures and health consequences. Lancet, 371, 243–260. 8. Repositioning Nutrition as Central to Development A Strategy for Large-Scale Action. The World Bank; Washington, DC, USA: 2006. 9. OECD (2018), Magnetic resonance imaging (MRI) units (indicator). doi: 10.1787/1a72e7d1-en; last accessed Sept. 29 2018. 10. Menon et al. (2018). Understanding the geographical burden of stunting in India: A regression‐decomposition analysis of district‐level data from 2015–16. Matern Child Nutr., 14(4):e12620. 11. Mullen, E. M. (1995). Mullen scales of early learning. AGS; Circle Pines, MN. 12. Whitfield-Gabrieli and Nieto-Castanon (2012). Conn: a functional connectivity toolbox for correlated and anticorrelated brain networks. Brain Connectivity, 2(3),125–141. 13. Smith et al. (2014). Advances in functional and structural MR image analysis and implementation as FSL. NeuroImage, 23(1):S208-219. 14. Avants et al. (2014). The insight ToolKit image registration framework. Front. Neuroinformatics, 28;8:44. 15. Behzadi, Y., Restom, K., Liau, J., Liu, T. T. A component based noise correction method (CompCor) for BOLD and perfusion based MRI. (2007). NeuroImage, 37(1), 90-101. 16. Srivastada, A., Mahmood, S. E., Srivastava, P. M., Shrotriya, V. P., Kumar, B. (2012). Nutritional status of school-age children – A scenario of urban slums in India. Archives of Public Health, 70(8). 17. Gao, W., Alcauter, S., Smith, J. K., Gilmore, J., Lin, W. (2015). Development of human brain cortical network architecture during infancy. Brain Struct Funct, 220(2), 1173-1186. 18. Perani, D., Saccuman, M. C., Scifo, P., Anwander, A., Spada, D., Baldly, C., Poloniato, A., Lohmann, G., Friedrich, A. D. (2011). Neural language networks at birth. Proc Natl Acad Sci USA, 108(38), 16056-16061. 19. Martorell, R., Khan, L. K., Schroeder, D. G. (1994). Reversibility of stunting: epidemiological findings in children from developing countries. European Journal of Clinical Nutrition, 48(1), S45-57.Figures
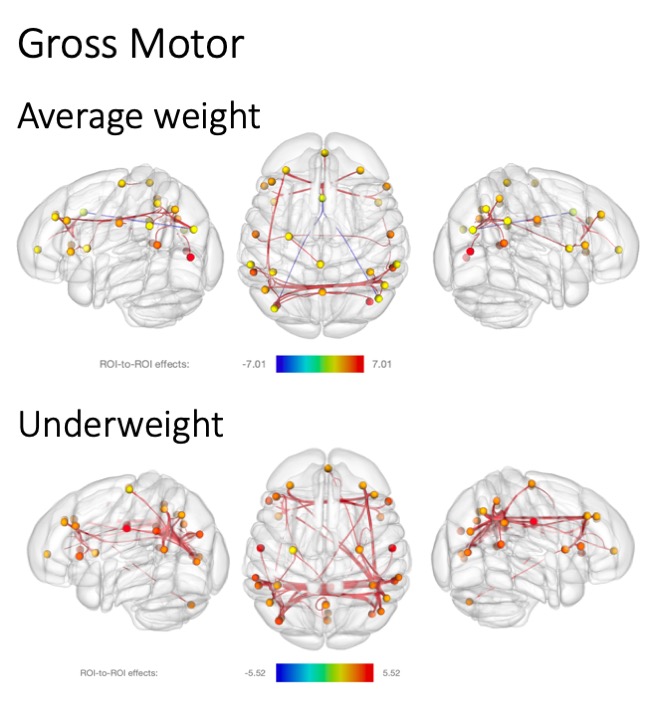
Significant resting state fMRI network connectivity with gross motor t scores for average weight (above) and underweight children (below). All analyses were corrected for biological sex, and p values were FDR corrected for multiple comparisons. T value ranges of region of interest effects are shown in a colour coded bar with yellow to red range indicating higher positive t values and green to blue range indicating higher negative t values.
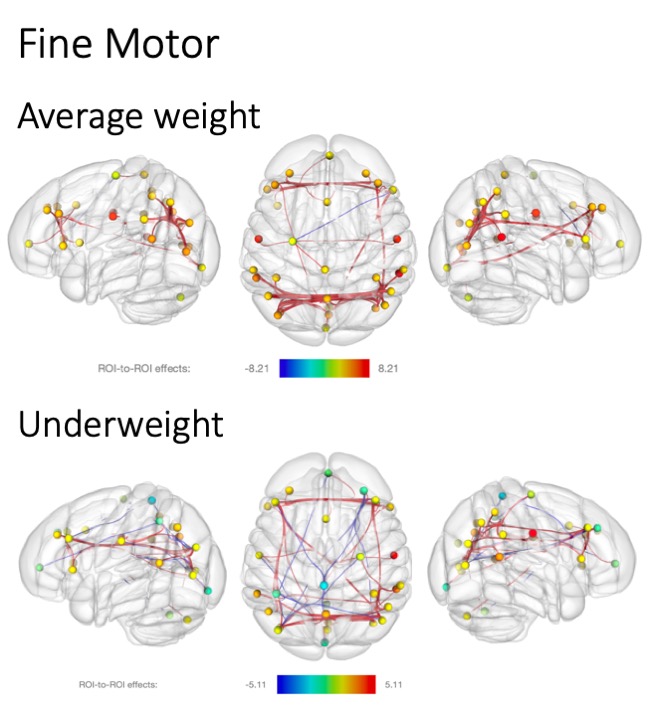
Significant resting state fMRI network connectivity with fine motor t scores for average weight (above) and underweight children (below). All analyses were corrected for biological sex, and p values were FDR corrected for multiple comparisons. T value ranges of region of interest effects are shown in a colour coded bar with yellow to red range indicating higher positive t values and green to blue range indicating higher negative t values.