4697
MRI reveals brain ventricle expansion in pediatric patients with acute disseminated encephalomyelitis1Berlin Ultrahigh Field Facility, Max Delbrück Center for Molecular Medicine, Berlin, Germany, 2Department of Paediatric Neurology, Children's Hospital Datteln, Witten/Herdecke University, Datteln, Germany, 3Division of Paediatric Neurology, Department of Paediatrics I, Medical University of Innsbruck, Innsbruck, Austria, 4Experimental and Clinical Research Center, Charité - Universitätsmedizin Berlin, Berlin, Germany
Synopsis
We show dynamic variations in brain ventricle volume (VV) in longitudinal MRI scans of pediatric patients with acute disseminated encephalomyelitis (ADEM). A majority of patients showed decreases in VV directly following the initial clinical event, or following subsequent VV expansion. This suggests that the VV expansion in these patients was not due to irreversible brain atrophy, but rather likely reflected processes associated with acute disease. Calculations of VV (and volumes of other brain structures) done using the automated tool FreeSurfer were significantly affected by gadolinium-based contrast agents; comparing pre- and post-contrast scans should be avoided in longitudinal studies.
Introduction
Pediatric patients with neuroinflammatory disease such as acute disseminated encephalomyelitis (ADEM) are at risk of impaired brain growth, with profound long-term neuropsychiatric consequences.1,2 ADEM patients have reduced brain volume and increased ventricle volume (VV) compared to age-matched controls.3 We previously observed a marked expansion of brain VV in the acute phase of the experimental autoimmune encephalomyelitis (EAE), an animal model of neuroinflammation.4 We subsequently showed that VV normalized upon disease remission, and reported dynamic VV expansions and contractions in patients with relapsing-remitting multiple sclerosis (MS), who appeared to be at an earlier disease stage compared to patients without VV changes.5In this study we examined VV changes in ADEM as a monophasic neuroinflammatory disease. By investigating longitudinal MRI scans of pediatric ADEM patients, we aimed to distinguish temporary VV expansions (reflecting acute disease activity) from persistent ones (reflecting brain atrophy). We also examined the influence of gadolinium-based contrast agents (GBCA) on VV, and other brain structures, calculated using a fully-automated segmentation tool.
Methods
MRI scans from pediatric patients with confirmed ADEM were obtained from 7 neurology clinics in Germany and Austria: n=14; 8/14 female; mean age=7.2 years (range 0.7-17.6). This data was obtained from routine clinical practice, and MRI scan parameters varied among centers, with variable timing of follow-up scans performed according to the clinical needs of individual patients. A sub-cohort of patients (n=12) were administered GBCA and had pre- and post-contrast scans at the same timepoint for detection of blood-brain barrier disruption.Brain VV was obtained from routine native T1-weighted anatomical scans. 3D MR scans with 1mm-isotropic resolution were segmented using FreeSurfer v6.0 (https://surfer.nmr.mgh.harvard.edu) using the recon -all function.6 For lower resolutions scans, VV were calculated using FMRIB Software Library (FSL v5.0, www.fmrib.ox.ac.uk/fsl)7 and manually corrected with ITK‐SNAP (www.itksnap.org).8 The same method was used for all scans of the same patient, to allow for consistent intra-individual comparisons.
Results
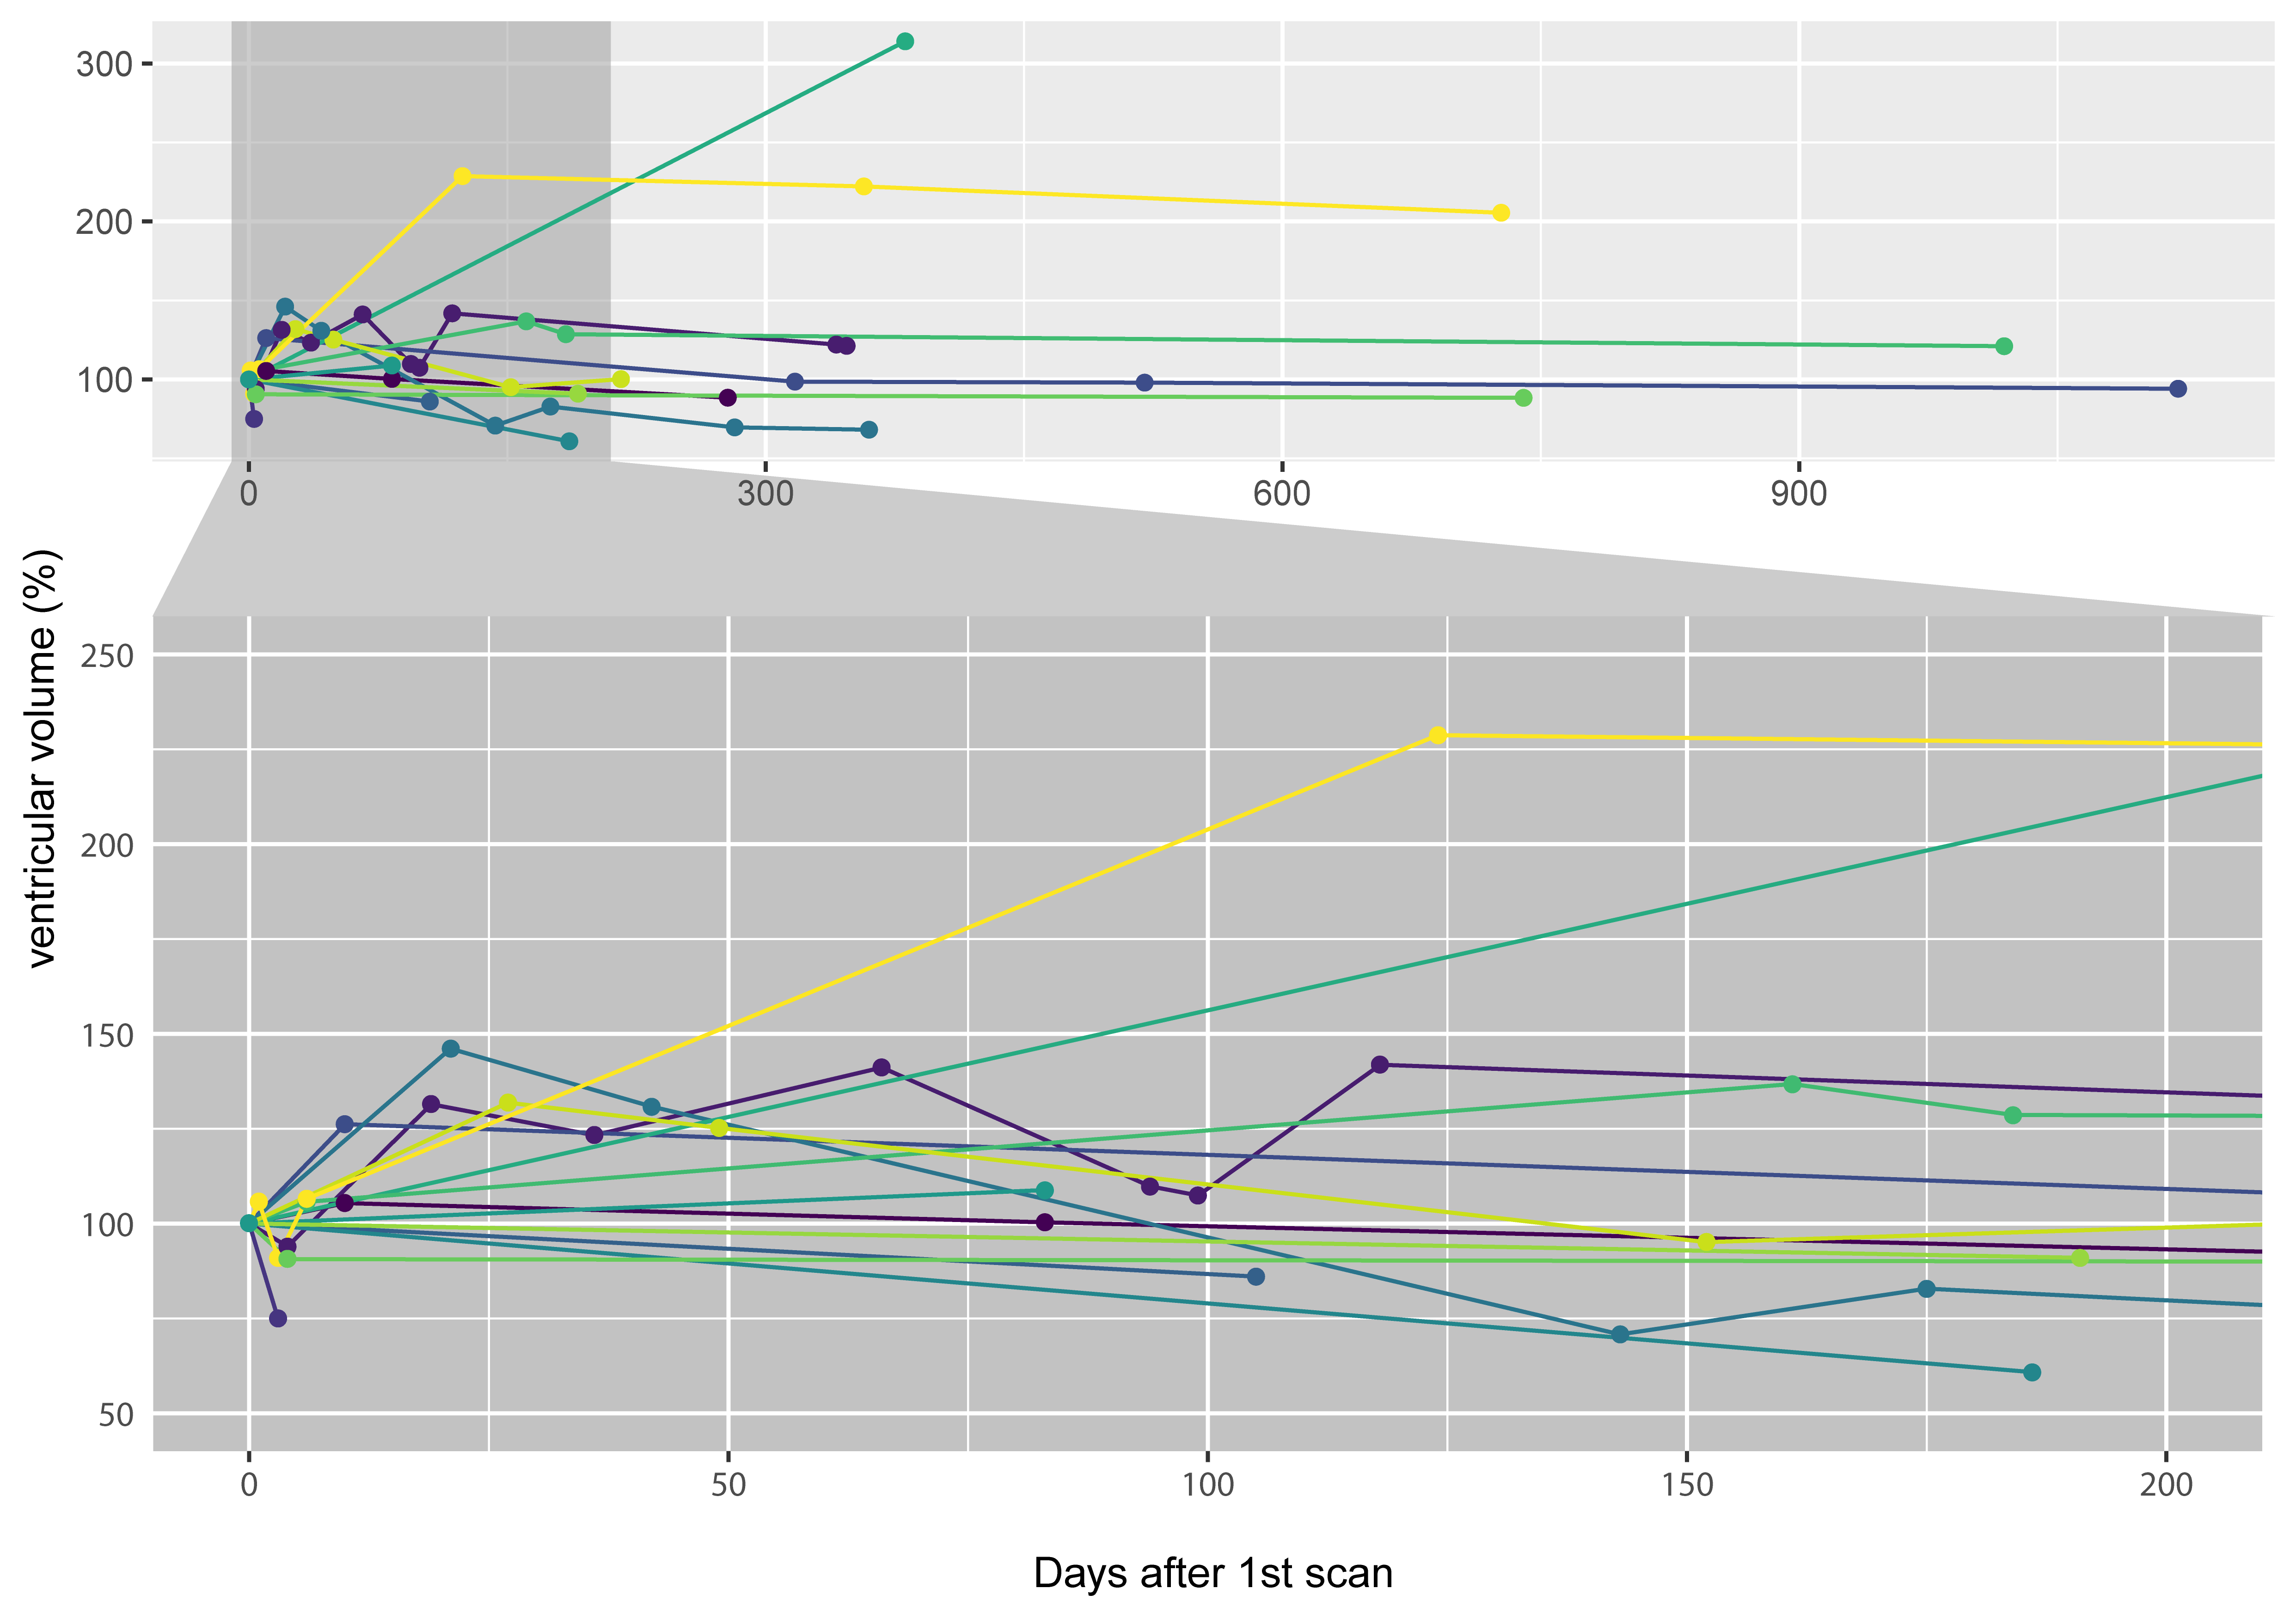
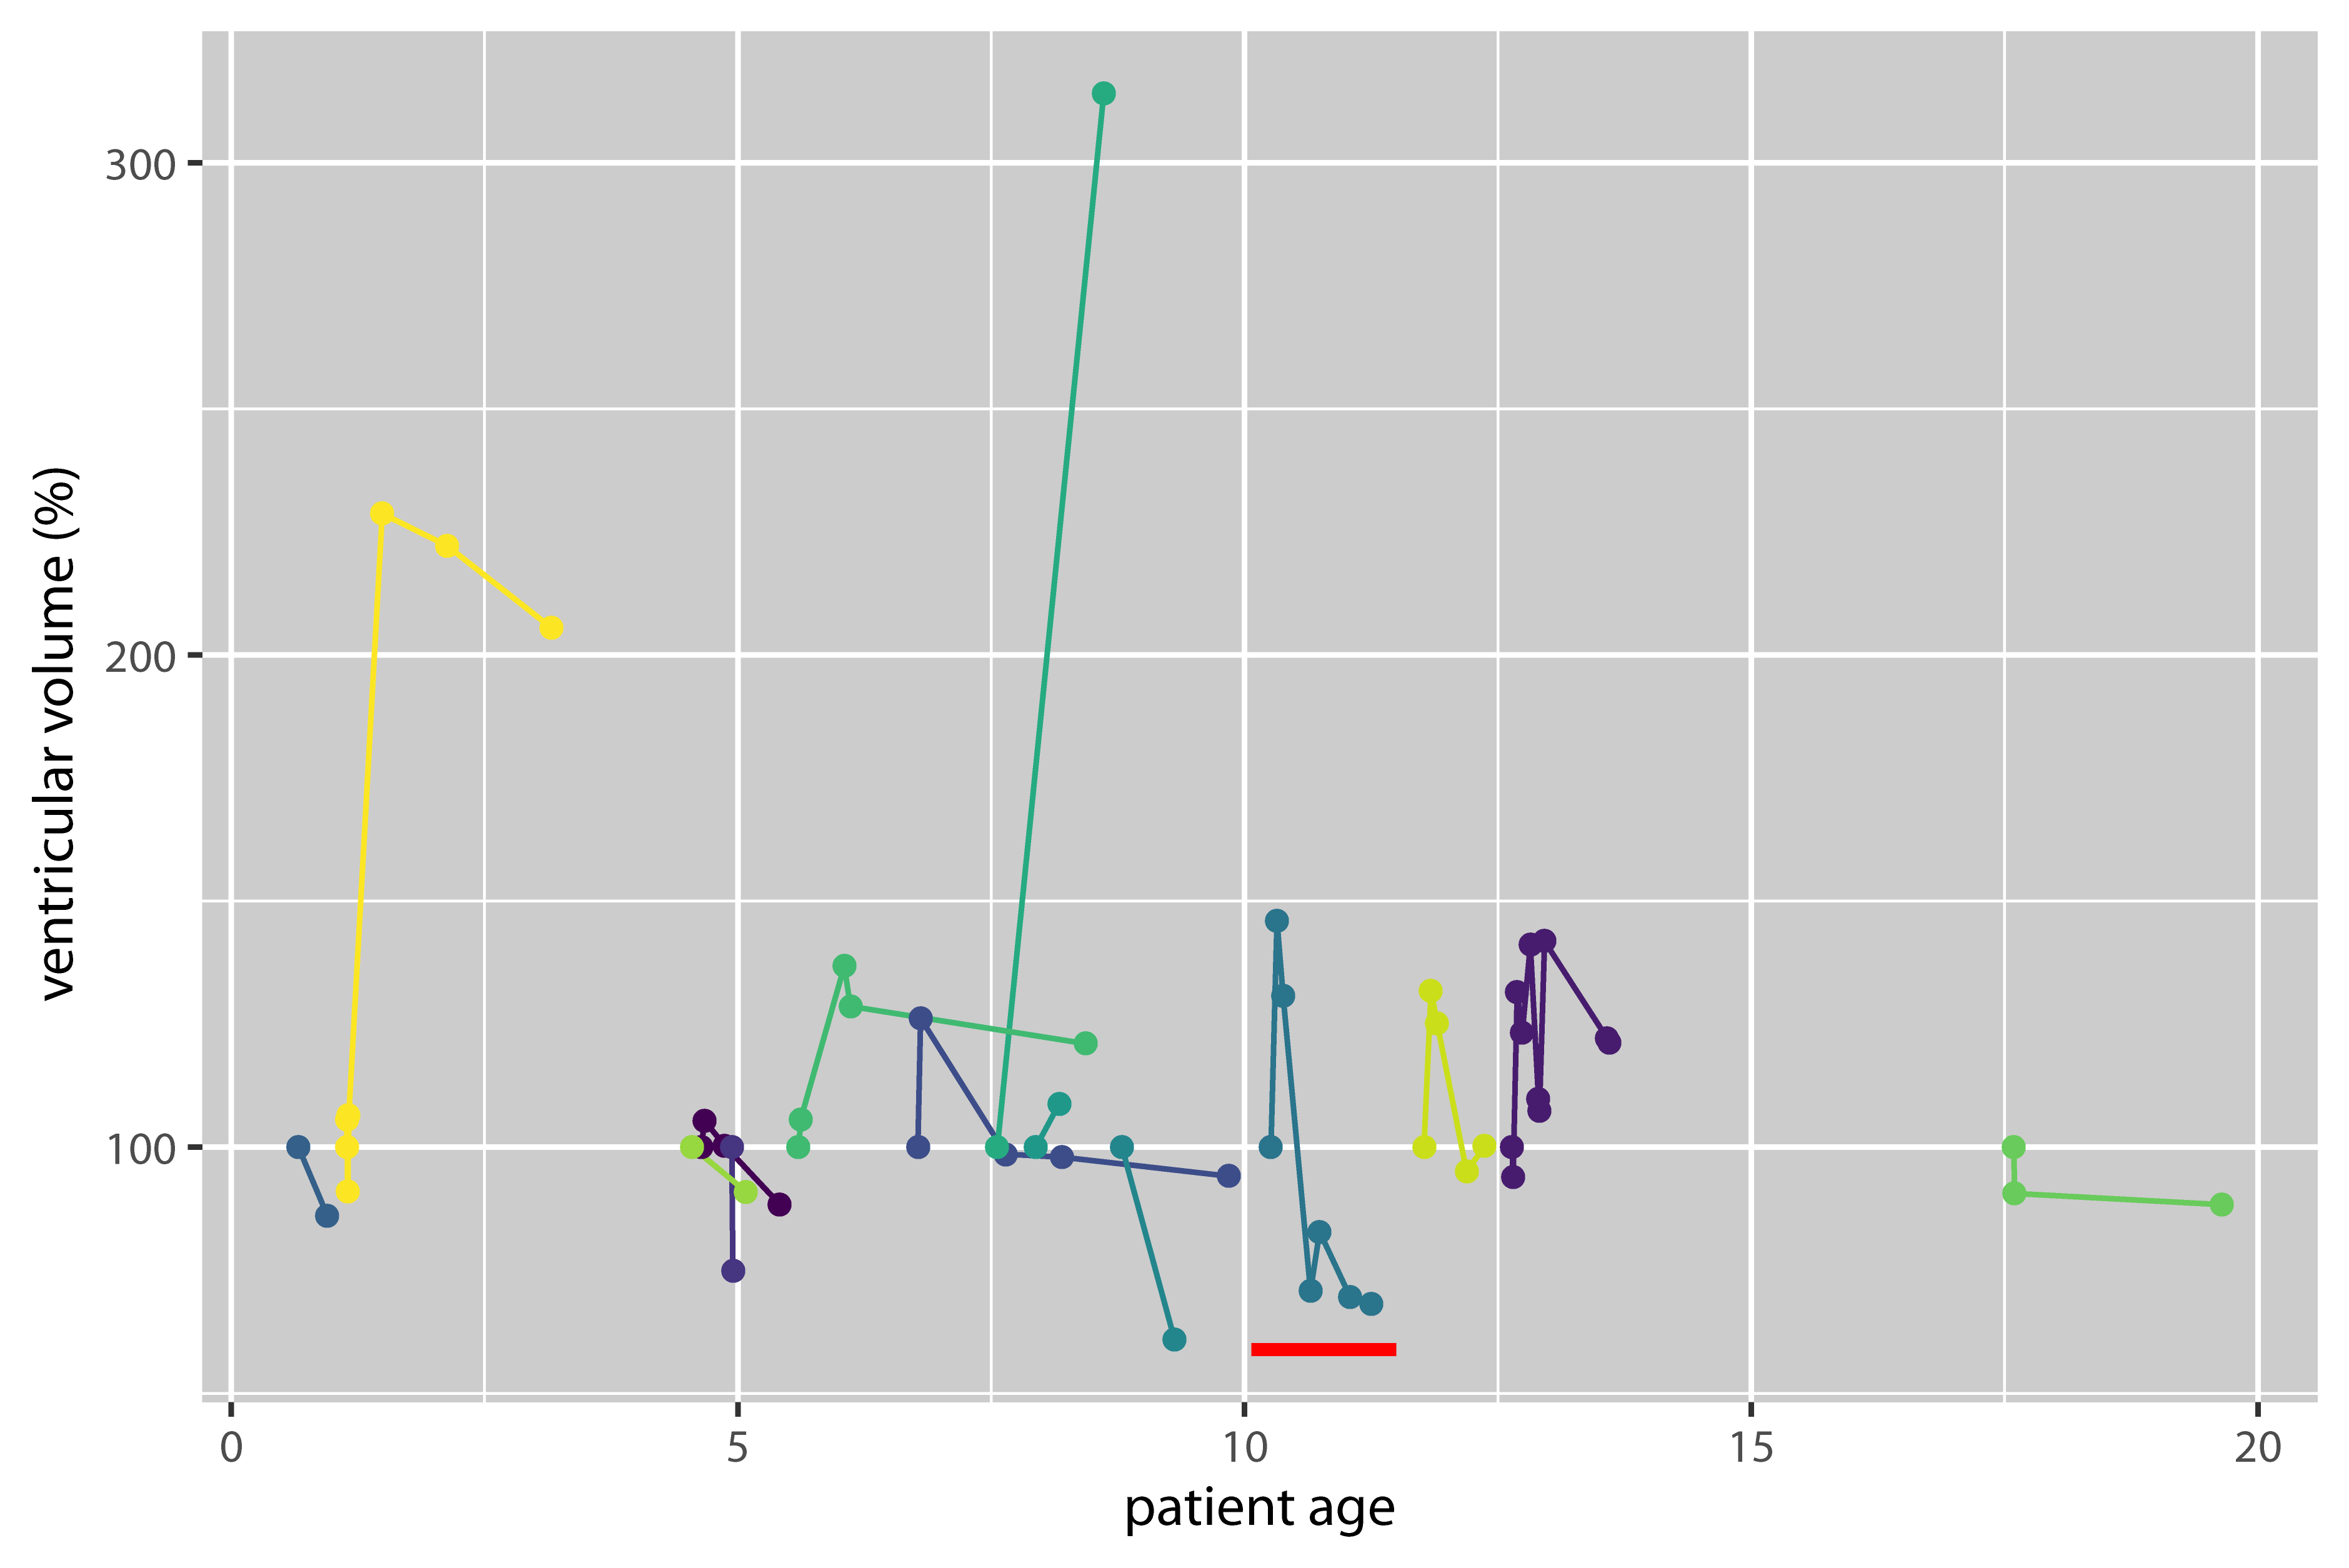
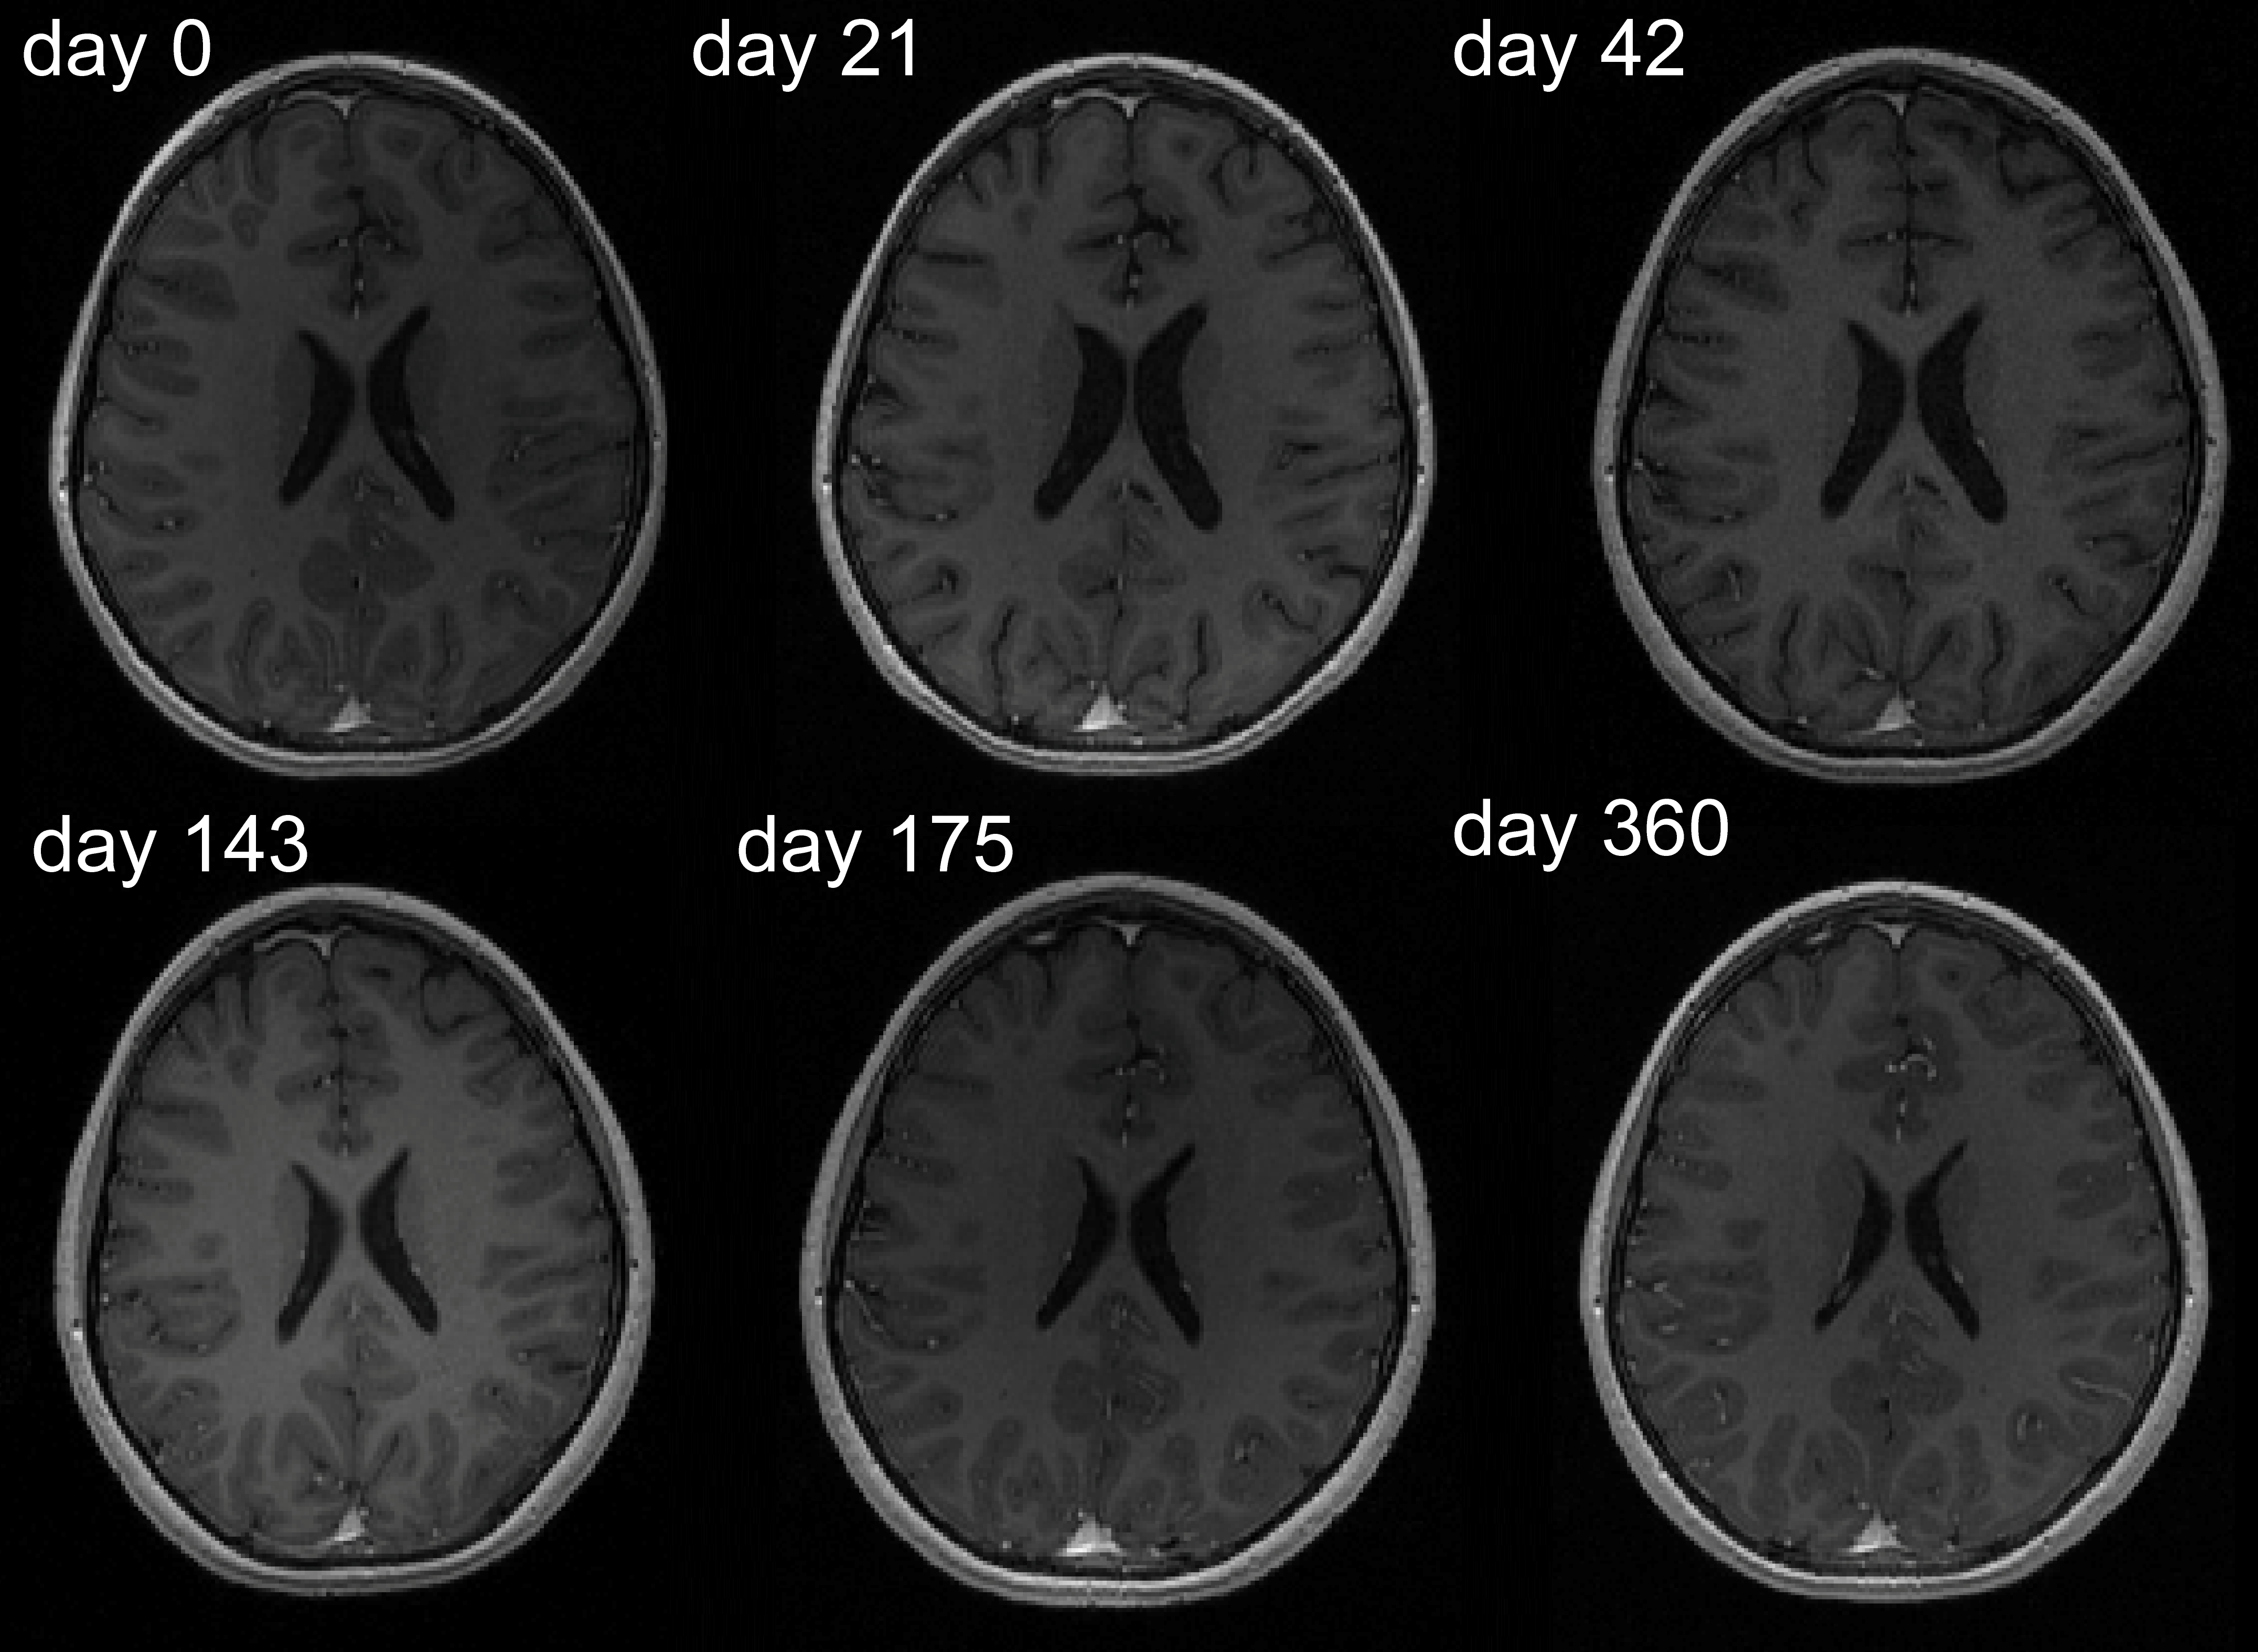
Brain VV of ADEM patients showed a heterogeneous mixture of expansion and contraction, which generally tended to stabilize over the long-term follow-up period (Fig.1). The majority of patients (11/14) showed VV contractions ≥10%; 3/14 patients showed exclusively expansion of VV (including one patient with >300% increase), although these three patients had only one follow-up scan.Plotting VV against patient age shows that VV changes occurred in different age groups, and indicate that VV did not merely increase monotonically over time (Fig.2). Representative images from one patient show VV changes over time (Fig.3). In this example, VV expanded beyond the initial level by the second timepoint, and subsequently contracted, reaching a value lower than the baseline after 1y follow-up (Fig.2, red bar).
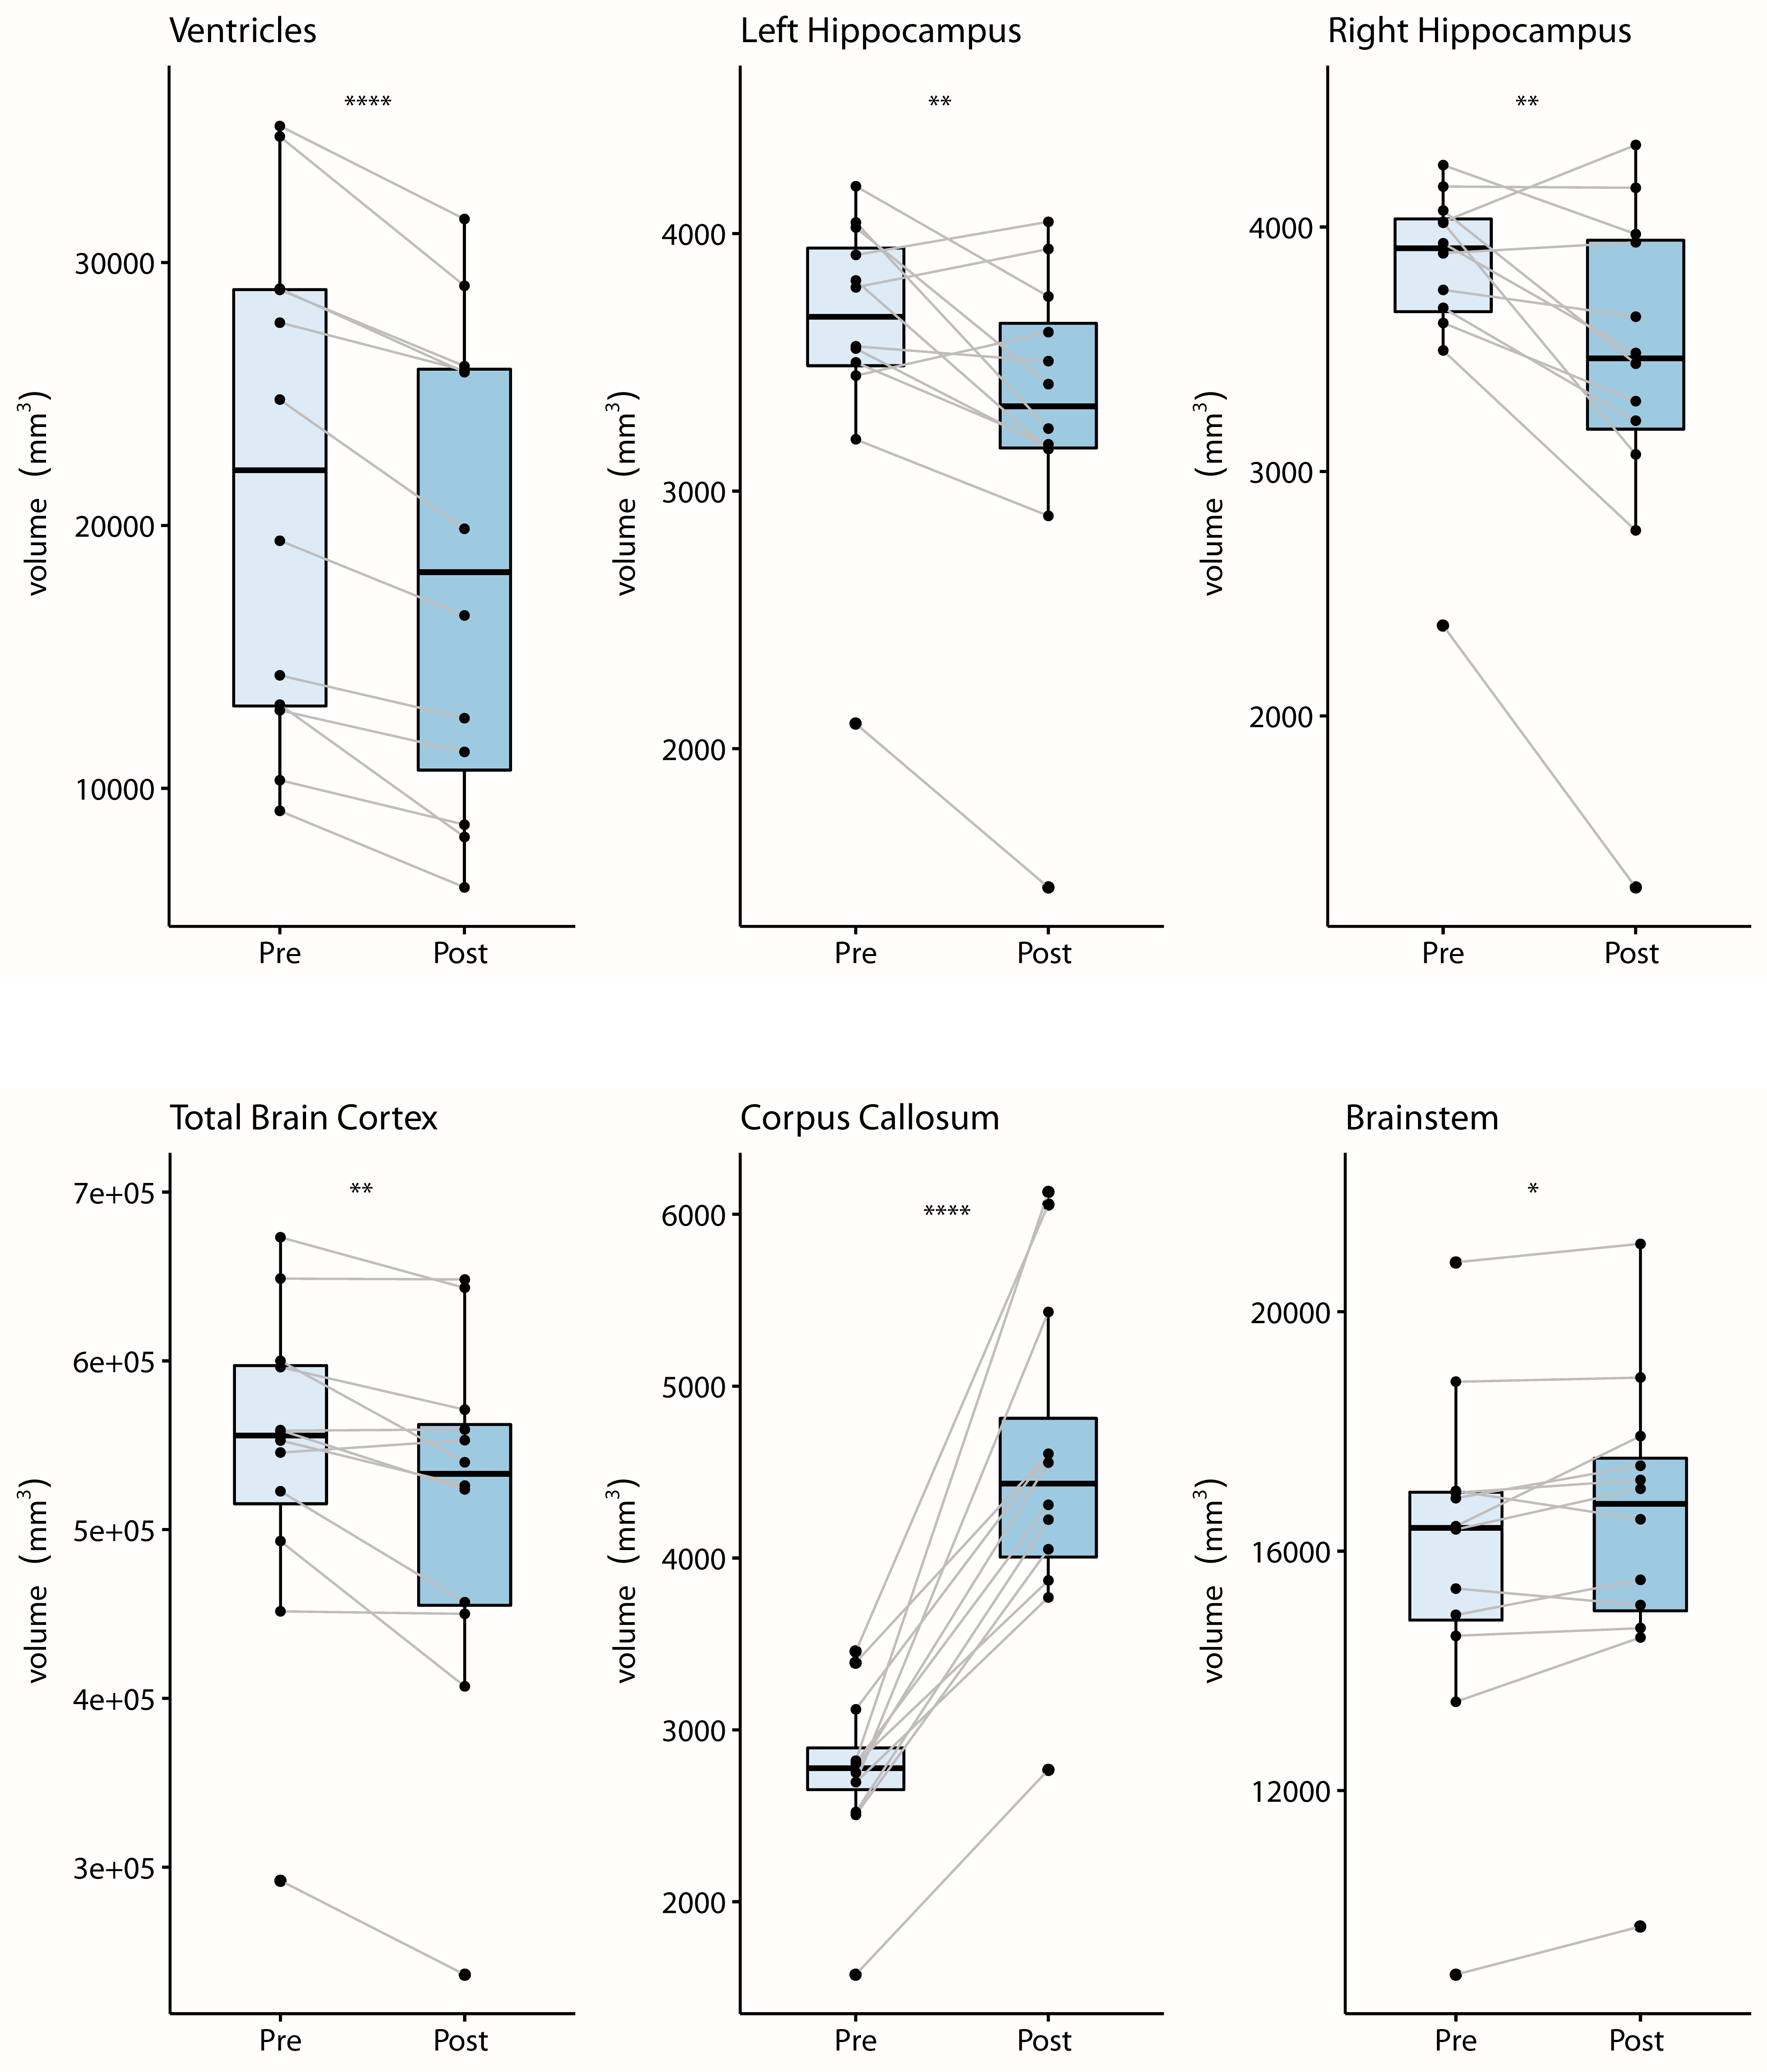
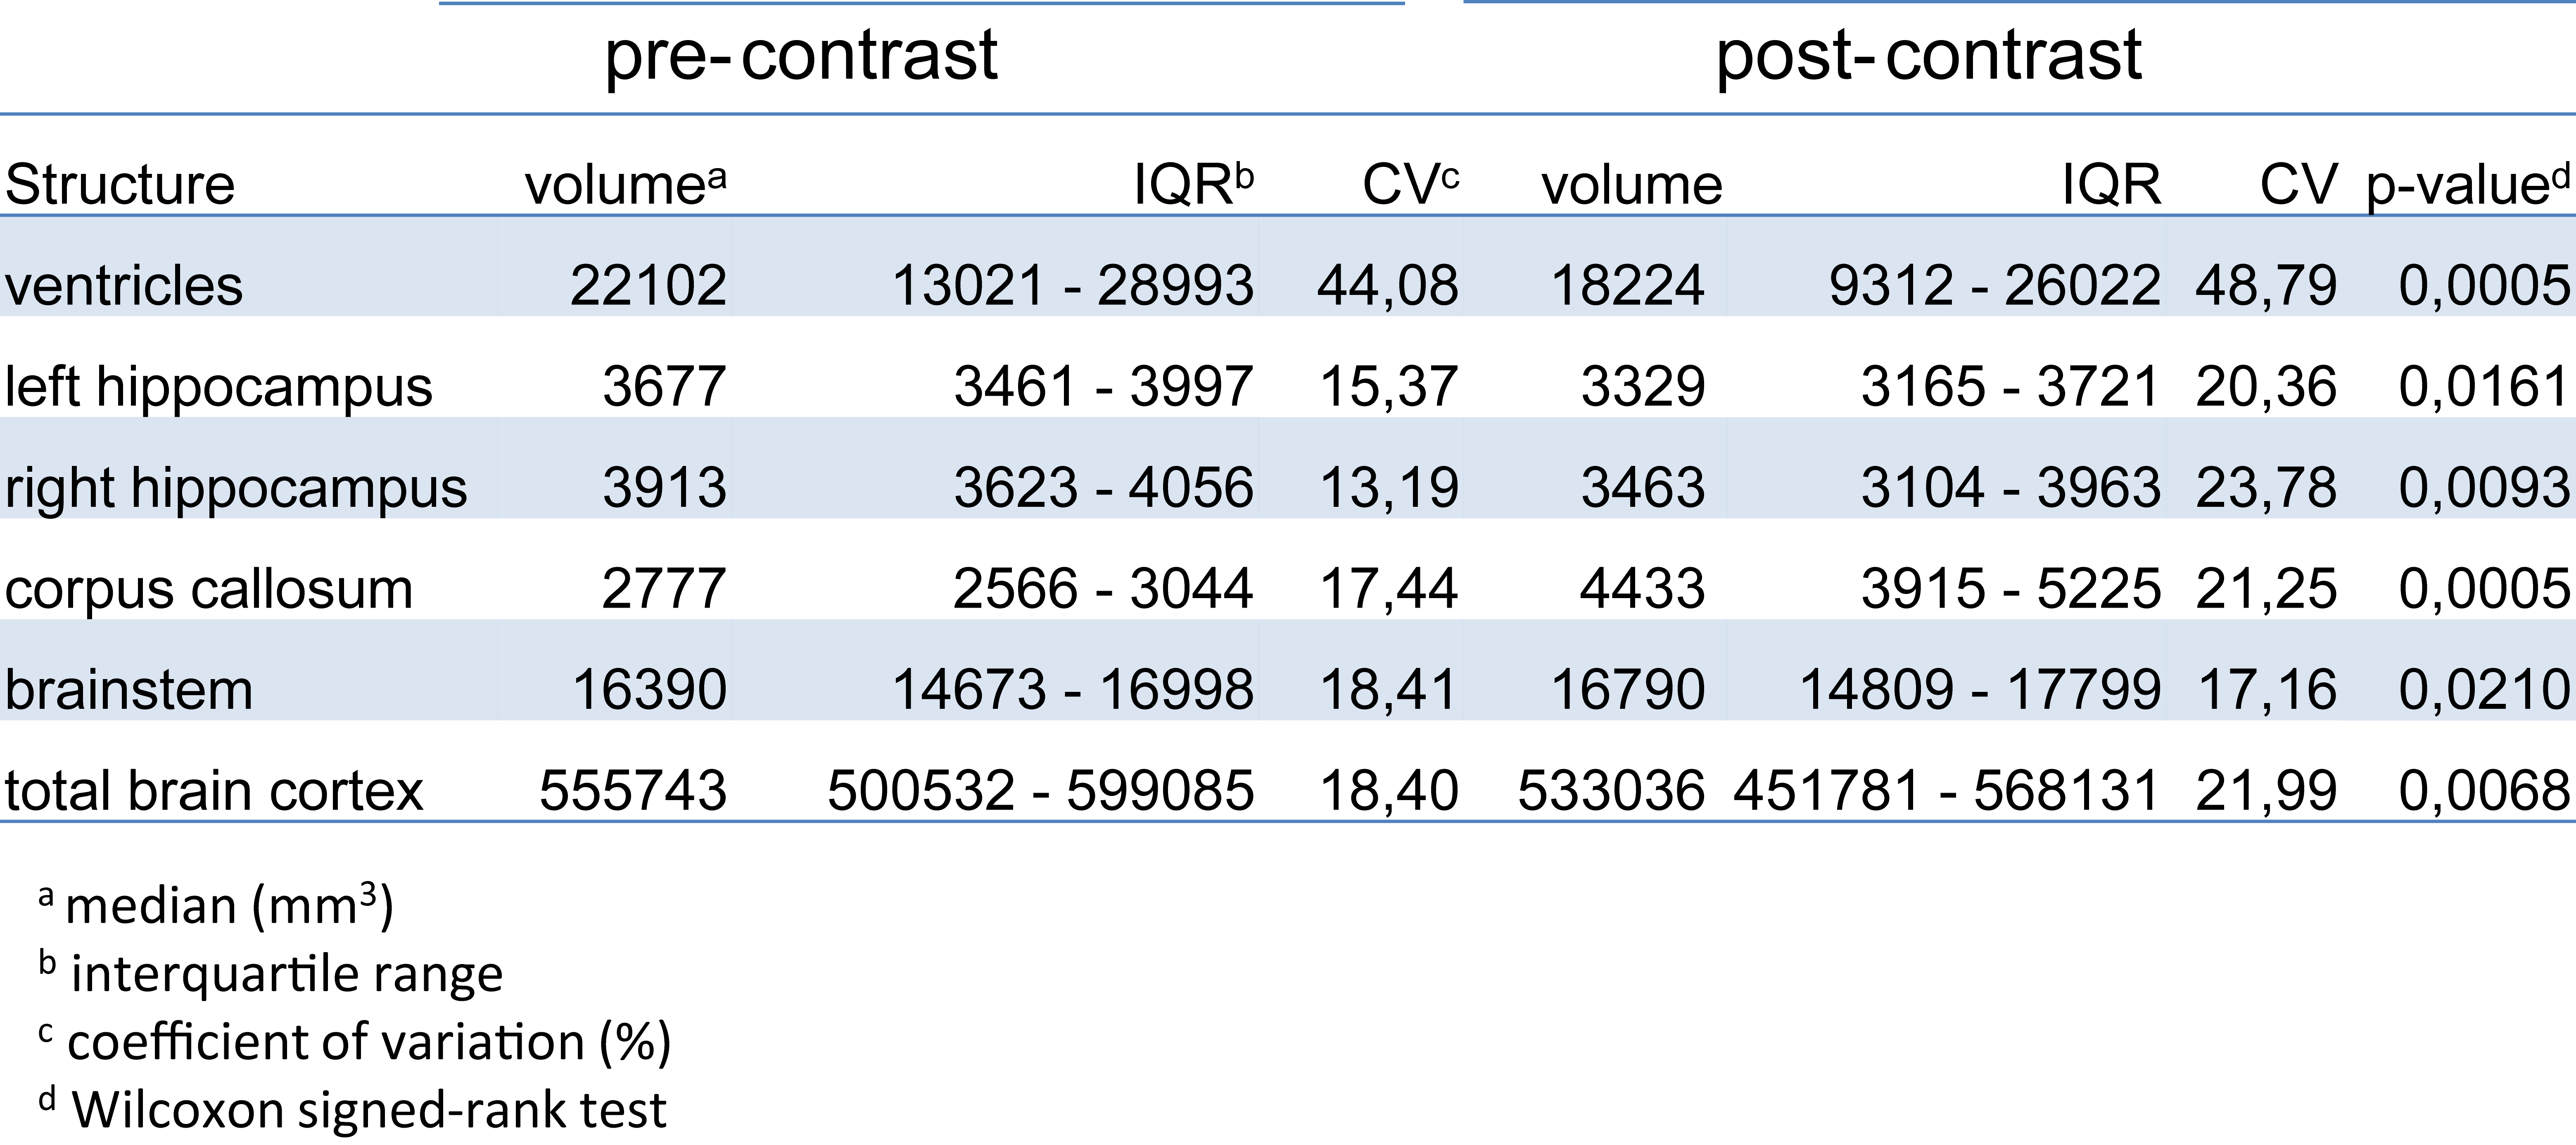
VV of post-contrast scans calculated by the fully-automated method (FreeSurfer) were significantly lower than VV of pre-contrast scans (Fig.4). The mean difference in VV after contrast was 16.52±9.42%. Post-contrast volumes of hippocampus and total brain cortex were also significantly reduced, while corpus callosum and brainstem volumes were significantly increased (Fig.4). Calculated volumes of post-contrast scans had more variability than pre-contrast, as shown by the increased coefficient of variation (summarized in Table1).
Discussion
Here we show dynamic variation in VV over time in ADEM patients. As these were pediatric patients, the usual expectation would be that VV would increase over time, as a result of normal brain growth. In fact, the majority of these patients showed decreases in VV, either directly following the initial clinical event, or following subsequent VV expansion – often stabilizing during long-term follow-up. This suggests that, in some patients, the VV expansion was not a consequence of irreversible brain atrophy, but rather likely reflected some process associated with acute disease. In one notable case, the VV expanded during the course of the investigation, but did not return to baseline levels during the follow-up period, indicating possible neurodegeneration and permanent brain damage. Together with other clinical measures, monitoring VV could be a crucial marker for the clinician to differentiate between transient processes and permanent damage, and plan treatment strategies accordingly.Effective tools are needed to accomplish this. The finding that application of GBCA alters the volumes of brain substructures when using the segmentation tool FreeSurfer is consistent with reports that contrast agents affect results of other automated segmentation tools.9,10 In this study, the increased variability in calculated VV following contrast was large enough to be a confounding factor given the effect sizes of the intra-individual comparisons. Care should be taken to avoid directly comparing calculated volumes from pre- and post-contrast scans during longitudinal studies.
Currently available automated brain segementation tools are not typically designed for use with pediatric brains. Emerging machine learning-based tools hold promise for better performance in cases with GBCA leading to differences in tissue contrast, and with the confounding effects of pathological features such as lesions, as well as anatomical changes, particularly in pediatric brains. It will be highly fruitful to apply such tools on larger datasets of patients with ADEM, pediatric MS and other neuroinflammatory diseases to better understand how changes in VV are related to the disease processes, and to develop improved treatment strategies to mitigate risks of long-term brain damage.
Acknowledgements
No acknowledgement found.References
1. Aubert-Broche, B., et al. Monophasic demyelination reduces brain growth in children. Neurology 88, 1744-1750 (2017).
2. Beatty, C., et al. Long-Term Neurocognitive, Psychosocial, and Magnetic Resonance Imaging Outcomes in Pediatric-Onset Acute Disseminated Encephalomyelitis. Pediatric neurology 57, 64-73 (2016).
3. Baumgartner, B., et al. Failure of Expected Brain Growth in Children with ADEM. Neuropediatrics 50, S1-S55 (2019).
4. Lepore, S., et al. Enlargement of cerebral ventricles as an early indicator of encephalomyelitis. PloS one 8, e72841 (2013).
5. Millward, J.M., et al. Transient enlargement of brain ventricles during Multiple Sclerosis and Experimental Autoimmune Encephalomyelitis. ISMRM Montreal, Canada (2019).
6. Fischl, B. FreeSurfer. NeuroImage 62, 774-781 (2012).
7. Smith, S.M., et al. Advances in functional and structural MR image analysis and implementation as FSL. NeuroImage 23 Suppl 1, S208-219 (2004).
8. Yushkevich, P.A., et al. User-guided 3D active contour segmentation of anatomical structures: significantly improved efficiency and reliability. NeuroImage 31, 1116-1128 (2006).
9. Hannoun, S., et al. Gadolinium effect on thalamus and whole brain tissue segmentation. Neuroradiology 60, 1167-1173 (2018).
10. Warntjes, J.B., Tisell, A., Landtblom, A.M. & Lundberg, P. Effects of gadolinium contrast agent administration on automatic brain tissue classification of patients with multiple sclerosis. AJNR. American journal of neuroradiology 35, 1330-1336 (2014).
Figures