4695
R2* mapping in children with attention deficit hyperactivity disorder: a whole-brain analysis1Department of Radiology, First Affiliated Hospital, Sun Yat-sen University, Guangzhou, China, 2MR Research, GE Healthcare, Beijing, China, 3Department of Pediatric, First Affiliated Hospital, Sun Yat-sen University, Guangzhou, China
Synopsis
Attention deficit/hyperactivity disorder (ADHD) might associate with the iron deficiency, but few studies reported on the correlation between brain iron level and the severity of illness. To address whether the changes of iron deposition are correlated with the cognitive function deficits in ADHD, the R2* mapping were applied in current study. The results indicated that the correlations between the R2* value and the symptom severity of ADHD were found in in brain regions within the basal ganglia region, temporal lobe and occipital lobe, which also indicated that R2* mapping might have the potential efficacy in the auxiliary diagnosis of ADHD.
Introduction
As a common childhood-onset neurodevelopmental disorder, the pathogenesis of attention deficit hyperactivity disorder (ADHD) is still unclear. Neuroimaging technology is a noninvasive method, and have largely applied to investigate the aberrant neural circles in ADHD. Recent studies indicated that the ADHD might associate with the iron deficiency.1 To further illustrate this topic, in current study, both the R2* and quantitative susceptibility mapping were applied. Unlike with that study, the main difference in our research including: 1) the quantitative measures of iron deposition were based on R2star mapping; 2) the correlations between the brain iron deposition with the severity of illness in ADHD were accessed; 3) a whole-brain analysis was performed.Methods
48 pediatric patients with clinical diagnosis of ADHD based on the criteria of DSM-5 were enrolled in current study, including 20 cases of inattention subtype, 1 case of hyperactivity-impulsivity subtype and 27 cases of combined subtype. The average age was 9y (6-14y). The concentration index was calculated from the result of tablet-PC-based cancellation test, which was used to evaluated the objective concentration level.For each participant, the 3D T1 and multi-echo GRE sequence were performed to acquire the MRI data with 3.0T MRI (Signa, Pioneer, GE, America). The R2* maps were calculated using STISuite toolbox (https://people.eecs.berkeley.edu/~chunlei.liu/software.html). To extract the atlas based R2* values, T1 anatomical images of each subjects were first co-registered to the first echo amplitude image acquired using multi-echo GRE sequence. Then, the co-registered T1 images were normalized to MNI space using SPM12. Thereafter, all the R2* and QSM images could transformed to MNI space. Last, the AAL atlas were applied to all the normalized images to extract the values of the former 90 regions. Pearson’s correlation test was used as statistic method to assess the associations.Results
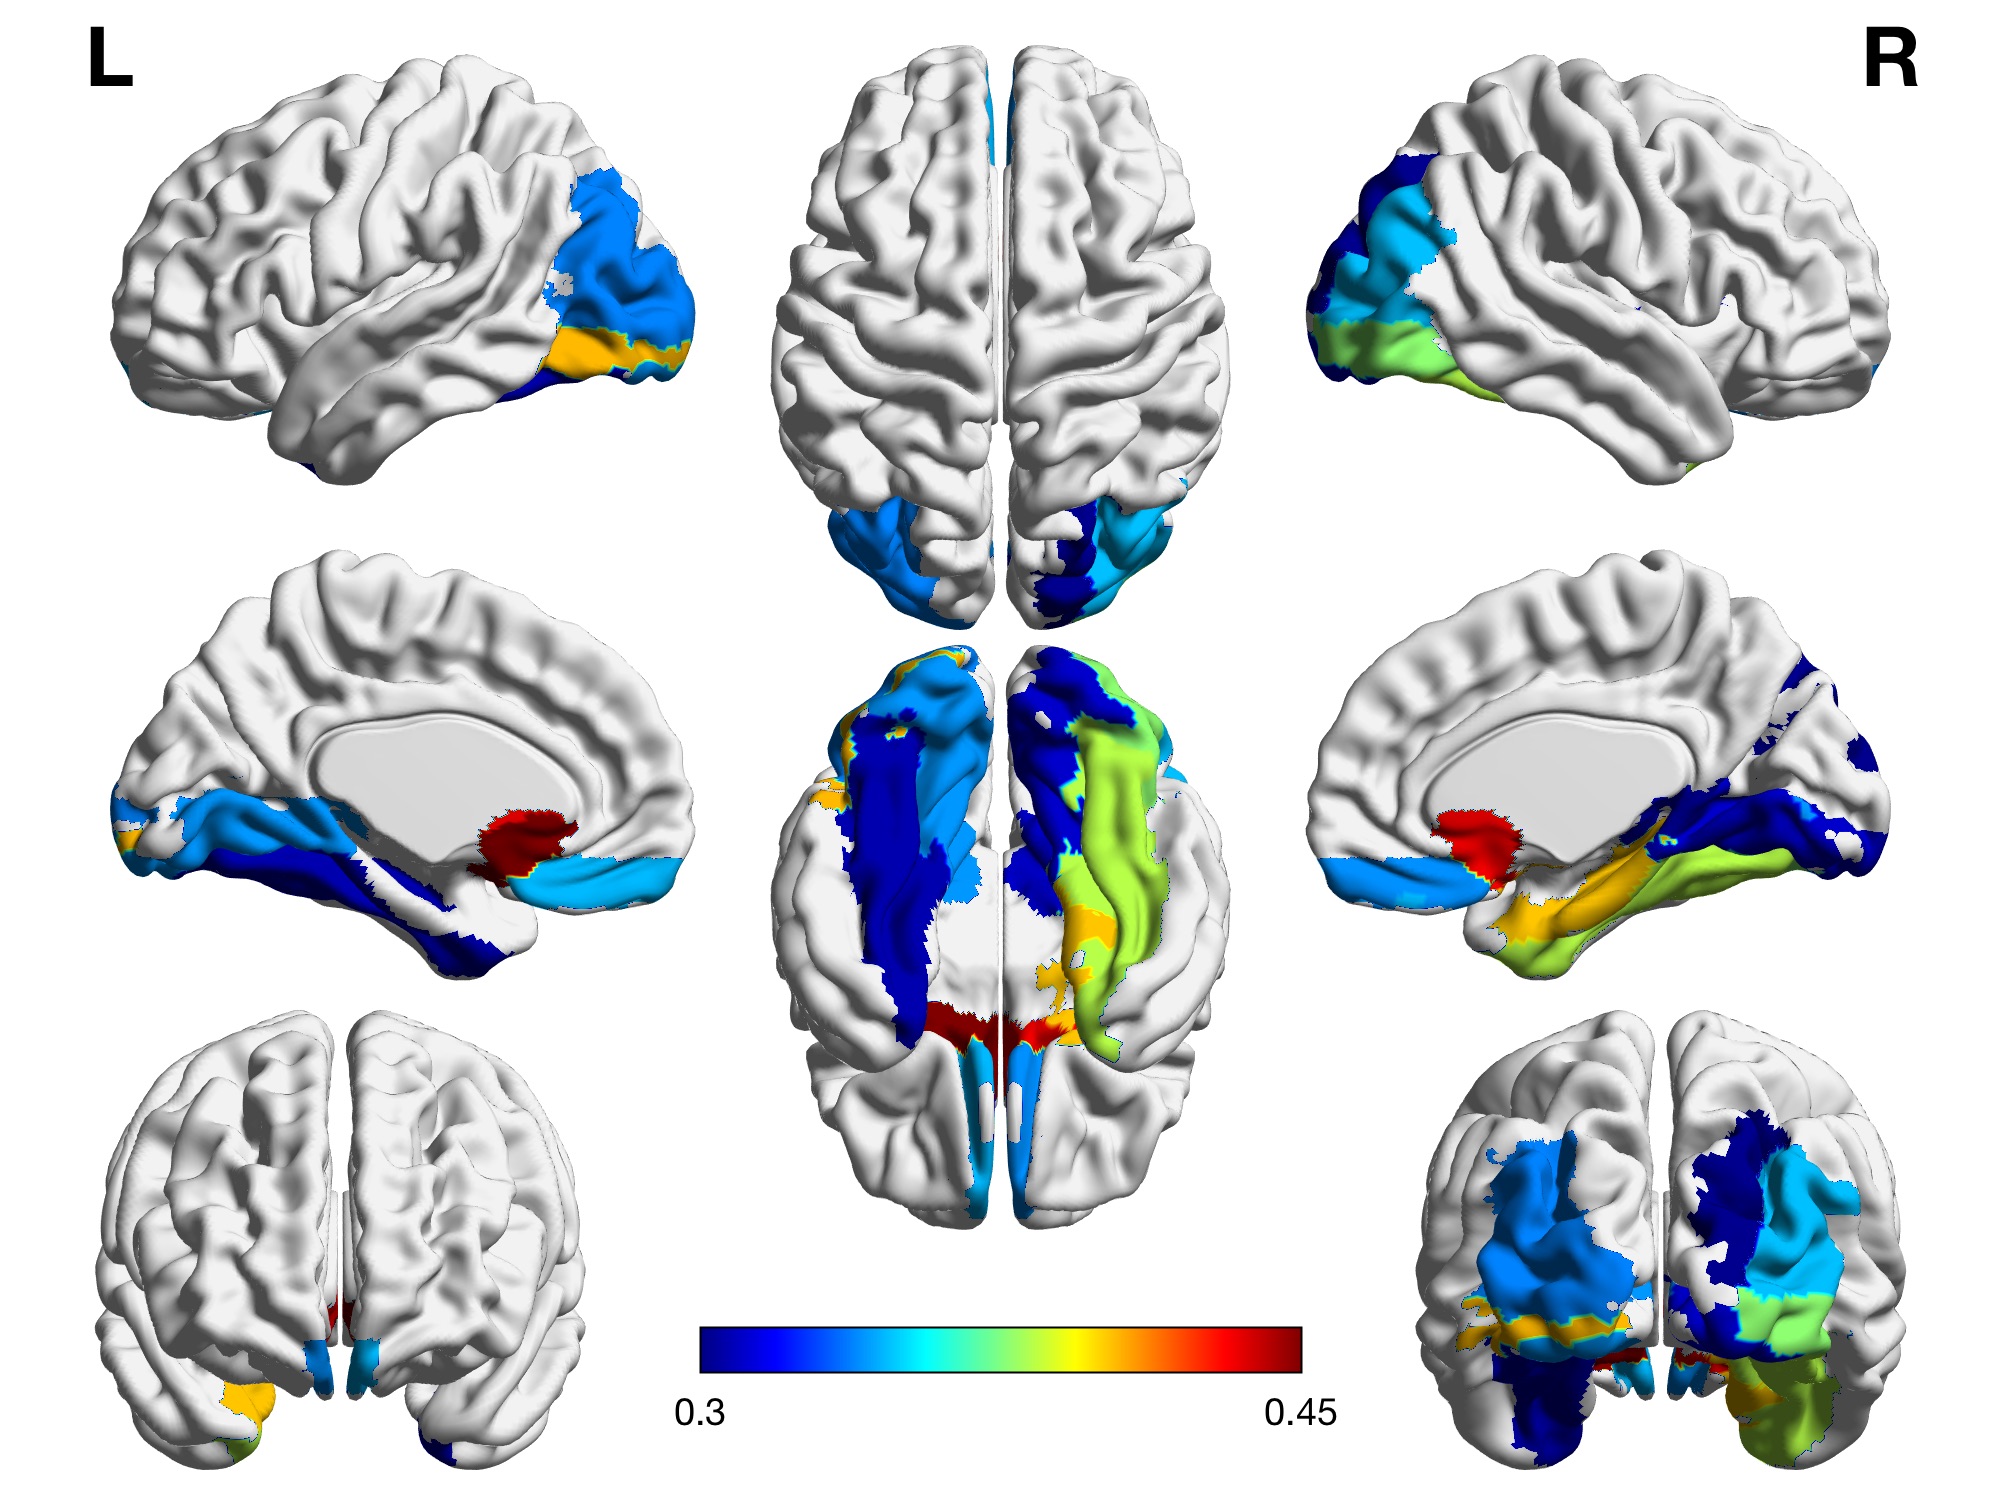
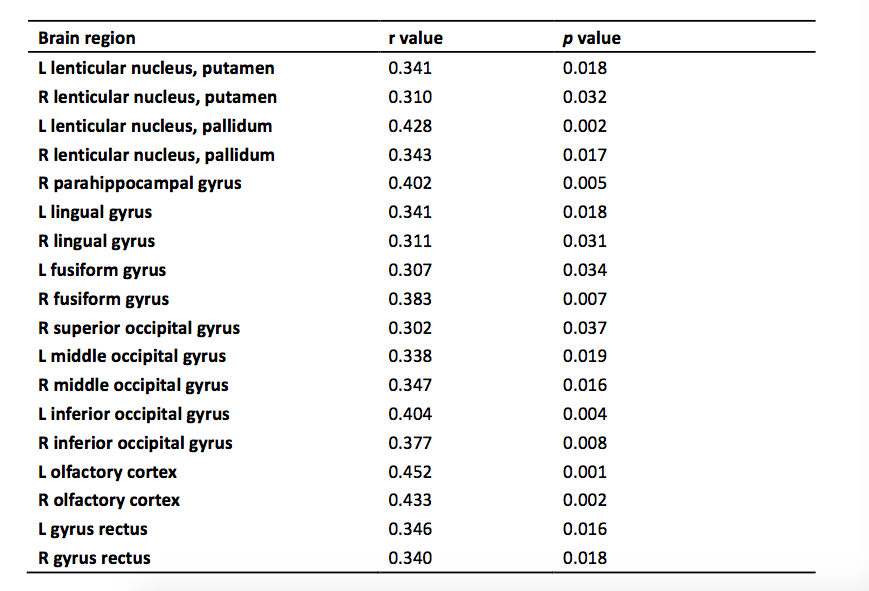
The R2* values in the bilateral lenticular nucleuses, lingual gyri, fusiform gyri, olfactory cortexes, gyrus rectuses , middle and inferior occipital gyri and the right superior occipital gyrus, parahippocampal gyrus were found to have correlation with the concentration index in ADHD patients (r>0.3, p<0.05, Table 1, Figure 1). The lenticular nucleus, occipital gyrus and parahippocampal gyrus showed the highest correlation index of 0.428, 0.404 and 0.396, respectively.Discussion
Iron deficiency relates to many cognitive functions and neurobehavioral disorders in children.1 It was reported that serum ferritin level was lower in ADHD case. However, the correlation between the serum iron level or brain iron level and the ADHD still remains controversial.2,3 R2* mapping is a MR technique that depicts and quantifies magnetic susceptibility sources, which can map iron, the dominant susceptibility source in the brain, effectively and accurately.4 R2* value is a metric to reveal the iron deposition, while it can be influenced by the other factors such as deoxyhemoglobin hemosiderin. In current research, most regions were found to have correlation with the severity of ADHD symptom using R2* mapping. Most of those regions were located in the relative old structure of the brain, which was known to have closer relationship with the motion and behavior control than the other area. In some functional connectivity studies, these regions are also reported to reveal its connection with symptom in ADHD patient.5,6 Previous study reported that the iron level in the basal ganglia increased prominently after long-term psychostimulant treatment,7 which may support that our finding was reasonable. What’s more, the change of R2* value may be also influenced by brain perfusion, which also played a critical role in ADHD.8Conclusion
Our results indicated that the correlations between the R2* value and the symptom severity of ADHD were found in in brain regions within the basal ganglia region, temporal lobe and occipital lobe. All those results indicated that R2* mapping might have the potential efficacy in the auxiliary diagnosis of ADHD.Acknowledgements
None.References
1. Pivina, L., et al., Iron Deficiency, Cognitive Functions, and Neurobehavioral Disorders in Children. J Mol Neurosci, 2019. 68(1): p. 1-10.
2. Wang, Y., et al., Iron Status in Attention-Deficit/Hyperactivity Disorder: A Systematic Review and Meta-Analysis. PLoS One, 2017. 12(1): p. e0169145.
3. Adisetiyo, V. and J.A. Helpern, Brain iron: a promising noninvasive biomarker of attention-deficit/hyperactivity disorder that warrants further investigation. Biomark Med, 2015. 9(5): p. 403-6.
4. Eskreis-Winkler, S., et al., The clinical utility of QSM: disease diagnosis, medical management, and surgical planning. NMR Biomed, 2017. 30(4).
5. Soros, P., et al., Hyperactivity/restlessness is associated with increased functional connectivity in adults with ADHD: a dimensional analysis of resting state fMRI. BMC Psychiatry, 2019. 19(1): p. 43.
6. Lin, H., et al., Functional Connectivity of Attention-Related Networks in Drug-Naive Children With ADHD. J Atten Disord, 2018: p. 1087054718802017.
7. Adisetiyo, V., et al., Brain iron levels in attention-deficit/hyperactivity disorder normalize as a function of psychostimulant treatment duration. Neuroimage Clin, 2019. 24: p. 101993.
8. Tan, Y.W., et al., Alterations of cerebral perfusion and functional brain connectivity in medication-naive male adults with attention-deficit/hyperactivity disorder. CNS Neurosci Ther, 2019.
Figures