4693
3D automatic segmentation analysis of pituitary in children with precocious puberty1The Affiliated Hospital of Yangzhou University, Yangzhou, China, 2GE Healthcare, MR Research China, Beijing, P.R. China, Beijing, China
Synopsis
To explore changes of pituitary morphology in precocious children.An in-house software based on Matlab platform was used to obtain pituitary morphological measurements. In this research the height of the pituitary in the CPP group was higher than that in the PPP group and the normal group. The pituitary volume of the CPP group was larger than that of the normal group.Pituitary volume and surface area of CCP group were positively correlated with hormone metabolism levels. The height of pituitary gland is still the index of differential diagnosis, however pituitary volume and surface area have better correlation with hormone level.
Purpose
Precocious puberty is one kind of common developmental disease and mostly occurs in girls. This disease can be divided into the center precocious puberty (CPP) and peripheral precocious puberty (PPP). Magnetic resonance imaging (MRI) can be used to follow the shape and pathological changes of pituitary. Abnormal function of pituitary disturbs the endocrine homeostasis in children and harms their natural physical development[1]. However, the traditional hypophyseal morphological measurement is limited in morphological descriptions such as hypophyseal longitude line and shape. An objective tool to obtain pituitary morphological measurements with high-resolution magnetic resonance imaging (HRMRI) is essential. Therefore, this study aims to assess the concrete changes of pituitary morphology in children with precocious puberty and to explore the correlation between precocious puberty and hormone metabolism.Materials and Methods
Subjects:36 female patients (8.18±0.77 years old) diagnosed as precocious puberty (12 with CPP and 24 with PPP) were recruited as the experimental group, and 22 normal girls (7.93±1.1 years old) were chosen as the control group. Basic information contains disease comorbidity, medical history, related family history and the secondary sexual sign (breast development, menarche, etc.). Laboratory tests included thyroid function, luteinizing hormone stimulation tests, and levels of sex hormones (serum testosterone, estradiol, and prolactin). Luteotropic hormone (LH) peak/follicle-stimulating hormone (FSH) peak > 0. 6 in the gonadotrophin-releasing hormone (GnRH) test was viewed as positive reaction.
MRI Experiment:
All MRI experiments were performed on a 3T scanner (750W, GE, USA) equipped with a 16 channel brain coil. 3D high resolution T1-weighted anatomical images were acquired with the scan parameters of TR/TE = 1900/2.52 ms, TI = 900 ms, slice thickness= 1.0 mm, flip angle= 9 degrees, acquisition matrix = 256×256, and FOV = 250×250 mm2. The scan time was 4 minutes.
Data analysis:
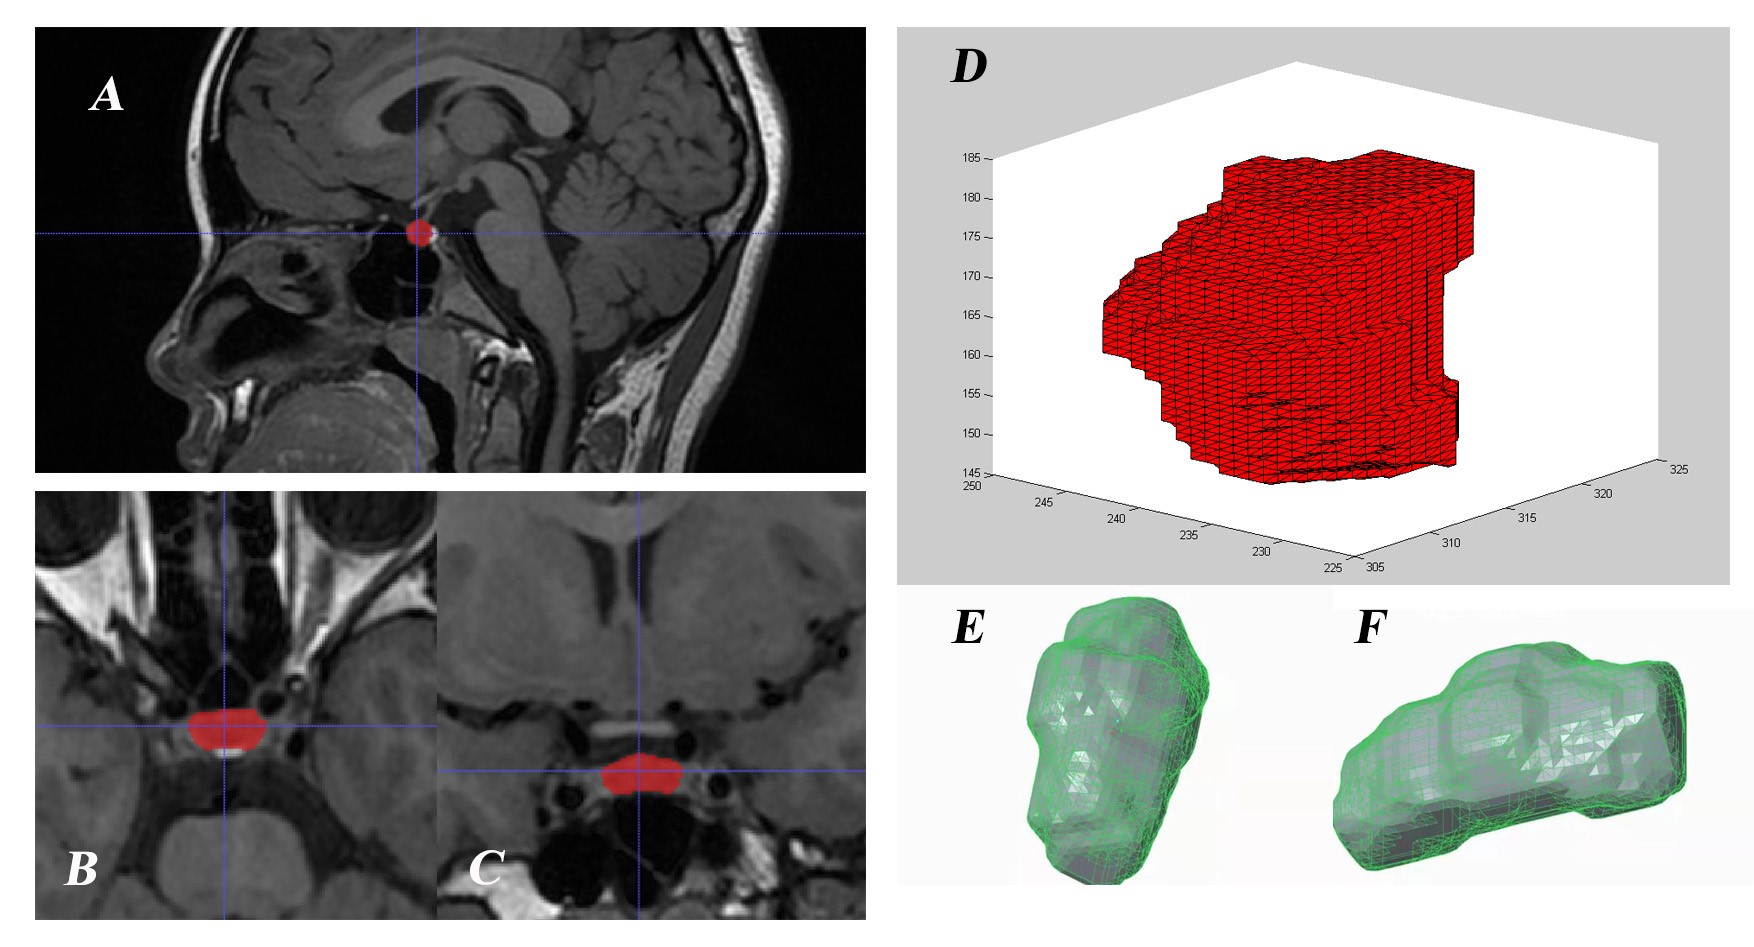
An in-house software based on Matlab platform was used for data analysis.The analysis steps were as follows: First, placed a user-defined seed point in the target, which was then expanded outward. The boundary of pituitary gland was determined by interactive watershed method based on gradient calculation. After the boundary was recognized automatically, the resultant segmentation was manually modified slightly by mask editing tool. With prior knowledge from the physician, the interactive semi-automatic segmentation method helped to achieve the best outcome of the structure with unclear boundary such as the pituitary gland after manual proofreading and modifying the automatic segmentation. Finally, the number of pixels in the region of interest was summed up and calculated for the total volume. The three-dimensional surface reconstruction of pituitary adopted vertex-based surface reconstruction so that the surface area of pituitary was more accurate.
Results
The resultant segmentation has been shown in Figure 1.The mean value and standard deviation of each diameter, volume and surface area of pituitary in different groups were shown in Table 1. The height of the pituitary gland in the CPP group was respectively higher than that in the PPP group(p=0.029)and in the normal group(p=0.044). The pituitary volume of the CPP group was larger than that of the normal group(p=0.037). There was no statistical difference in pituitary surface area among these three groups. The correlation analysis showed that the pituitary volume and surface area of the children with CPP were significantly positively correlated with the LH peak value, FSH peak value and thyroid stimulating hormone. The specific values are shown in Figure 2. Moreover, in the CPP group, the pituitary height and diameter were correlated with the LH excitation peak value (p=0.01, r=0.43) .Discussion and Conclusions
The three-dimensional morphological data of the pituitary were significantly correlated with the hormone level of the CPP group. As consistent with previous research, morphological changes of the pituitary gland could reflect pituitary function alterations. The height of the pituitary gland was an effective marker to distinguish the CPP groups from the others [2], although it was not highly correlated with hormone metabolism. In comparison, the volume and surface area of pituitary gland show a better correlation with the hormone level. Therefore, the height and diameter of pituitary measured by MRI were important parameters to be obtained for diagnosis, while the volume and surface area of pituitary were reference indicators for disease assessment and treatment intervention. They are complementary to each other and useful in clinical diagnosis and treatments. With the self-developing multi-modal image processing and analysis technique, our clinical evaluation improved and advanced. To sum up, the changes in the pituitary morphology can reflect alterations of the pituitary function. The three-dimensional morphology of pituitary gland showed a good correlation with serum gonadotropin levels and sexual development. Multi-modal pituitary morphology analysis can be used as a reference for the diagnosis and treatment of precocious puberty.Acknowledgements
We confirm that the manuscript has been read and approved by all named authors and there areno known conflicts of interest associated with this publication.All protocols of this study were approved by the ethics committee of the Yangzhou University, Yangzhou, China.References
[1] Ergür AT, Gül H, Gül A. Methylphenidate and Central Precocious Puberty: A Probable Side Effect among Seven Children with the Attention Deficit Hyperactivity Disorder. Clin Psychopharmacol Neurosci, 2019,17(3):446-449.
[2] Kessler M, Tenner M, Frey M, et al. Pituitary volume in children with growth hormone deficiency, idiopathic short stature and controls. J Pediatr Endocrinol Metab, 2016,29(10):1195-1200.
Figures