4690
Utilising multi-parametric MRI to non-invasively predict tumour type in paediatric neuro-oncological disease: a multi-centre study.1University of Birmingham, BIRMINGHAM, United Kingdom, 2University of Birmingham, Birmingham, United Kingdom, 3Birmingham Women's and CHildren's NHS foundation trust, Birmingham, United Kingdom, 4Birmingham Women's and Children's NHS foundation trust, Birmingham, United Kingdom, 5Aston University, Birmingham, United Kingdom, 6Alder Hey Children's NHS foundation trust, Liverpool, United Kingdom, 7Institute of Translation Medicine, University of Liverpool, Liverpool, United Kingdom, 8University of Nottingham, Nottingham, United Kingdom, 9Royal Victoria Infirmary, Newcastle, United Kingdom, 10University of Warwick, Warwick, United Kingdom
Synopsis
This study focuses on utilising supervised Machine Learning to combine both diffusion and perfusion weighted imaging to discriminate between the three most common pediatric brain tumour types: Pilocytic Astrocytoma, Ependymoma, and Medulloblastoma.
Introduction
Brain tumours are the most common solid tumour in children, accounting for approximately 25% of all childhood cancers. Challenges are faced by paediatric radiologists to diagnose paediatric brain tumour type, especially in tumours which do not enhance (a significant fraction in paediatric radiology)1. Spectroscopic methods have been shown to be highly predictive in discriminating between tumour types, however this technique is challenging to acquire in regions of the brain with poor magnetic field homogeneity and small lesions2,3. Therefore, other more commonly used imaging-based methods may be favourable to discriminate between tumour types in the paediatric brain. Previous results have shown the ability of supervised machine learning methods to separate between tumour subtypes and high/low grade tumours using magnetic resonance spectroscopy, with good results demonstrated4.Methods
Patient recruitment49 participants with suspected brain tumours (medulloblastoma (N = 17), pilocytic astrocytoma (N = 22), ependymoma (N = 10)) were recruited from 4 clinical sites in the United Kingdom (Ethics reference: 04/MRE04/41, Birmingham Children’s Hospital, Newcastle Royal Victoria Infirmary, Queen’s Medical Centre, Liverpool Alder Hey Children’s Hospital). Participants underwent MRI, protocol discussed below, before invasive biopsy to confirm diagnosis.
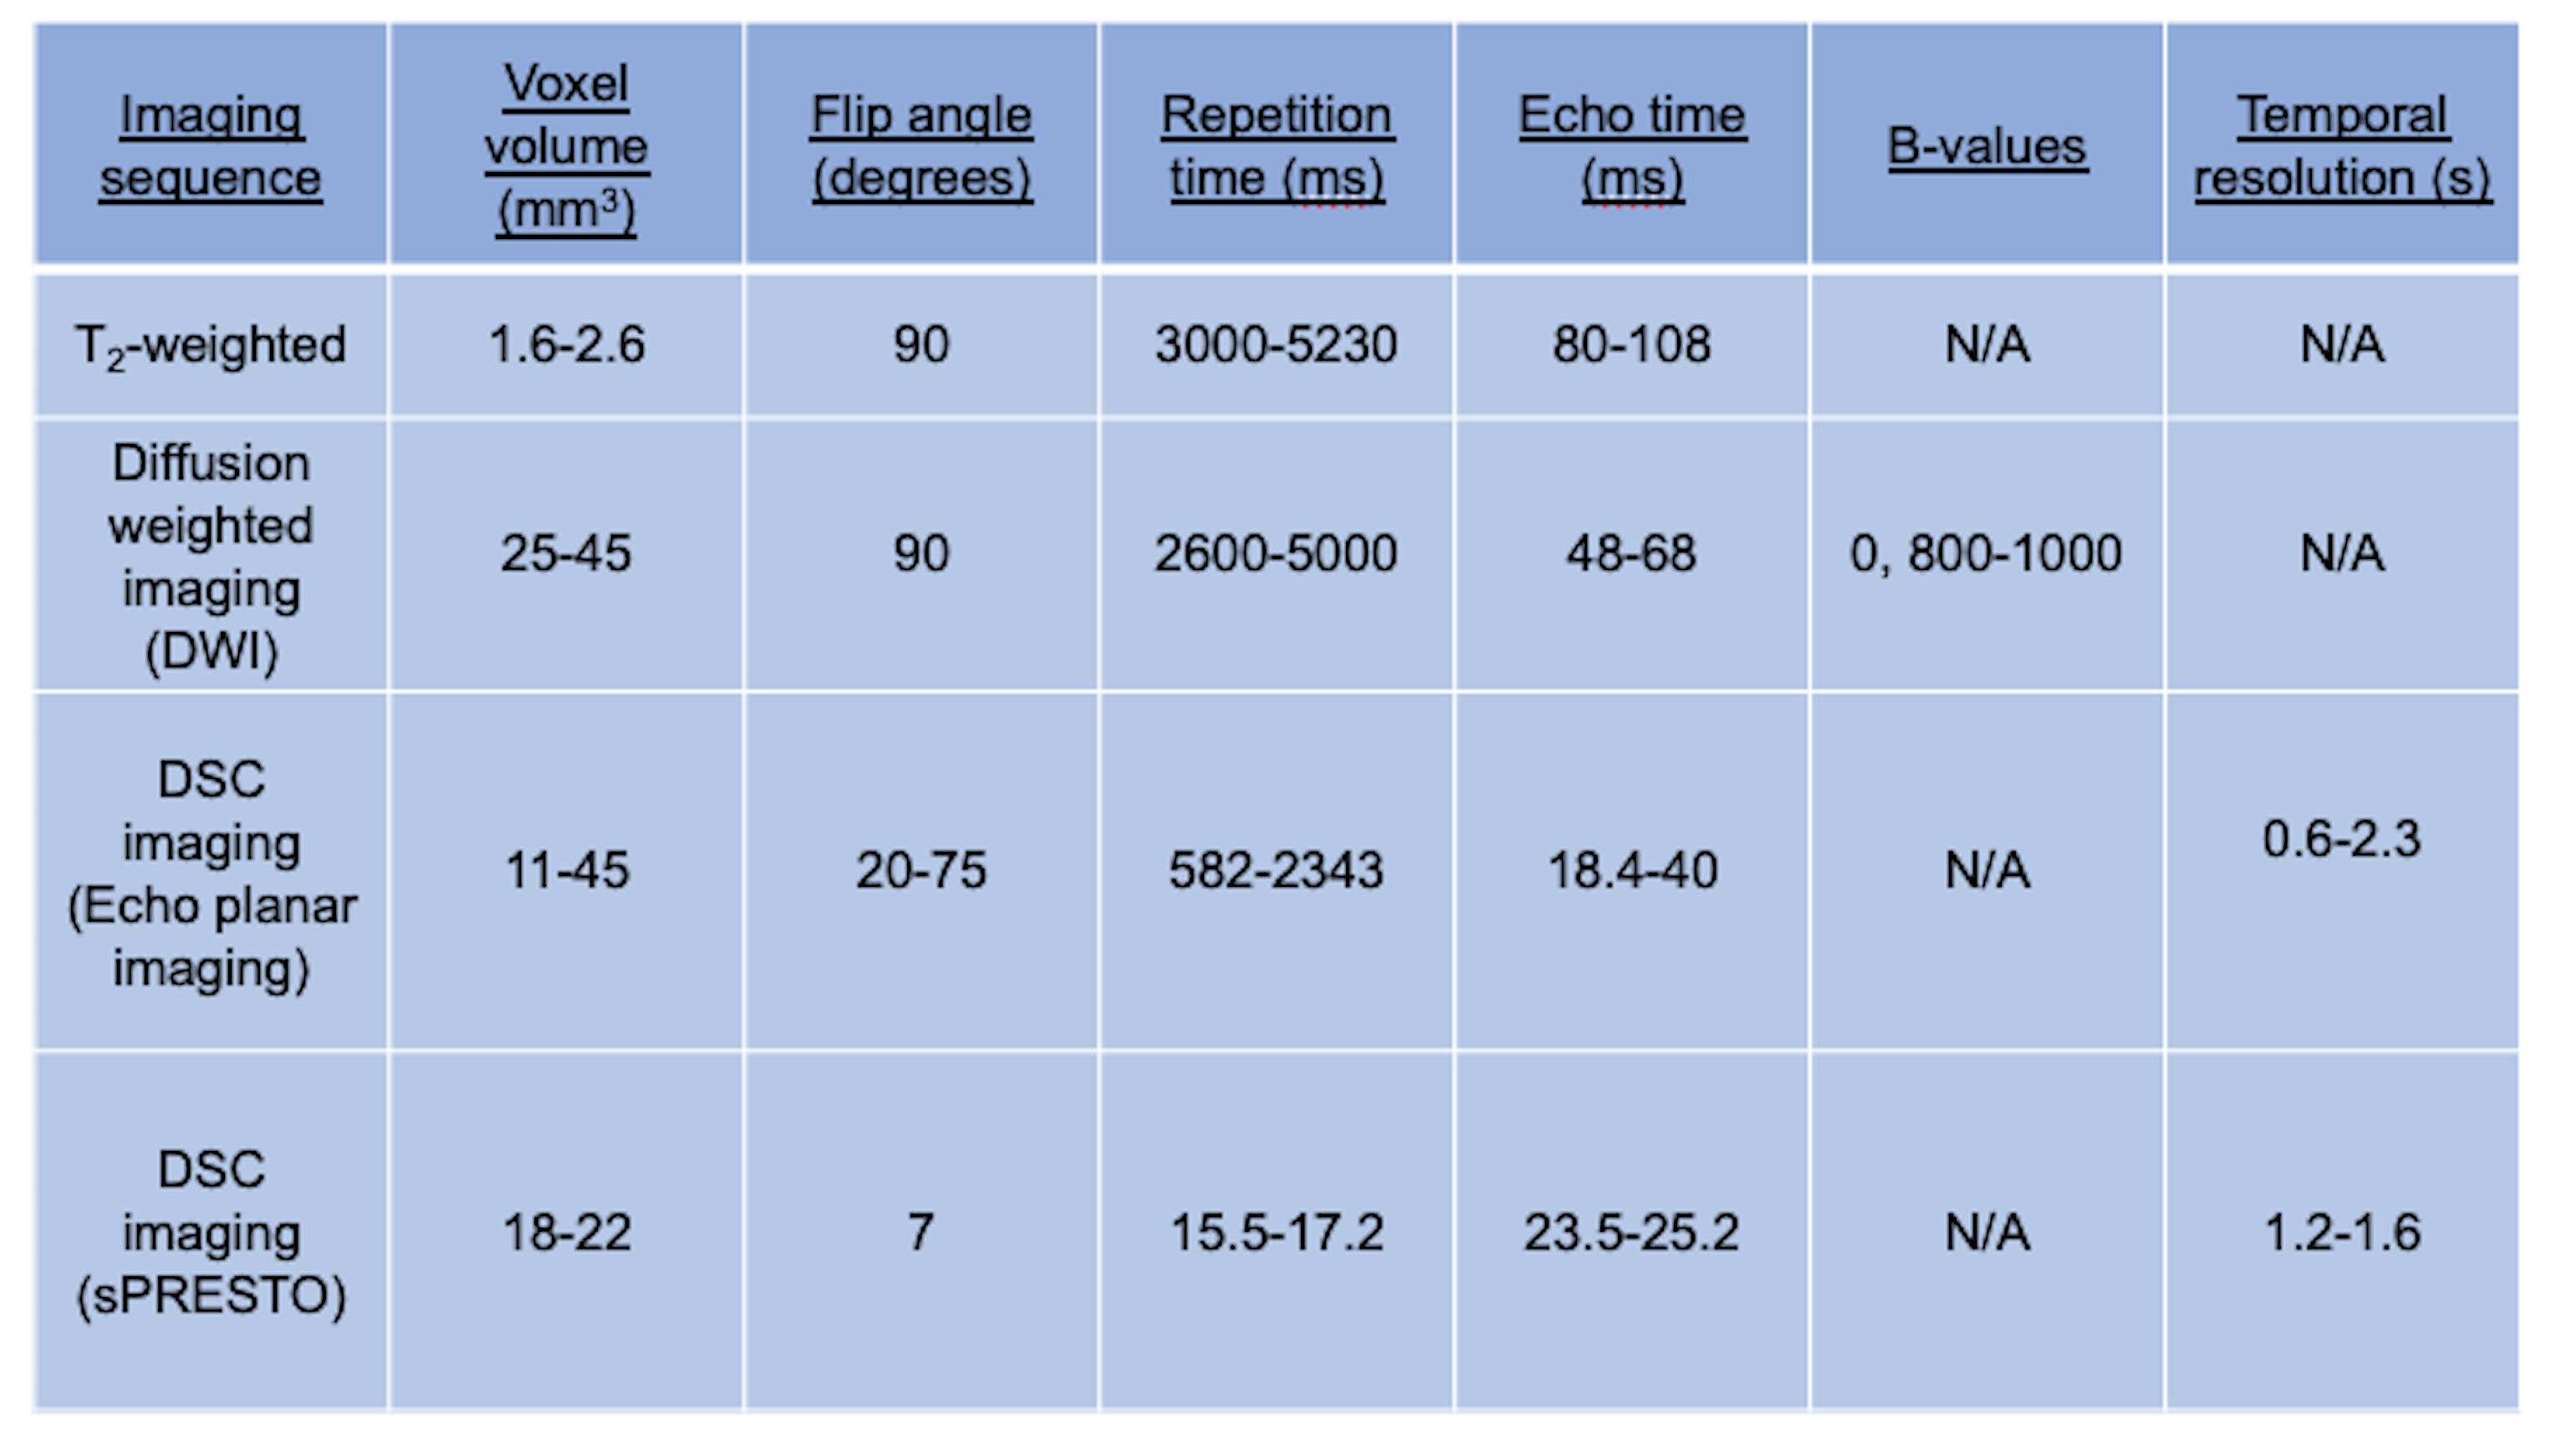
Magnetic resonance imaging
The imaging protocol for all participants was performed either at 3 or 1.5T and included standard anatomical imaging (T1-weighted, T2-weighted, T2-FLAIR, T1-post contrast), as well as diffusion weighted and dynamic susceptibility contrast, covering the tumour volume (imaging sequence and cohort details found in Table 1). T2- weighted, ADC, and T1-post contrast images were registered to the first DSC volume with SPM12 (UCL), and tumour regions of interest drawn on T2 weighted imaging. Image analysis, performed in Matlab (2018b, The Mathworks, MA), consisted of calculating the image mean, standard deviation, skewness, and kurtosis on a volume by volume basis for ADC and CBV maps for regions of interest and the whole brain. Tumour volume (cm3) was calculated from the T2 ROI masks.
Statistical analysis
Imaging features were tested for normality using a Shapiro-Wilk test in R (3.6.1) with subsequent ANOVA/Kruskal-Wallace and post-hoc tests performed to assess for differences in imaging features between low- and high-grade groups, and between tumour types. Receiver Operator Curves (ROC) were defined from significant imaging components for comparison of low versus high-grade tumours, and the area under the curve (AUC) calculated. Statistical significance was determined at p < 0.05, with Bonferroni correction for multiple comparisons.
Machine learning
Tumour volume, ADC and DSC region of interest and whole brain features were processed using principal component analysis to reduce dimensionality, aiming for 95% data variance or N-1 components where not possible (where N is the size of the smallest group). Supervised machine learning was performed using the Orange toolbox (Orange) in Python (3.6). A further approach to dimensionality reduction was performed by performing the univariate statistical analysis (described above in ‘statistical analysis’ section) on 3 stratified subsets of the imaging data (75:25% training:test set size). Where a feature was significant more than once, it was selected as a feature for supervised classification. This combination of significant features is termed here as the ‘optimised classifier’.
Results
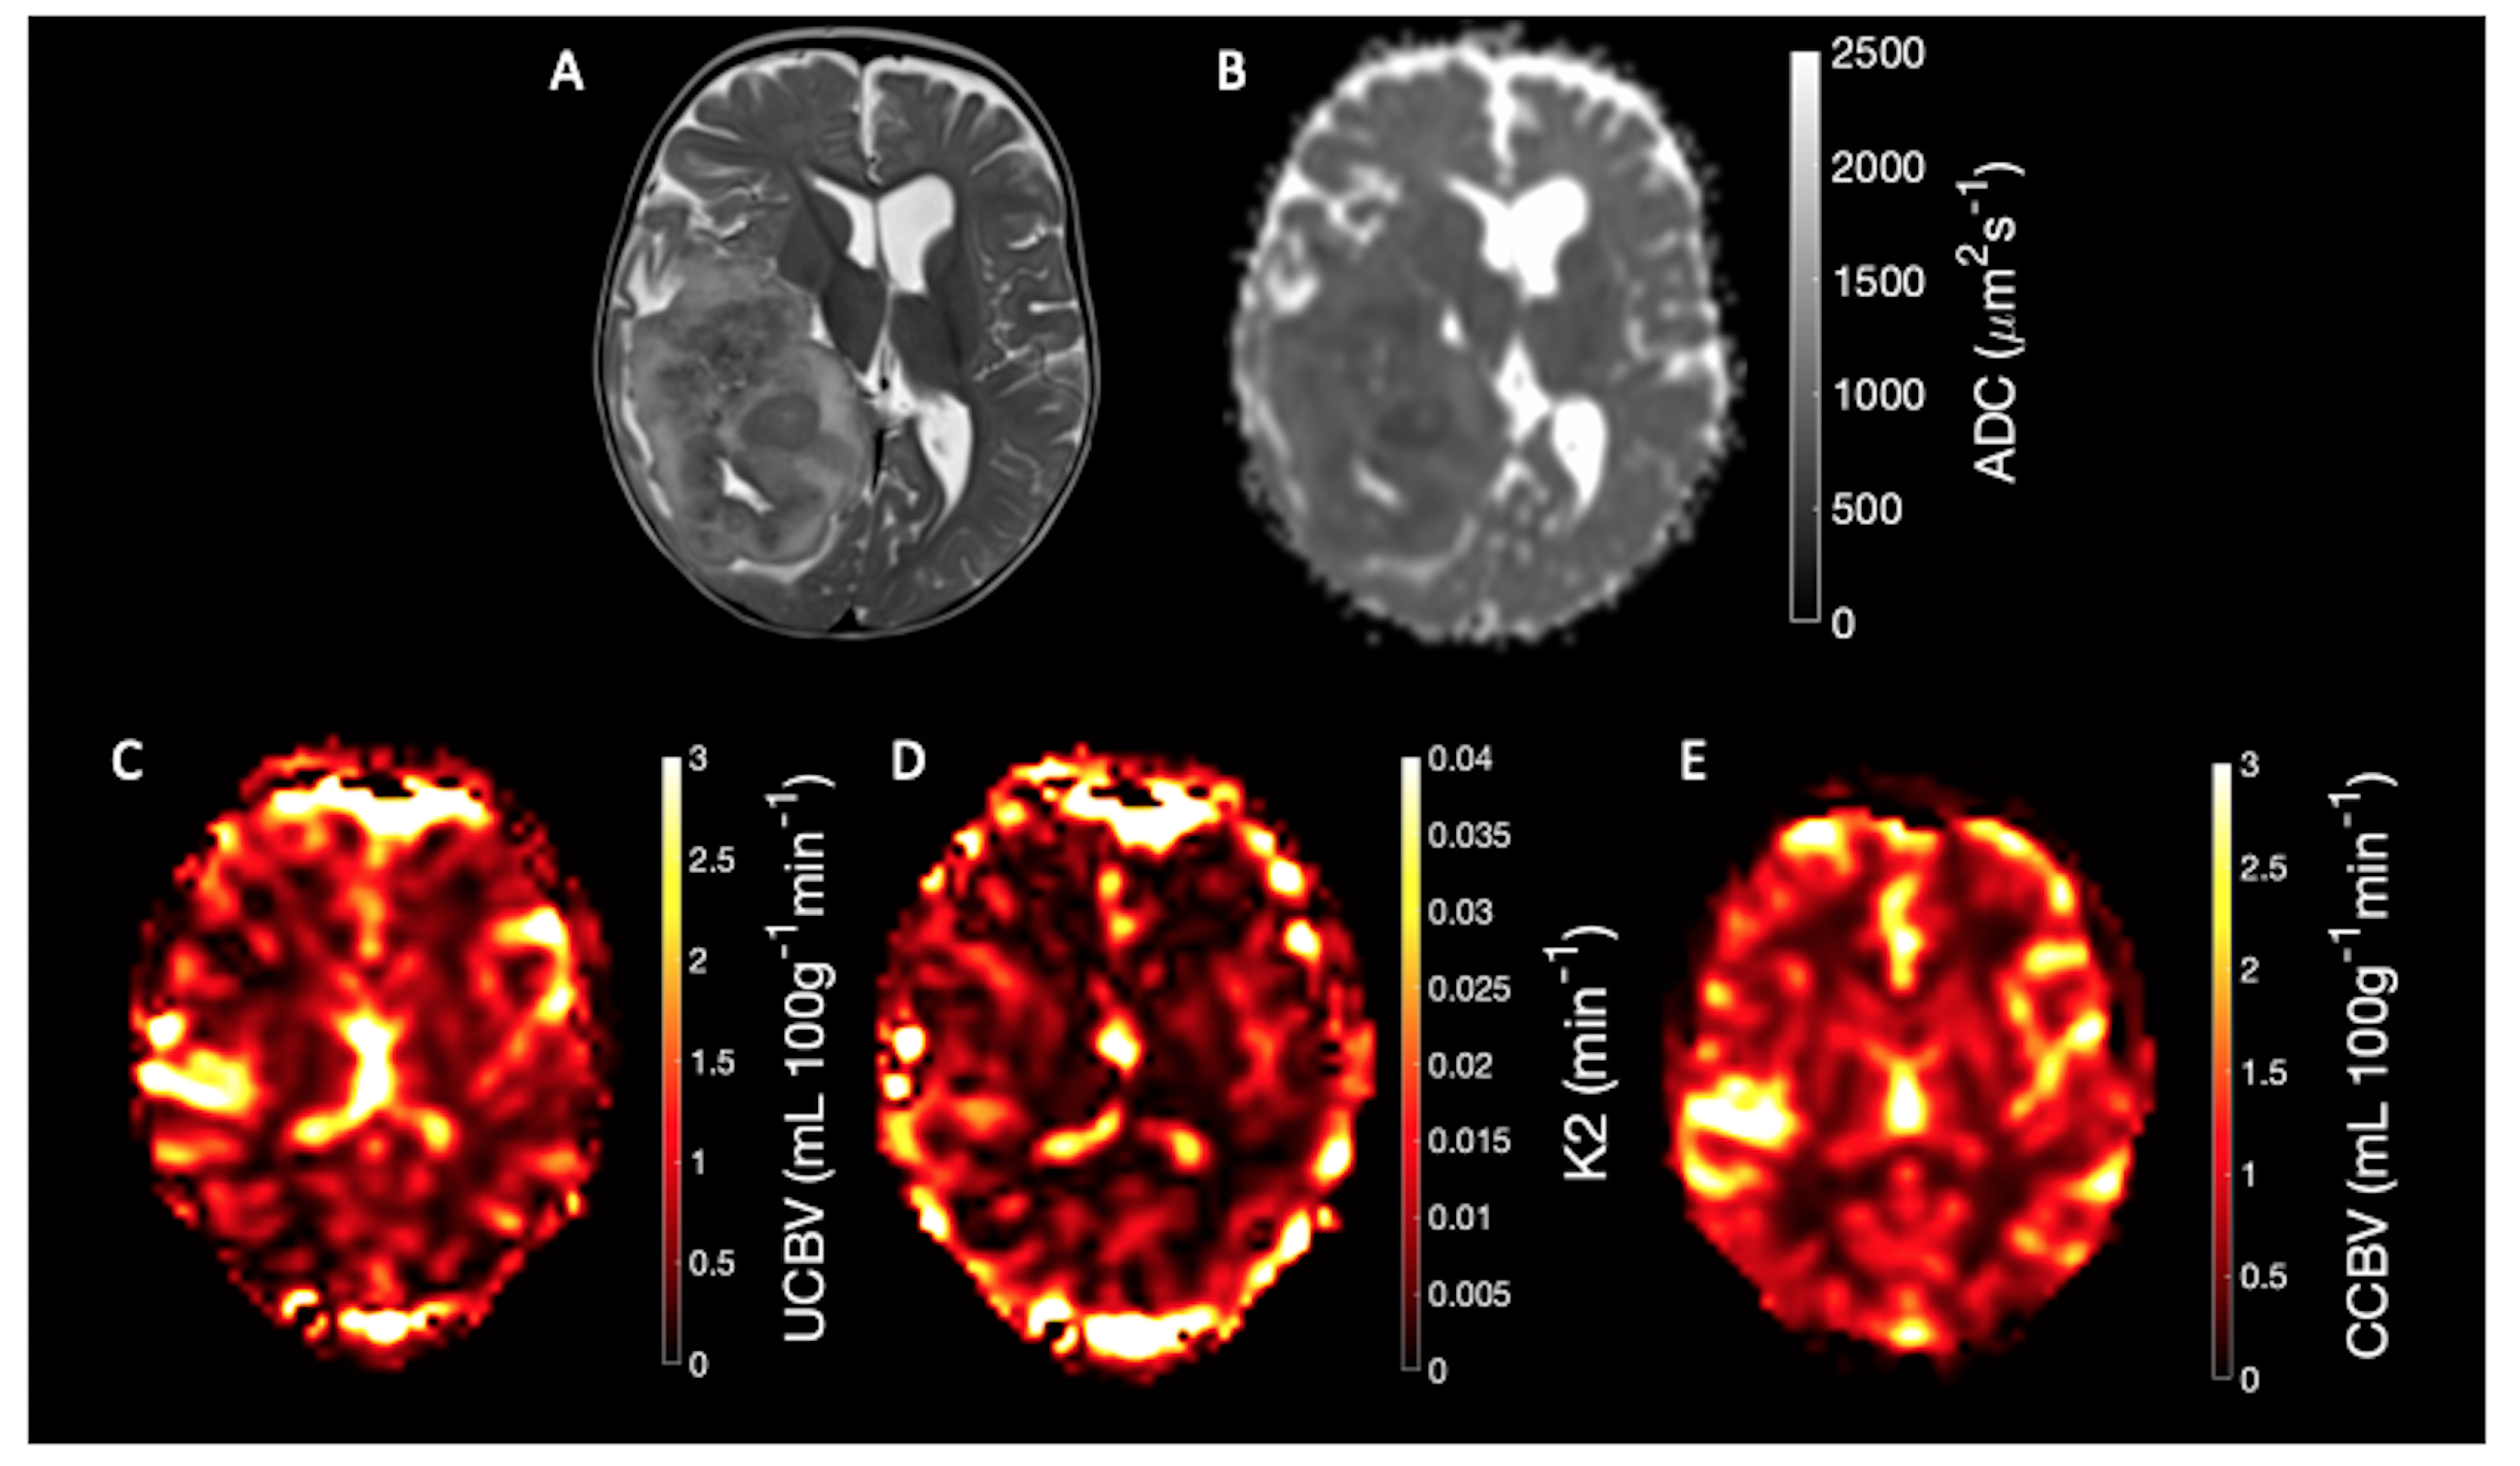
Example DSC and DWI imaging is shown in Figure 1: T2-weighted (A), ADC(B), Uncorrected CBV (C), K2 (D), and Corrected CBV (E).Tumour Region of interest analysis reveals features which differ between low- and high-grade tumours.
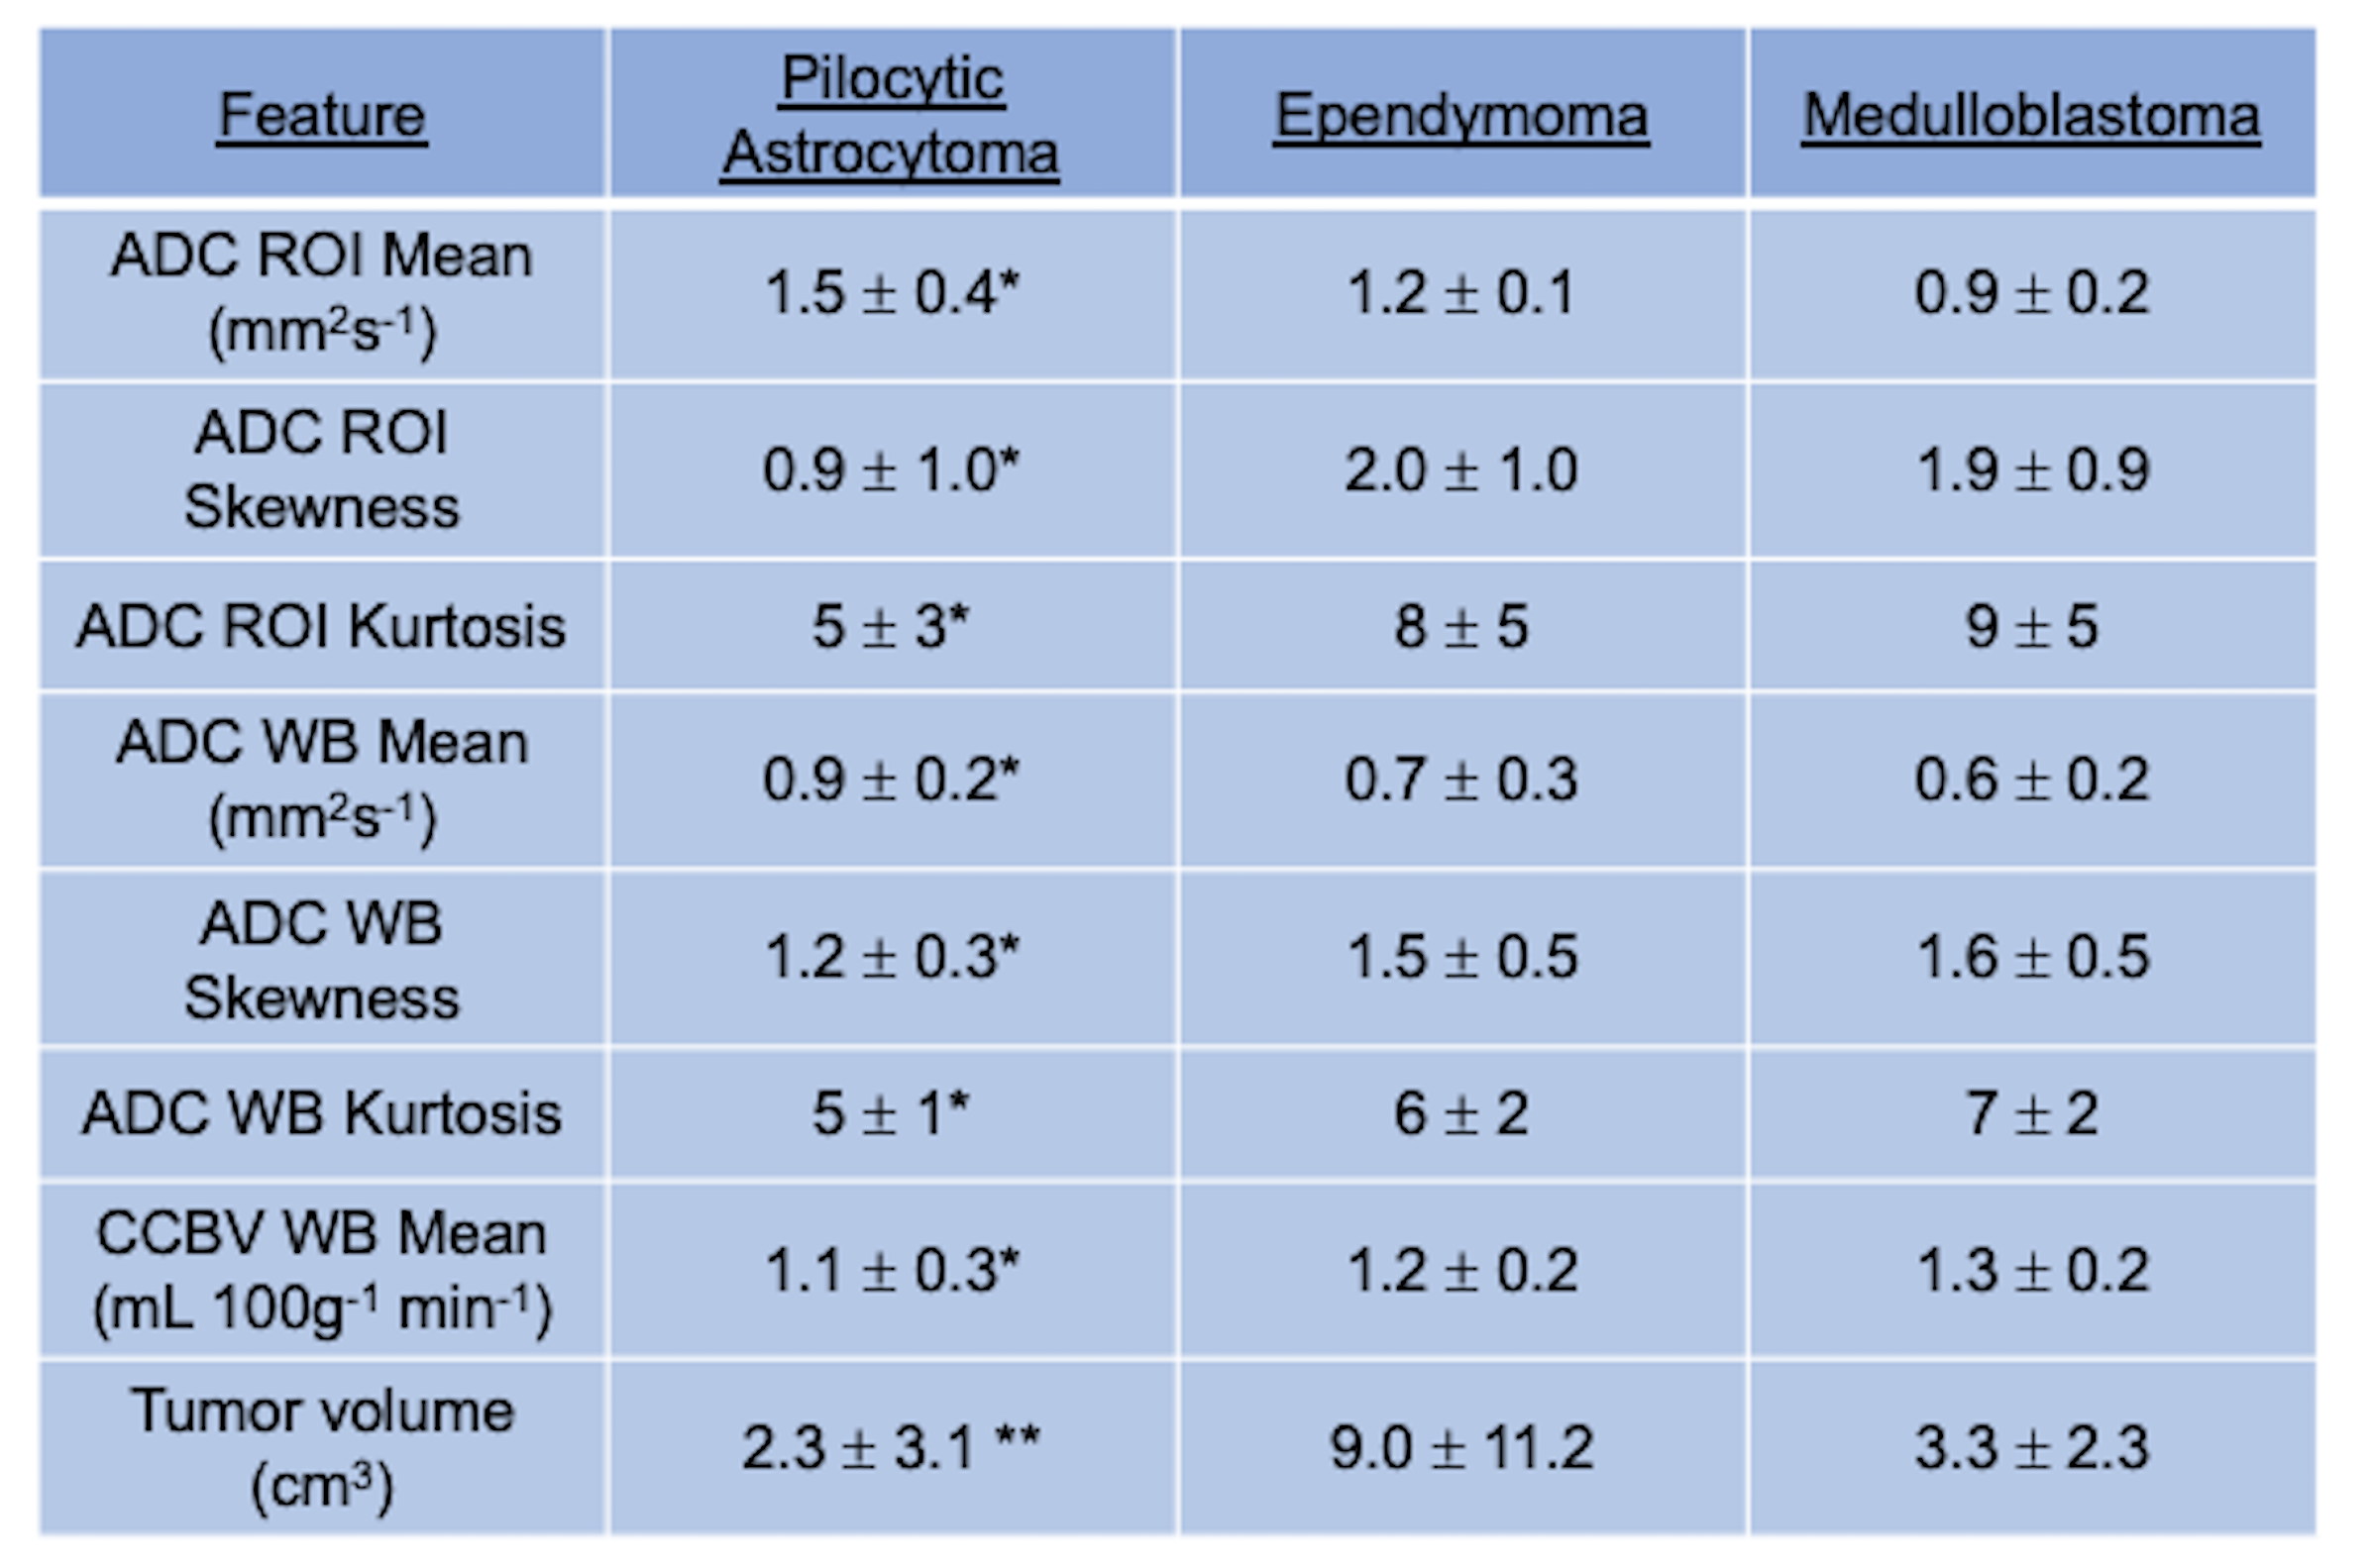
Analysis of region of interest and whole brain features revealed a number of imaging features that were significantly different between Pilocytic Astrocytomas and Medulloblastomas, with ADC ROI mean (1.5 ± 0.3 vs 0.9 ± 0.2 mm2 s-1, p < 0.001), ADC ROI skewness (0.9 ± 1.0 vs 1.9 ± 0.9, p = 0.006), ADC ROI kurtosis (5 ± 3 vs 9 ± 5, p = 0.045) showing significant differences between the aforementioned tumour sub-types. Full tumour subtype results are shown in Table 2.
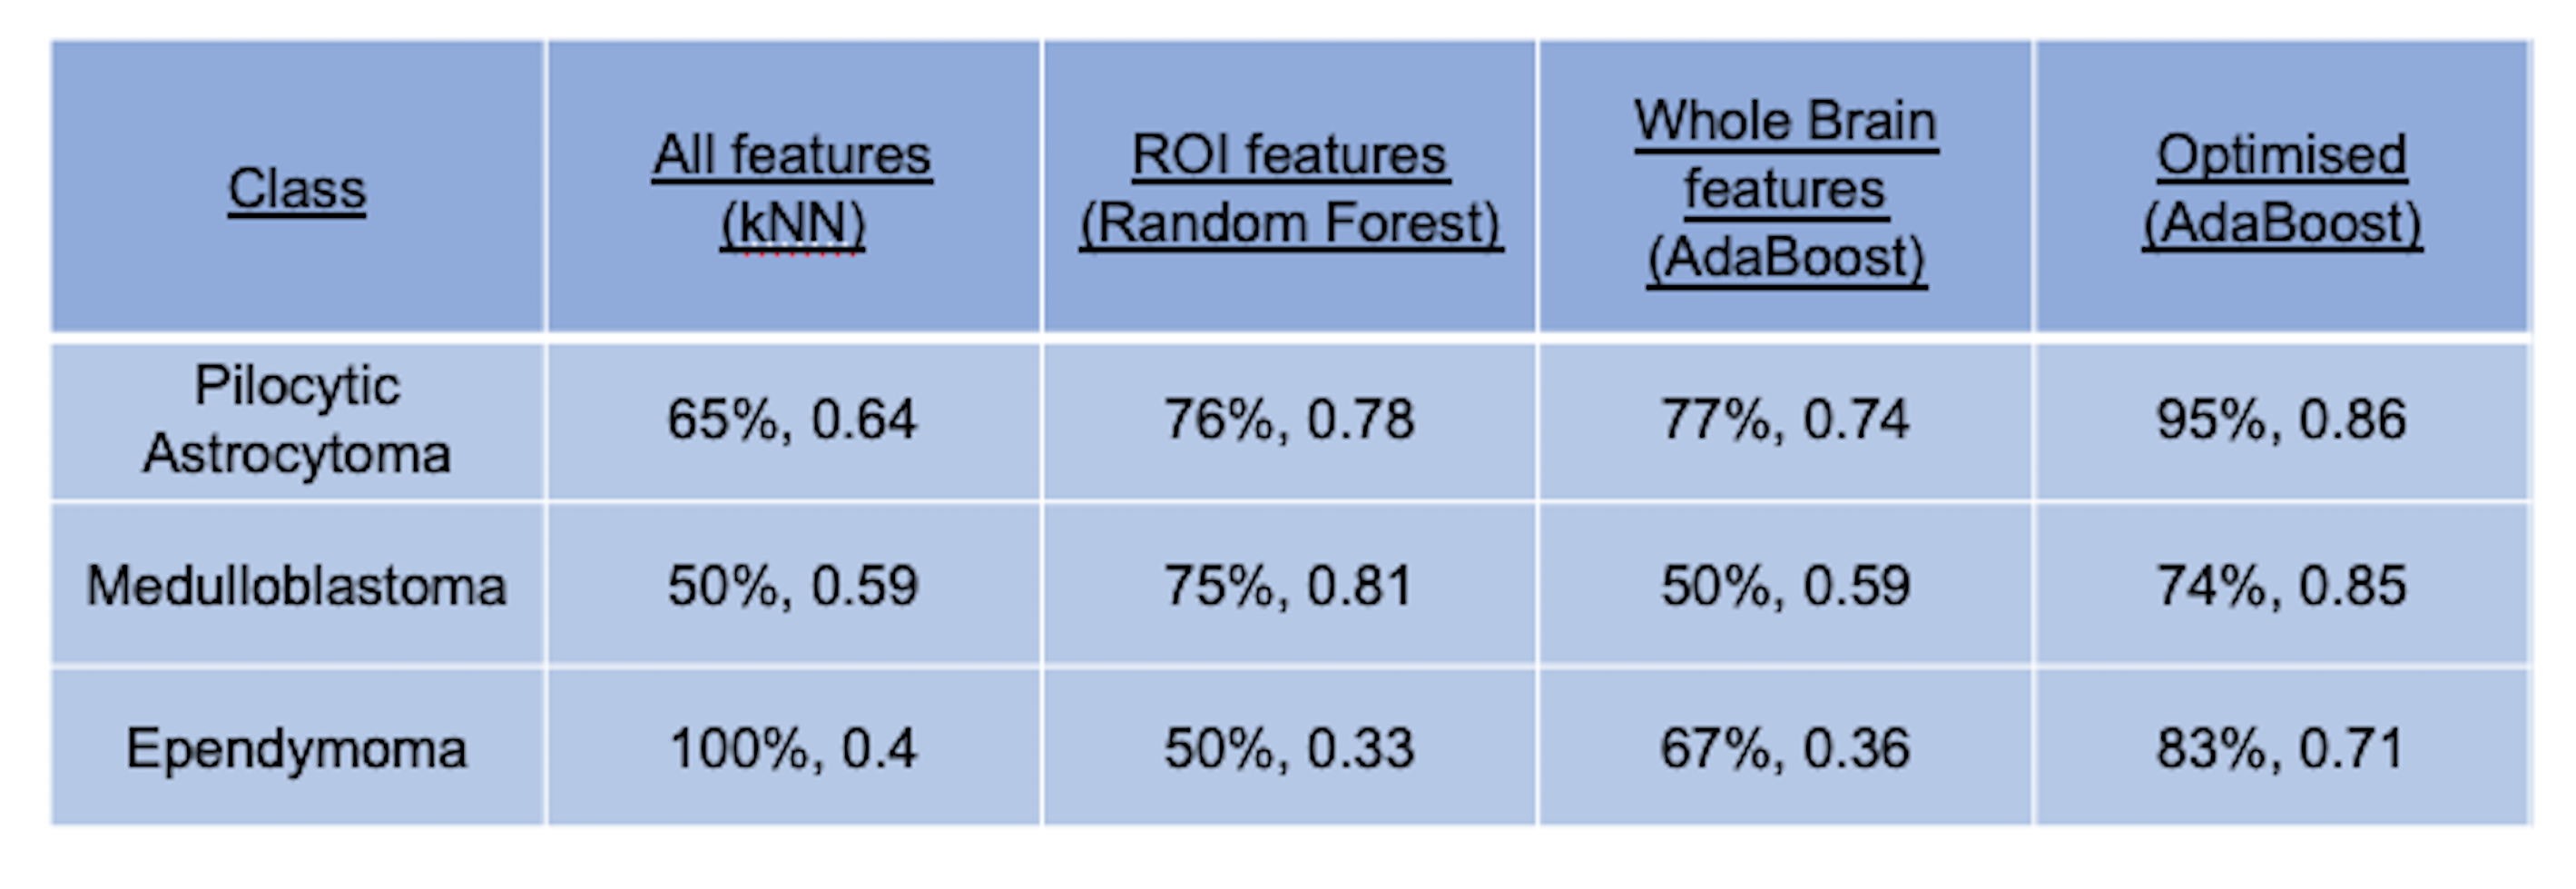
Supervised learning can distinguish between low- and high-grade tumours and tumour sub-types with a combination of region of interest and whole brain features.
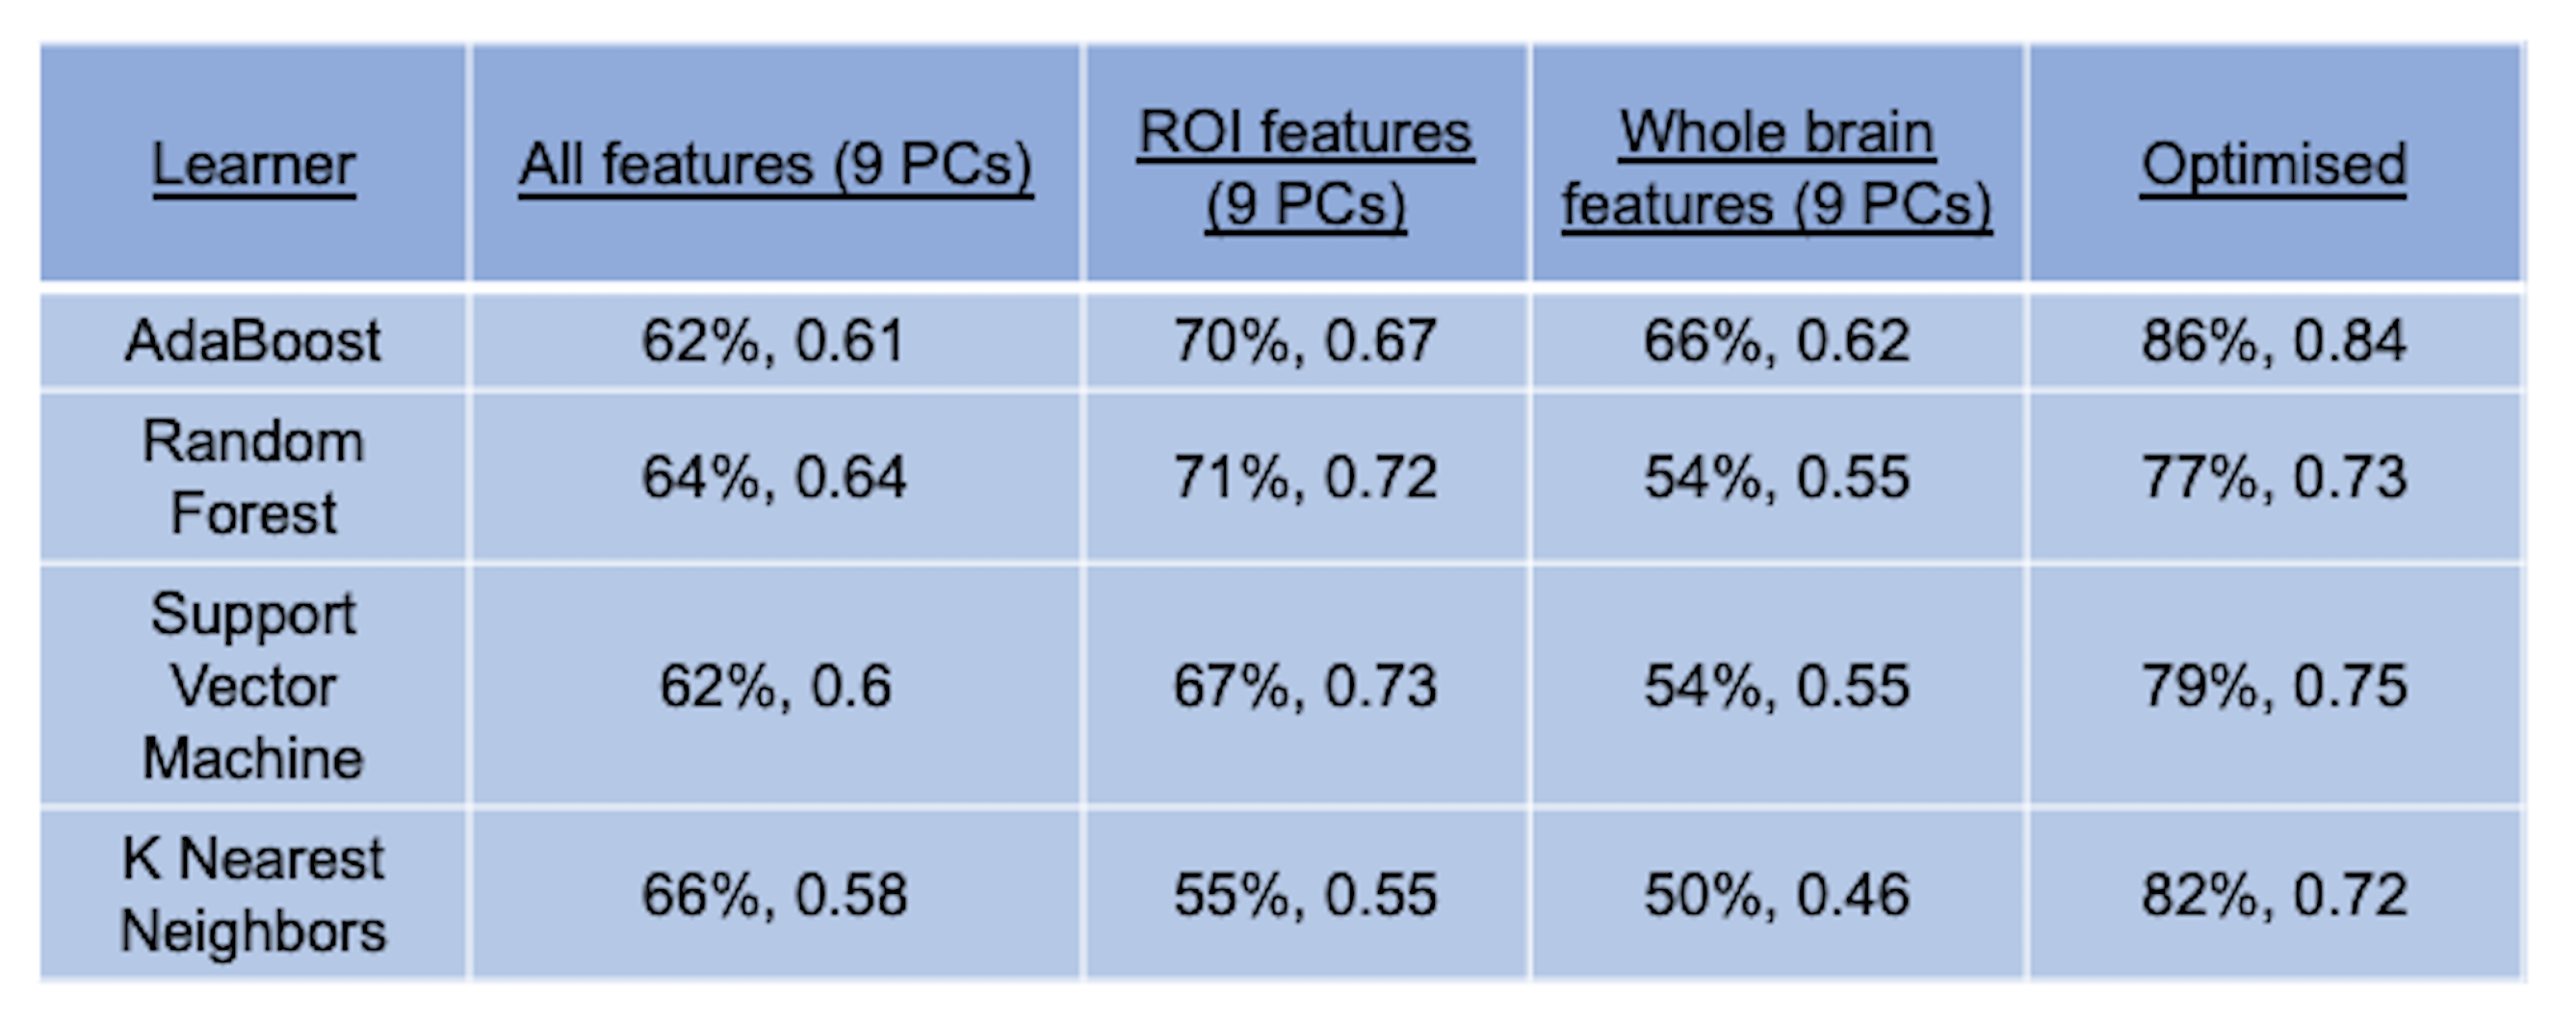
The results of supervised machine leaning for classifying Pilocytic Astrocytoma, Medulloblastomas, and Ependymoma tumours, are summarised in Tables 3 and 4. The best performing tumour type classifier, based on highest BAR, combined significant univariate imaging features (ADC ROI mean, ADC whole brain kurtosis, uncorrected CBV ROI skewness, and Tumour Volume) using an AdaBoost learner (precision = 86%, F-statistic = 0.85).
Discussion
This study has shown the utility of multi-modal magnetic resonance imaging to discriminate between the three most common paediatric brain tumour types. The best performing classifier combined features that were significant in univariate analysis, with a marked increase in precision in comparison to PCA based dimensionality reducing methods. Results were similar to previously published spectroscopic precisions, and further improvements in classification accuracy could be found through the combination of functional and spectroscopic data.Future work will also focus on the addition and discrimination between tumour genetic sub groups, to further expand the clinical utility of this study.
Acknowledgements
We would like to acknowledge funding from the Cancer Research UK and EPSRC Cancer Imaging Programme at the Children’s Cancer and Leukaemia Group (CCLG) in association with the MRC and Department of Health (England) (C7809/A10342), the Cancer Research UK and NIHR Experimental Cancer Medicine Centre Paediatric Network (C8232/A25261), the Medical Research Council – Health Data Research UK Substantive Site and Help Harry Help Others charity. Professor Peet is funded through an NIHR Research Professorship, NIHR-RP-R2-12-019. Stephen Powell gratefully acknowledges financial support from EPSRC through a studentship from the Physical Sciences for Health Centre for Doctoral Training (EP/L016346/1). Professor Theodoros N Arvanitis is partially supported by Health Data Research UK, which is funded by the UK Medical Research Council, Engineering and Physical Sciences Research Council, Economic and Social Research Council, Department of Health and Social Care (England), Chief Scientist Office of the Scottish Government Health and Social Care Directorates, Health and Social Care Research and Development Division (Welsh Government), Public Health Agency (Northern Ireland), British Heart Foundation and Wellcome Trust. We would also like to acknowledge the MR radiographers at Birmingham Children’s Hospital, Alder Hey Children’s Hospital, the Royal Victoria Infirmary in Newcastle and Nottingham Children’s Hospital for scanning the patients in this study. We would also like to thank Selene Rowe at Nottingham University Hospitals NHS Trust for help with gaining MRI protocol information. Dr Grist is funded by the Little Princess Trust (CCLGA 2017 15).References
[1] Koob, M., Girard, N., 2014. Cerebral tumors: Specific features in children. Diagn. Interv. Imaging 95, 965–983.
[2] Faghihi, R., Zeinali-Rafsanjani, B., Mosleh-Shirazi, M.A., Saeedi-Moghadam, M., Lotfi, M., Jalli, R., Iravani, V., 2017. Magnetic Resonance Spectroscopy and its Clinical Applications: A Review. J. Med. Imaging Radiat. Sci. 48, 233–253.
[3] Lin, G., Chung, Y., 2014. Current Opportunities and Challenges of Magnetic Resonance Spectroscopy, Positron Emission Tomography, and Mass Spectrometry Imaging for Mapping Cancer Metabolism In Vivo. Biomed Res. Int. 2014, 1–13.
[4] Zarinabad, N., Abernethy, L.J., Avula, S., Davies, N.P., Rodriguez Gutierrez, D., Jaspan, T., MacPherson, L., Mitra, D., Rose, H.E.L., Wilson, M., Morgan, P.S., Bailey, S., Pizer, B., Arvanitis, T.N., Grundy, R.G., Auer, D.P., Peet, A., 2017. Application of pattern recognition techniques for classification of pediatric brain tumors by in vivo 3T 1 H-MR spectroscopy-A multi-center study. Magn. Reson. Med. 2366, 2359–2366.
Figures