4684
Advanced permutation test of children’s thalami reveals correlation between age and iron accumulation in aspartylglucosaminuria (AGU) disease1HUS Medical Imaging Center, University of Helsinki and Helsinki University Hospital, Helsinki, Finland, 2Institute of Biochemistry, University of Giessen, Giessen, Germany, 3Department of Child Neurology, University of Helsinki and Helsinki University Hospital, Helsinki, Finland
Synopsis
We report an original finding of a strong linear correlation (F=26, p=1.5e-4, R2=0.65) between iron accumulation within specific thalamic structures and the age of children with aspartylglucosaminuria (AGU). AGU is a rare lysosomal storage disorder which has no cure, causes a negative effect on the development of a child, and leads to a premature death. We used affine image registration and implemented a voxel-wise permutation test to locate where AGU patients have higher filtered phase SWI intensities (i.e. more iron) than controls. Furthermore, we demonstrated that permutation test was crucial for discovering the linear correlation between iron accumulation and age.
Introduction
Our aim in this work is i) to localize and ii) to quantify iron accumulation in children’s thalamus throughout adolescence in a rare lysosomal storage disorder known as aspartylglucosaminuria (AGU). This study is motivated by a new visual finding of distinct hypointensity of susceptibility-weighted images (SWI) in the thalamic regions which was connected to iron accumulation.1 Fig. 1 demonstrates the hypointensity in SWI of patient's thalamus compared with a healthy one with much more uniform signal distribution. Considering that iron accumulation is typically associated and studied with neurological conditions that occur in a much older age such as Alzhaimer’s disease and multiple sclerosis2-4, this study is likely the first to quantify iron accumulation in a young brain due to AGU.AGU is a generalized disease affecting the whole-body causing infections and delayed cognitive and motor development during childhood and rapid intellectual decline after 28 years leading to likely death before 50 years of age5. While the source of AGU has been identified as a mutation in the aspartylglucosaminidase-gene6 and many lysosomal storage disorder therapies have been improved lately, no working treatment is found to cure or slow down the disease7-10. Our intention is to develop a MRI method for tracking the disease progression and detect changes in the iron accumulation rate to find early on if some experimental medical treatment stops or slows down the iron accumulation.
Methods
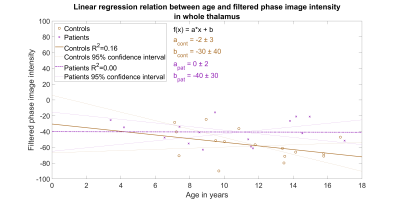
SWIs were acquired successfully from 16 patients (8 female) and 16 healthy controls (6 female) with a Siemens 3T Skyra MRI scanner which uses a so-called ‘left-handed’ reference scheme for the filtered phase SWIs3,11. Acquisition parameters for SWI used, TR = 27 ms, TE = 20 ms, flip angle = 15°, in-plane resolution 0.86 mm x 0.86 mm, slice-thickness 2 mm, and matrix 256 mm x 232 mm. Thalamic regions were segmented using Advanced Normalization Tools version 2.1.012 by registering all SWIs to MNI152 structural atlas. The success of affine transformation was visually confirmed for each subject and the obtained transformations were applied to the filtered phase SWIs.Filtered phase SWIs were used to differentiate paramagnetic substances (e.g. iron) from diamagnetic substances as only the former results in a hyperintensity in the image13. An average signal intensity of the whole thalamus was calculated for each subject in both groups to allow group-wise distribution comparison with a box plot (Fig. 1) and linear regression with age within groups (Fig. 2).
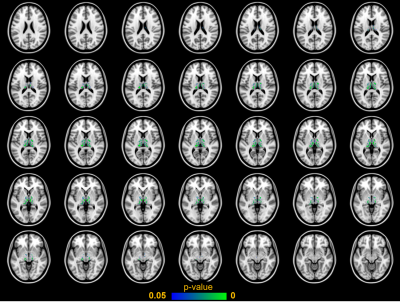
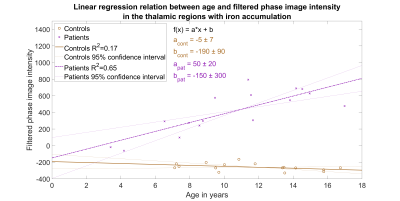
Voxel-wise permutation test was performed to locate where patients had significantly higher signal intensity than controls in the phase filtered SWIs (Fig. 3). Age and sex were used as covariates and the number of permutations was 10000. Threshold-free cluster enhancement14 was used on the resulting statistical images and correction for family-wise error was applied. Thalami were further segmented into iron accumulation regions i.e. areas in which patients had statistically significantly (p-value < 0.05) higher signal intensity than controls based on the permutation test. Linear regression analysis with age was repeated using average intensities form these iron accumulation regions (Fig. 4).
Results
The average phase filtered SWI intensities in the whole thalamus between controls and patients indicated large and statistically significant difference with an effect size of 0.98 and p-value of 0.01. The average intensity values were examined using two-sample t-test and Cohen’s d assuming unequal variances as indicated by the unequal length of the box plot whiskers in Fig 1. However, the linear regression test (Fig. 2) between intensities and age indicated no correlation (F=1.1e-3, p=0.98, R2=8.2e-5) for patient group when averaging over the whole thalamic region. Interestingly, a slightly negative yet not significant correlation (F=2.7, p=0.13, R2=0.16) was found for the healthy controls.The permutation test revealed specific regions where iron accumulates in AGU (Fig. 3). The average phase filtered SWI intensities within these regions indicated extensive differences between patient and subject groups with an effect size of 4.32 - over four times larger effect size than comparing average intensities in the whole thalamus. Linear regression analysis (Fig. 4) of the regions with iron accumulation demonstrates strong and statistically significant correlation between SWI intensity and patient age (F=26, p=1.5e-4, R2=0.65). Such correlation was not observed for the control group (F=2.9, p=0.11, R2=0.17) which results remained similar to the whole thalamus regression analysis.
Discussion & Conclusion
Our first aim to localize the thalamic structures where iron accumulates in AGU disease was successful as Fig. 3 clearly depicts different sections of thalamus. Our second aim to study the iron accumulation as function of children’s age was also accomplished as we found a strong and significant linear correlation (F=26, p=1.5e-4, R2=0.65) between patient’s age and phase filtered SWI intensity within the iron accumulation regions of thalamus (Fig 4).A further study is needed to disentangle the functional tasks of the newly found iron accumulation regions as they could likely correlate well with the previous thalamus segmentations with diffusion weighted MRI15,16. We also aim to improve our permutation test to account for mixed-effects with multi-level block permutations17 and image registration pipeline by substituting a study specific population average template instead of the MNI152 atlas as the latter might not translate well to the brain images of very young children18.
Acknowledgements
No acknowledgement found.References
1. Tokola, A., et al. "Susceptibility-Weighted Imaging Findings in Aspartylglucosaminuria." American Journal of Neuroradiology. 2019
2. Sehgal V, Delproposto Z, Haacke EM, et al. Clinical applications of neuroimaging with susceptibility-weighted imaging. J Magn Reason Imaging. 2005
3. Haacke EM, Mittal S, Wu Z, et al. Susceptibility-weighted imaging: technical aspects and clinical applications, Part 1. AJNR Am J Neuroradiol. 2009
4. Ropele S, Enzinger C, Fazekas F. Iron mapping in multiple sclerosis. Neuroimaging Clin N Am 2017
5. Arvio M, Mononen I. Aspartylglycosaminuria: a review. Orphanet J Rare Dis. 2016
6. Saarela J, Laine M, Oinonen C, et al. Molecular pathogenesis of a disease: structural consequences of aspartylglucosaminuria mutations. Hum Mol Genet. 2001
7. Arvio M, Sauna-Aho O, Peippo M. Bone marrow transplantation for aspartylglucosaminuria: follow-up study of transplanted and non-transplanted patients. J Pediatr. 2001
8. Virta S, Rapola J, Jalanko A, et al. Use of nonviral promoters in adenovirus-mediated gene therapy: reduction of lysosomal storage in the aspartylglucosaminuria mouse. J Gene Med. 2006
9. Dunder U, Valtonen P, Kelo E, et al. Early initiation of enzyme replacement therapy improves metabolic correction in the brain tissue of aspartylglycosaminuria mice. J InheritMetab Dis. 2010
10. Banning A, Gülec C, Rouvinen J, et al. Identification of small molecule compounds for pharmacological chaperone therapy of aspartylglucosaminuria. Sci Rep. 2016
11. Haacke EM, Xu Y, Cheng Y-C, et al. Susceptibility weighted imaging (SWI). Magn Reson Med 2004
12. Avants, Brian B., Nick Tustison, and Gang Song. "Advanced normalization tools (ANTS)." Insight j 2. 2009
13. Schweser F, Deistung A, Lehr BW, et al. Differentiation between diamagnetic and paramagnetic cerebral lesions based on magnetic susceptibility mapping. Med Phys. 2010
14. Smith, Stephen M., and Thomas E. Nichols. "Threshold-free cluster enhancement: addressing problems of smoothing, threshold dependence and localisation in cluster inference." Neuroimage. 2009
15. Battistella, G., Najdenovska, E., Maeder, P., Ghazaleh, N., Daducci, A., Thiran, J. P., ... & Fornari, E. Robust thalamic nuclei segmentation method based on local diffusion magnetic resonance properties. Brain Structure and Function. 2017
16. Najdenovska, E., Alemán-Gómez, Y., Battistella, G., Descoteaux, M., Hagmann, P., Jacquemont, S., ... & Cuadra, M. B. In-vivo probabilistic atlas of human thalamic nuclei based on diffusion-weighted magnetic resonance imaging. Scientific data. 2017
17. Winkler, Anderson M., et al. "Multi-level block permutation." Neuroimage. 2015
18. Avants, Brian B., et al. "The Insight ToolKit image registration framework." Frontiers in neuroinformatics. 2014
Figures


