4683
Differentiation of Low- and High-Grade Pediatric Brain Tumors with Amide Proton Transfer Imaging1Key Laboratory for Biomedical Engineering of Ministry of Education, Department of Biomedical Engineering, College of Biomedical Engineering & Instrument Science, Zhejiang University, Hangzhou, Zhejiang, China, 2Department of Radiology, Children’s Hospital, Zhejiang University School of Medicine, Hangzhou, Zhejiang, China, 3Department of Neurosurgery, Children’s Hospital, Zhejiang University School of Medicine, Hangzhou, Zhejiang, China, 4Philips Healthcare, Shanghai, China
Synopsis
Amide proton transfer (APT) imaging was applied to the grading of pediatric brain tumors for the first time with its performance evaluated by the Receiver Operating Characteristic (ROC) curve. Ninety-two patients were enrolled in this study, of whom 48 cases were high-grade tumors and 44 cases were low-grade tumors. An experienced radiologist delineated the initial ROIs, which were then automatically masked and shrunk to avoid artifacts and subjective bias. APT MRI was able to differentiate low-grade pediatric brain tumors from high-grade ones, with a maximum area under the ROC curve of 0.95 in conjunction with quantitative T1 and T2.
INTRODUCTION
Amide Proton Transfer (APT) MRI is a variant of Chemical Exchange Saturation Transfer (CEST) imaging, which can generate contrast arising from endogenous proteins and peptides, and has been applied to adult gliomas in multiple prior studies(1-3). However, to the best of our knowledge, APT MRI has not been applied to pediatric brain tumors yet. The brain tumor is one of the most commonly seen neoplasms among children, with an incidence only inferior to lymphoproliferative disorders(4). Previous studies have used arterial spin labeling(5), magnetic resonance spectroscopy(6), diffusion(7) and perfusion(8) MRI for grading pediatric brain tumors. Here, we proposed a semi-automatic method based on APT MRI for grading pediatric brain tumors and evaluated its performance in a relatively large population of patients.METHODS
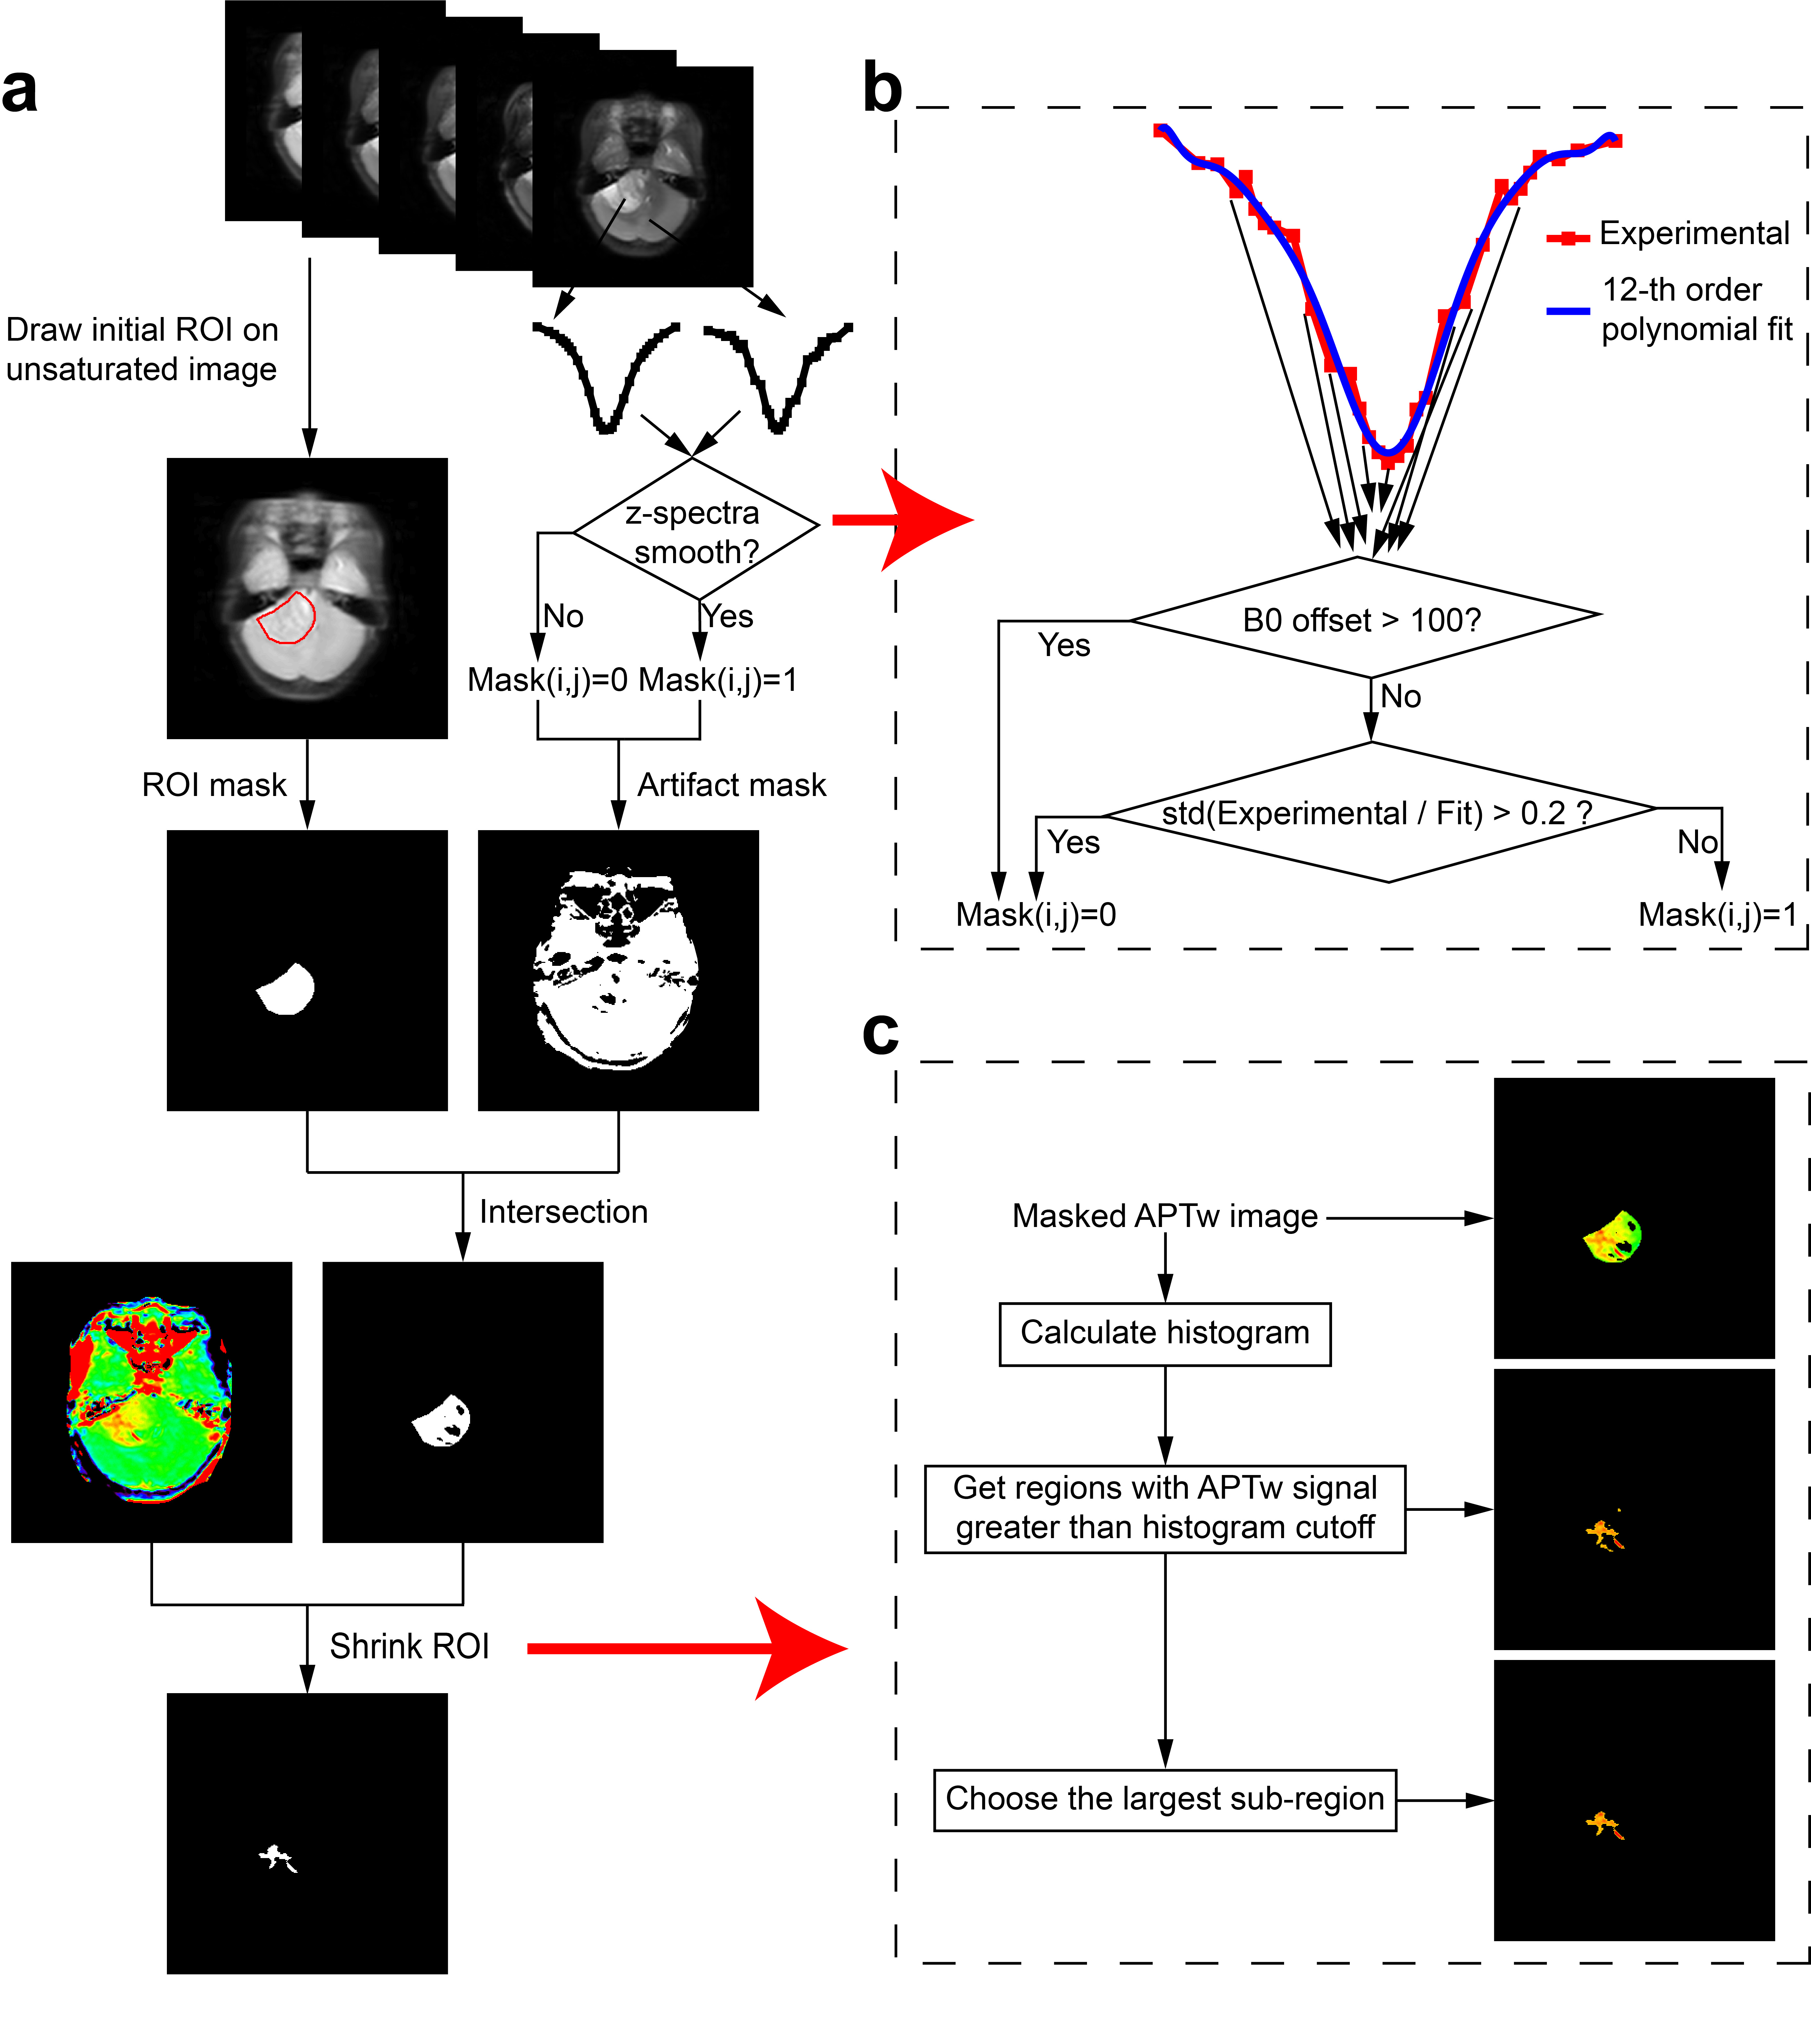
The local Institutional Review Board approved this study. All experiments were performed on a 3T Philips Achieva scanner, with guardian consent forms obtained from all participants. CEST z-spectra were obtained with 63 frequency offsets from -6 to 80ppm(9), RF saturation power=2uT and duration=0.8sec, TR/TE=3000/6.7ms, FOV=230X230mm2, slice thickness=6mm, and acquisition duraiton=3.1min. Quantitative T1 and T2 values were acquired with the “MIX” sequence(10).For every patient, an initial region of interest (ROI) enclosing the whole tumor was first delineated by an experienced radiologist on the unsaturated APT image with reference to T1-weighted (T1w) and T2-weighted (T2w) images. Second, this initial ROI was used to create an ROI mask (Fig. 1a). At the same time, an artifact mask was created based on an artifact-detection algorithm (Fig. 1b) to remove voxels severely affected by artifacts. Third, the intersection of the ROI mask and the artifact mask was applied to the original APT-weighted (APTw) map. Fourth, an ROI-shrinking algorithm using histogram analysis (Fig. 1c) was performed on the masked APTw image, with the final ROI generated.
Specifically, the artifact-detection algorithm (Fig. 1b) worked as follows. First, for each voxel, the signal from 6ppm to -6ppm was extracted, producing an experimental z-spectrum. Second, the experimental z-spectrum was fitted using a 12th-order polynomial(11). Third, the corresponding mask value was set to 0, if the B0 offset exceeded 100Hz, or if the standard deviation of the ratio between the experimental z-spectrum and the fitted z-spectrum was greater than 0.2. In addition, The ROI-shrinking algorithm (Fig. 1c) worked as follows. First, the histogram of APTw values within the masked ROI was calculated. Second, all regions where the APTw intensities were greater than a given histogram cutoff value (e.g. 80th percentile) were extracted. Third, the sub-region with the largest area was selected and taken as the final ROI.
Within the final ROI selected, the mean CEST signal was computed using several different metrics, including CESTR = (Sref-Slabel)/ S0 (12), CESTRnr = (Sref-Slabel)/ Sref (13), and MTRRex = (Sref-Slabel)S0/Slabel/Sref (14), where Sref was the reference z-spectrum signal at, e.g., -3.5ppm, Slabel was the label signal at, e.g., 3.5ppm, and S0 was the unsaturated signal. Note that the CESTR metric at 3.5ppm was treated as the APTw signal here. The Receiver Operating Characteristic (ROC) curve was used to evaluate the Area Under the Curve (AUC) performance of each single CEST metric, T1, and T2. And the support vector machine (SVM) was used when multiple metrics were combined.
RESULTS
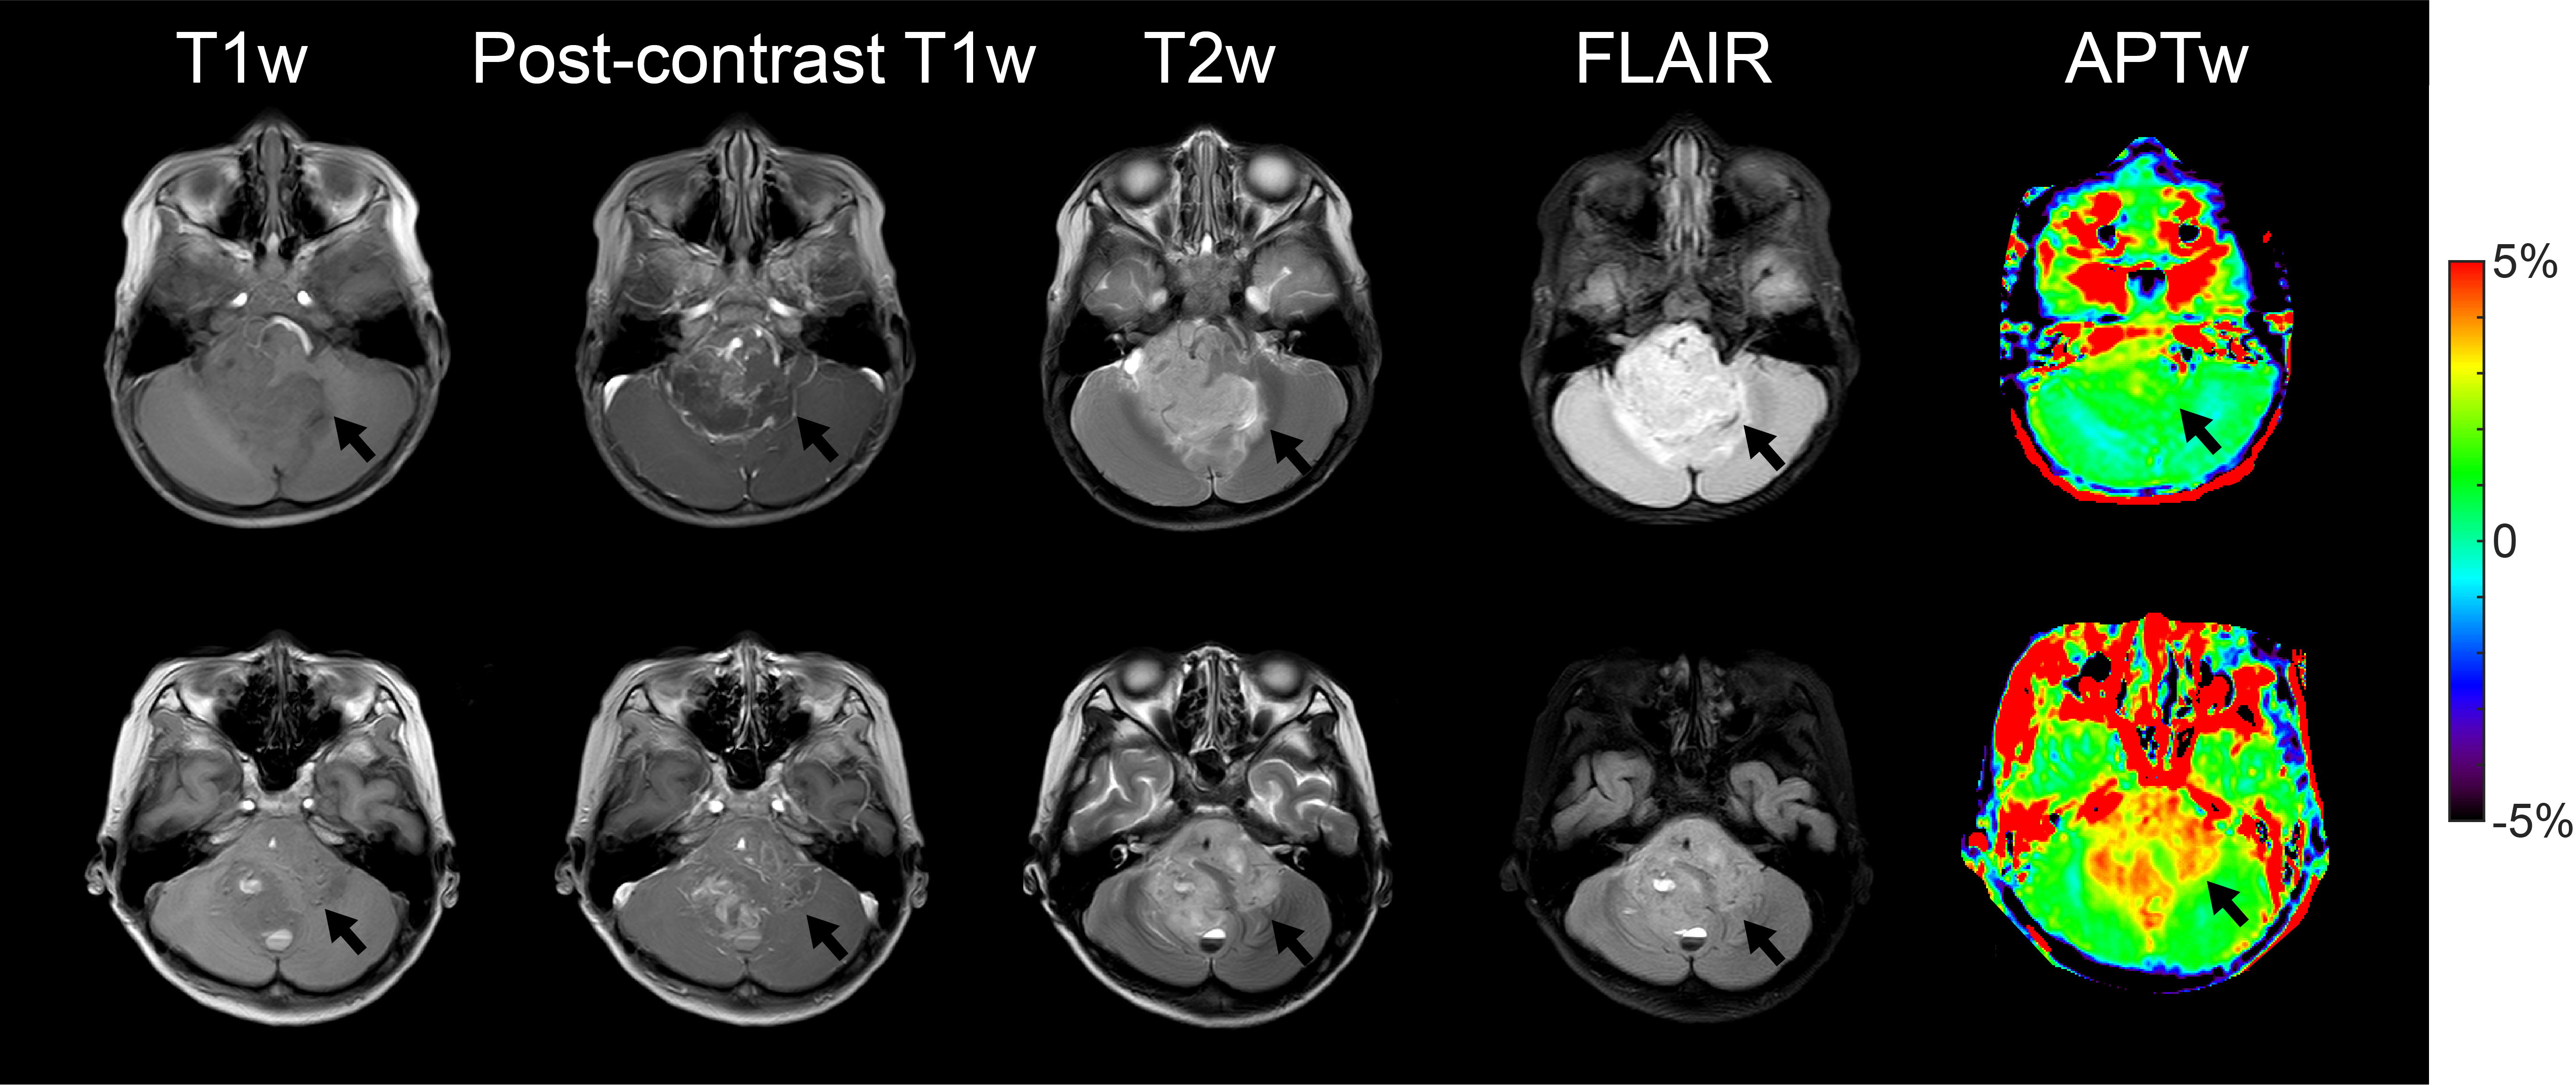
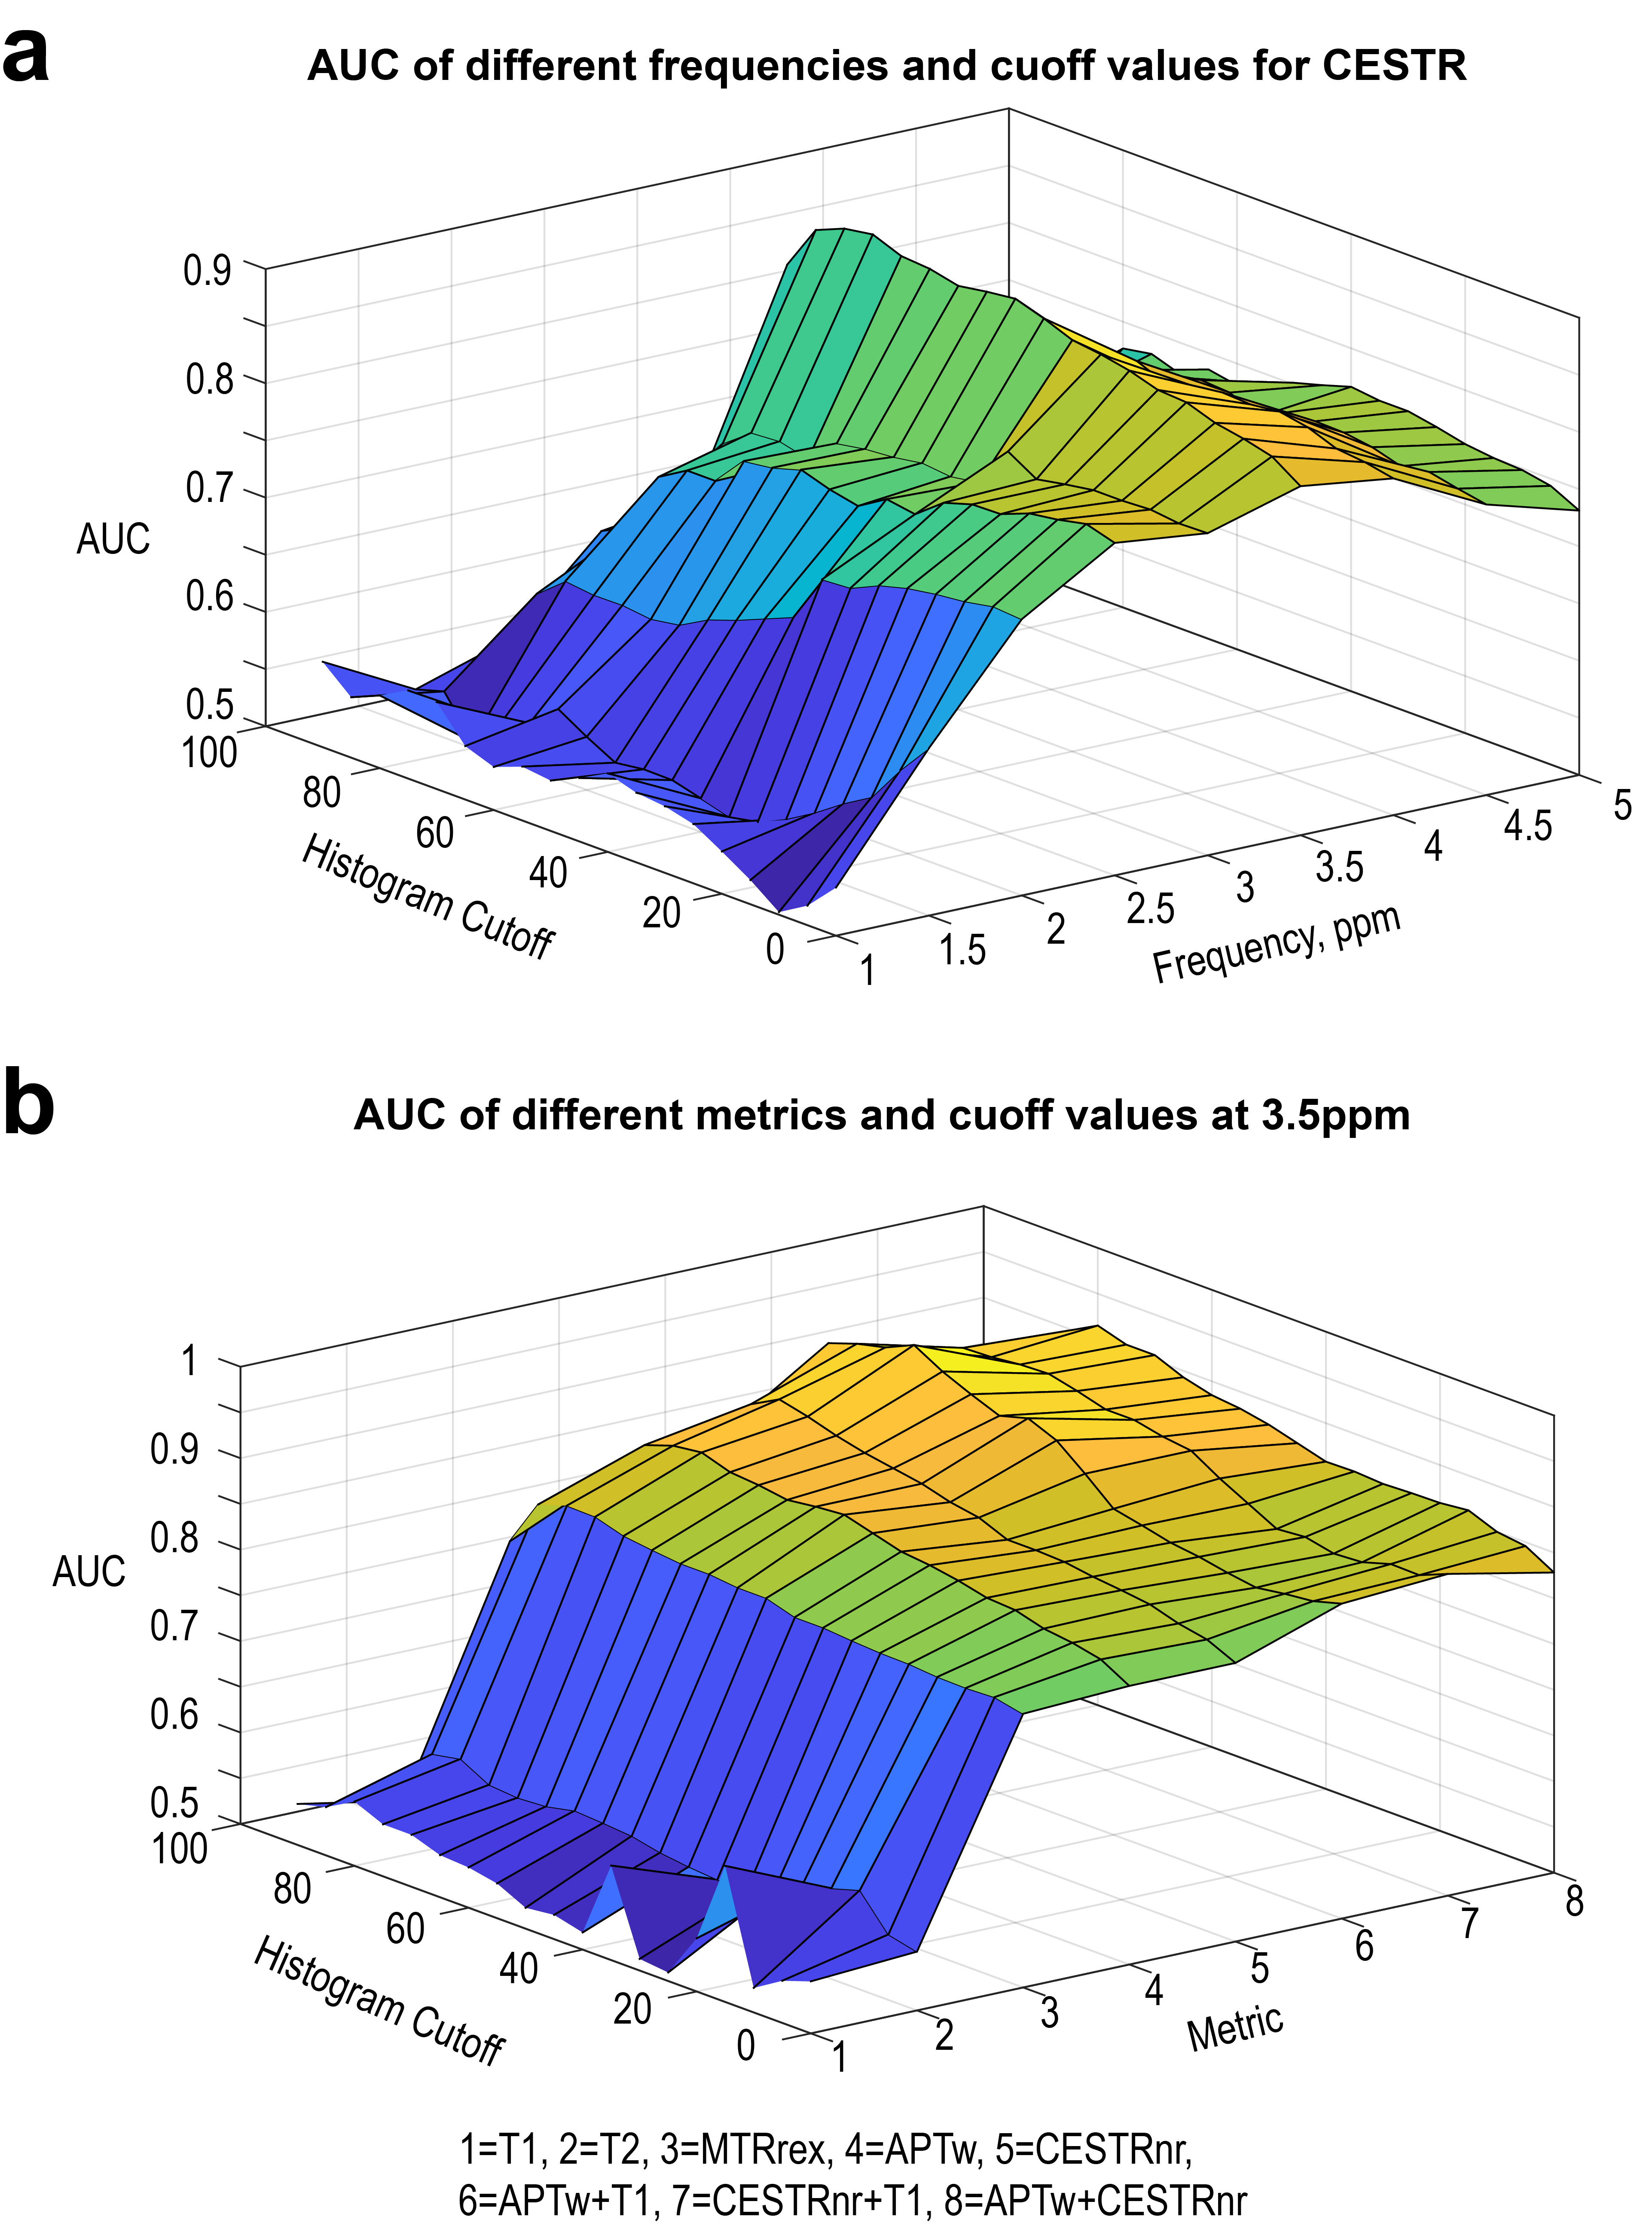
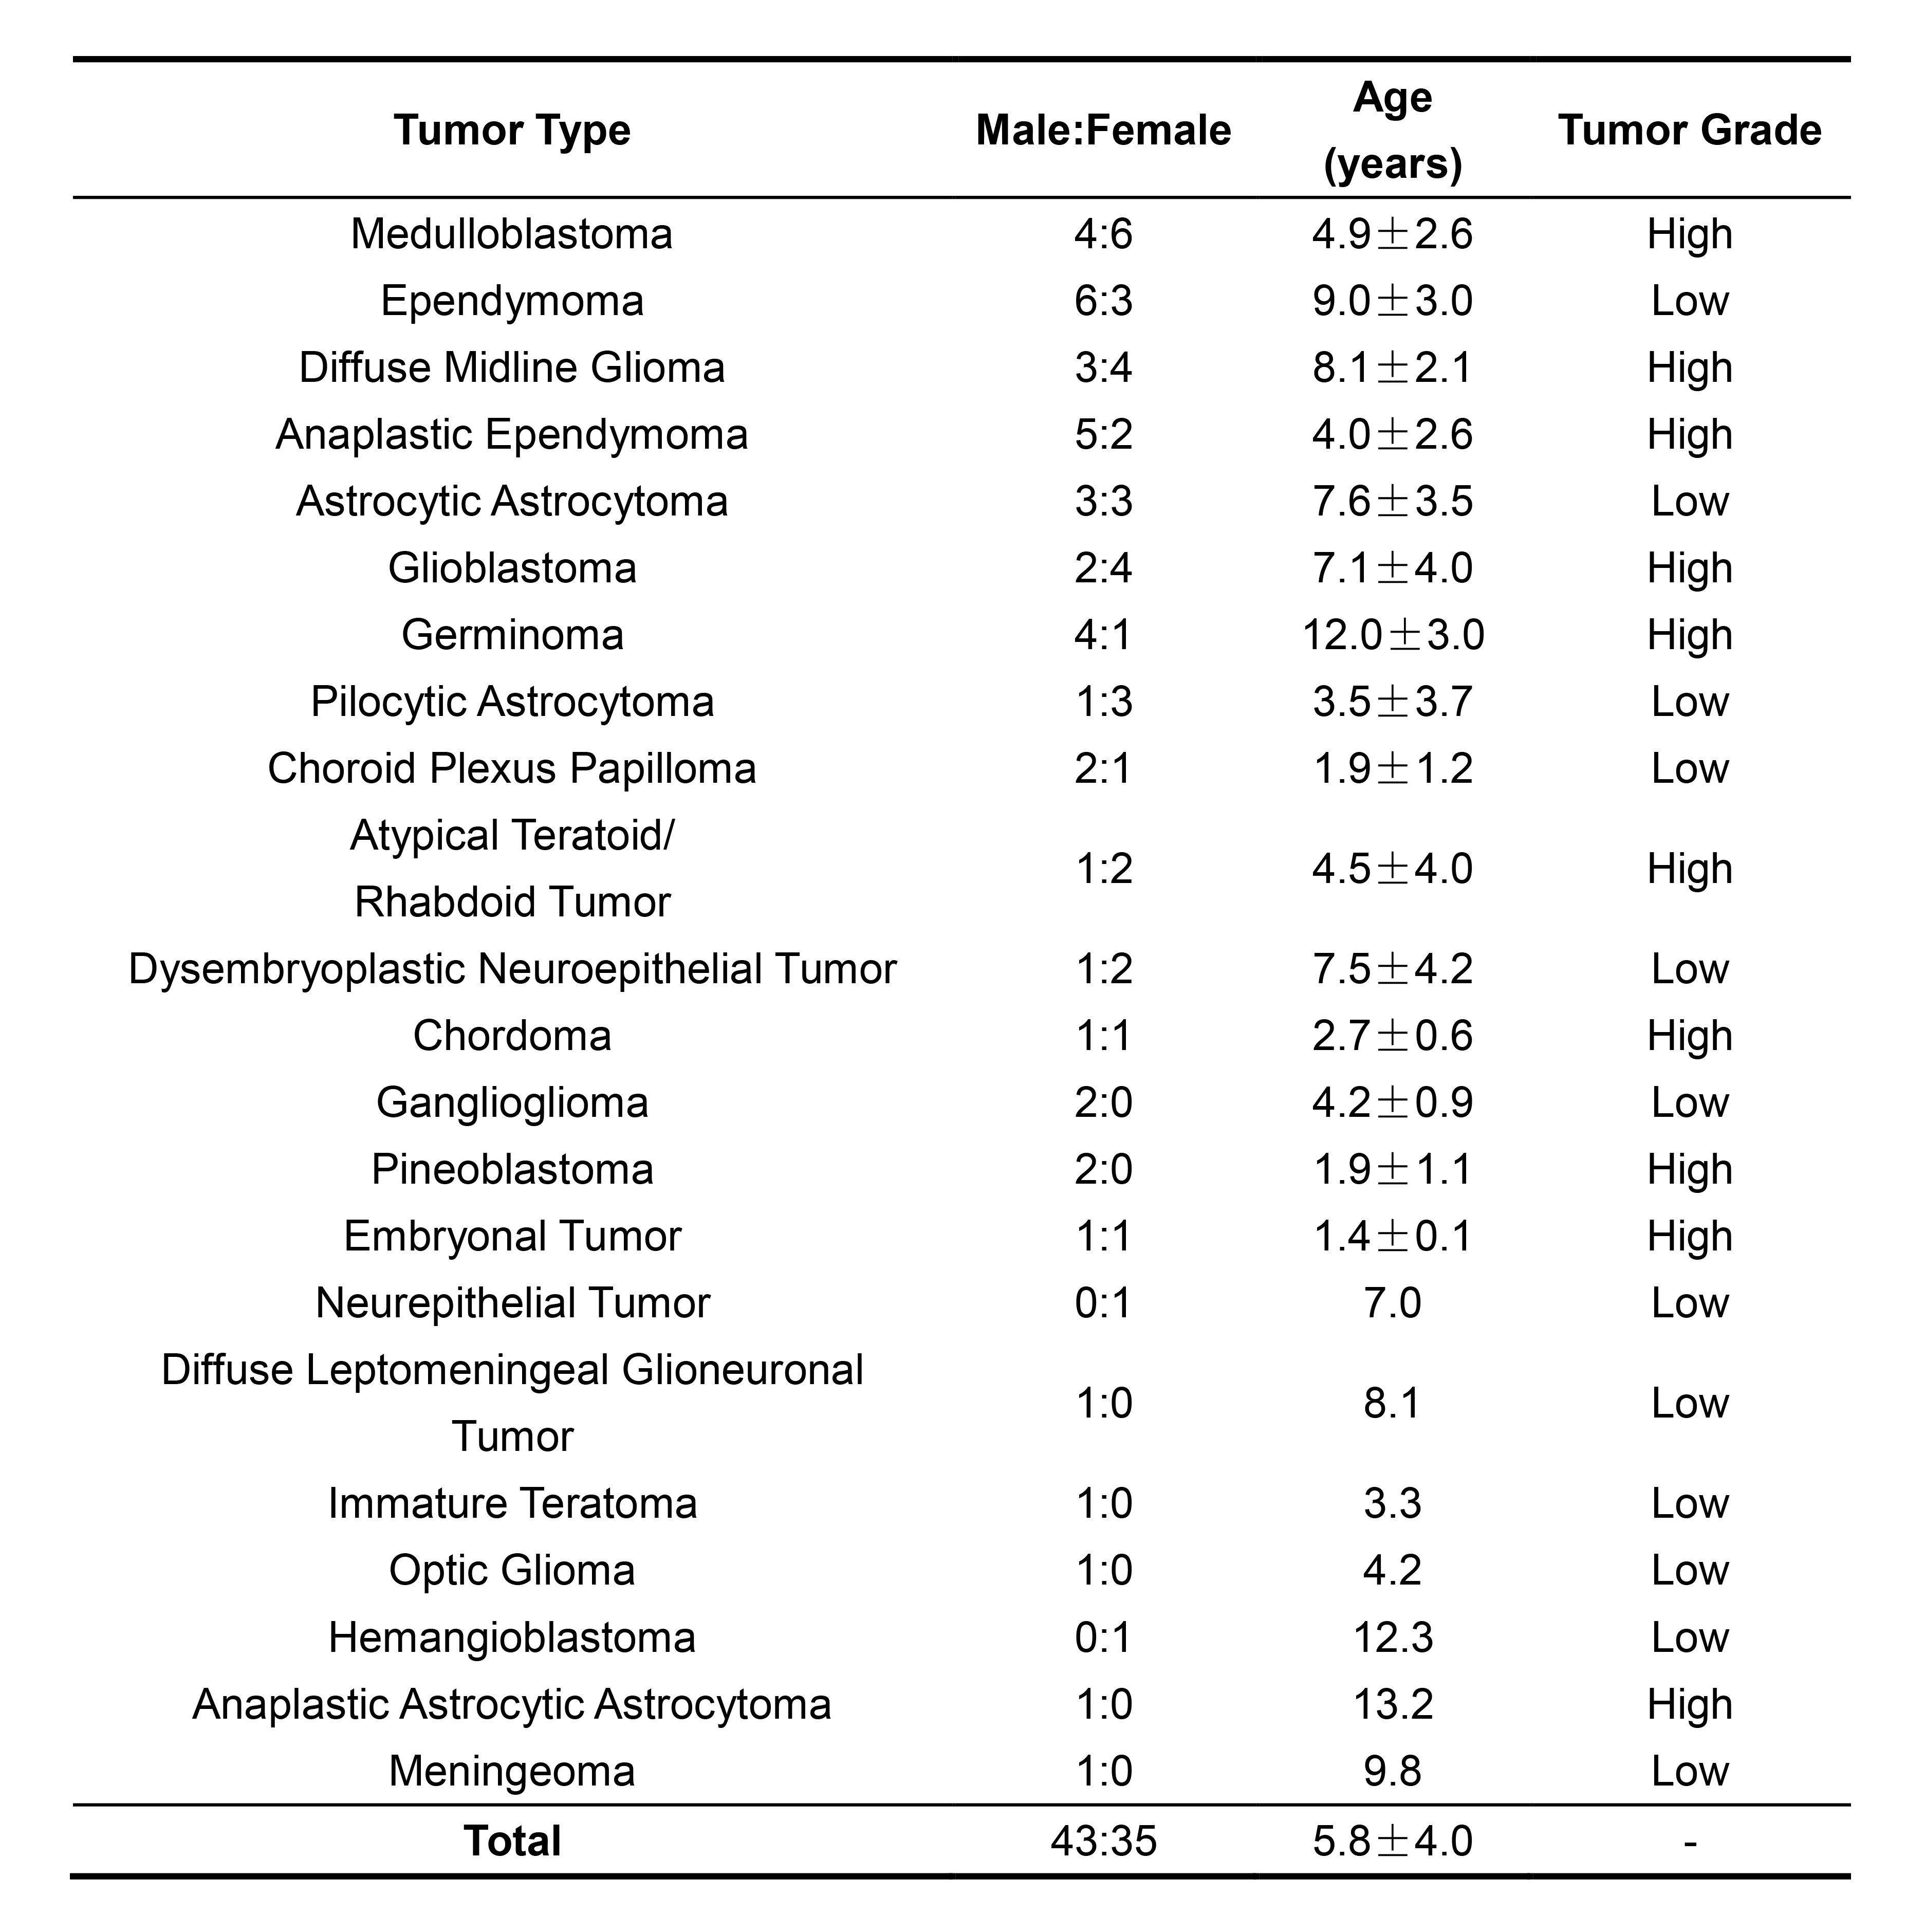
APT imaging was performed in 92 patients, of which 14 cases were excluded because the area of the artifact regions generated by the artifact-detection algorithm was greater than 1/3 of that of the initial ROI. The demographics of the seventy-eight patients analyzed are shown in Table 1. Representative anatomical images and APTw maps from a low-grade ependymoma patient and a high-grade glioblastoma patient are shown in Fig. 2. The conventional anatomical images did not show obvious difference between low-grade and high-grade patients, while the APTw maps demonstrated substantially higher values in the high-grade patient than those in the low-grade patient. As shown in Fig. 3a, for the CESTR metric, the best ROC performance was achieved at 3.5ppm, i.e. the APTw metric, yielding a maximum AUC of 0.89 at the histogram cutoff value of 75%. For the CESTRnr and MTRRex metrics, the best results were also obtained at 3.5ppm (data not shown) while at different histogram cutoff values. When focusing on CEST results at 3.5ppm, the CESTRnr metric outperformed the others, achieving a maximum AUC of 0.91 (Fig. 3b). Besides using a single CEST metric, the addition of quantitative T1 and T2 values further improved the AUC from 0.89 for APTw to 0.95 for the combination of T1 and APTw (Fig. 3b).DISCUSSION and CONCLUSION
Noninvasive assessment of tumor grades in pediatric patients is highly useful in diagnosis and treatment planning, which however could not be accomplished by conventional anatomical MRI. As shown in Fig. 3, the AUC of quantitative T1 and T2 values for tumor grading was slightly over 0.5, which was significantly lower than that of APT MRI. This difference implies that APT MRI can provide extra value for the diagnosis of pediatric brain tumors beyond that by anatomical MRI. In conclusion, APT MRI is a valuable biomarker for differentiating low- and high-grade brain tumors in pediatric patients.Acknowledgements
NSFC grant number: 61801421, 81971605. Zhejiang Lab grant number: 2018EB0ZX01. This work is also supported by “the Fundamental Research Funds for the Central Universities (2019FZJD005)”.References
1. Zhou J, Zhu H, Lim M, Blair L, Quinones-Hinojosa A, Messina SA, Eberhart CG, Pomper MG, Laterra J, Barker PB, van Zijl PC, Blakeley JO. Three-dimensional amide proton transfer MR imaging of gliomas: Initial experience and comparison with gadolinium enhancement. J Magn Reson Imaging 2013;38(5):1119-1128.
2. Togao O, Yoshiura T, Keupp J, Hiwatashi A, Yamashita K, Kikuchi K, Suzuki Y, Suzuki SO, Iwaki T, Hata N, Mizoguchi M, Yoshimoto K, Sagiyama K, Takahashi M, Honda H. Amide proton transfer imaging of adult diffuse gliomas: correlation with histopathological grades. Neuro Oncol 2014;16(3):441-448. 3. Park JE, Kim HS, Park KJ, Kim SJ, Kim JH, Smith SA. Pre- and Posttreatment Glioma: Comparison of Amide Proton Transfer Imaging with MR Spectroscopy for Biomarkers of Tumor Proliferation. Radiology 2016;278(2):514-523.
4. Paldino MJ, Faerber EN, Poussaint TY. Imaging tumors of the pediatric central nervous system. Radiol Clin North Am 2011;49(4):589-616, v.
5. Dangouloff-Ros V, Deroulers C, Foissac F, Badoual M, Shotar E, Grevent D, Calmon R, Pages M, Grill J, Dufour C, Blauwblomme T, Puget S, Zerah M, Sainte-Rose C, Brunelle F, Varlet P, Boddaert N. Arterial Spin Labeling to Predict Brain Tumor Grading in Children: Correlations between Histopathologic Vascular Density and Perfusion MR Imaging. Radiology 2016;281(2):553-566.
6. Astrakas LG, Zurakowski D, Tzika AA, Zarifi MK, Anthony DC, De Girolami U, Tarbell NJ, Black PM. Noninvasive magnetic resonance spectroscopic imaging biomarkers to predict the clinical grade of pediatric brain tumors. Clin Cancer Res 2004;10(24):8220-8228.
7. Sui Y, Wang H, Liu G, Damen FW, Wanamaker C, Li Y, Zhou XJ. Differentiation of Low- and High-Grade Pediatric Brain Tumors with High b-Value Diffusion-weighted MR Imaging and a Fractional Order Calculus Model. Radiology 2015;277(2):489-496.
8. Ho CY, Cardinal JS, Kamer AP, Kralik SF. Relative cerebral blood volume from dynamic susceptibility contrast perfusion in the grading of pediatric primary brain tumors. Neuroradiology 2015;57(3):299-306.
9. Heo HY, Zhang Y, Jiang S, Lee DH, Zhou J. Quantitative assessment of amide proton transfer (APT) and nuclear overhauser enhancement (NOE) imaging with extrapolated semisolid magnetization transfer reference (EMR) signals: II. Comparison of three EMR models and application to human brain glioma at 3 Tesla. Magn Reson Med 2016;75(4):1630-1639.
10. In den Kleef JJ, Cuppen JJ. RLSQ: T1, T2, and rho calculations, combining ratios and least squares. Magn Reson Med 1987;5(6):513-524.
11. Zhou J, Blakeley JO, Hua J, Kim M, Laterra J, Pomper MG, van Zijl PC. Practical data acquisition method for human brain tumor amide proton transfer (APT) imaging. Magn Reson Med 2008;60(4):842-849.
12. Zhou J, Payen JF, Wilson DA, Traystman RJ, van Zijl PC. Using the amide proton signals of intracellular proteins and peptides to detect pH effects in MRI. Nat Med 2003;9(8):1085-1090.
13. Heo HY, Lee DH, Zhang Y, Zhao X, Jiang S, Chen M, Zhou J. Insight into the quantitative metrics of chemical exchange saturation transfer (CEST) imaging. Magn Reson Med 2017;77(5):1853-1865.
14. Zaiss M, Xu J, Goerke S, Khan IS, Singer RJ, Gore JC, Gochberg DF, Bachert P. Inverse Z-spectrum analysis for spillover-, MT-, and T1 -corrected steady-state pulsed CEST-MRI--application to pH-weighted MRI of acute stroke. NMR Biomed 2014;27(3):240-252.
Figures