4678
Quantification of brain glycine in an infant with nonketotic hyperglycemia: a serial proton magnetic resonance spectroscopy study1Molecular Imaging and Theranostics, National Institutes for Quantum and Radiological Science and Technology, Chiba, Japan, 2Radiology, Kanagawa Children's Medical Center, Yokohama, Japan, 3Neonatology, Kanagawa Children's Medical Center, Yokohama, Japan, 4Neurology, Kanagawa Children's Medical Center, Yokohama, Japan
Synopsis
We serially examined in vivo brain glycine levels in an infant with nonketotic hyperglycemia (NKH) using single-voxel proton magnetic resonance spectroscopy (MRS) with different point-resolved spectroscopic localization sequence echo times (TEs). The time-course changes of brain glycine obtained with TEs of 60 and 270 ms corresponded with glycine concentrations in cerebrospinal fluid and with the clinical condition of the infant. By appropriately combing a pulse sequence and acquisition parameters, proton MRS can evaluate brain glycine levels to help diagnose NKH.
Introduction
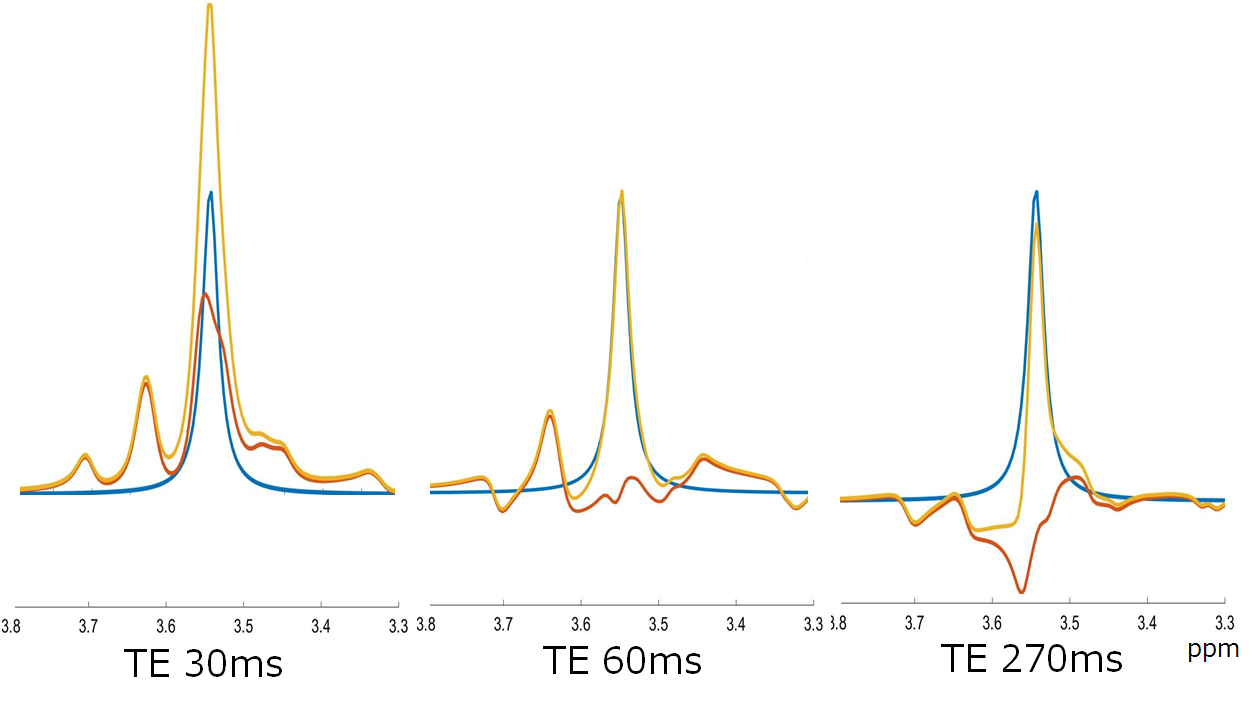
Nonketotic hyperglycemia (NKH) is an inherited metabolic disease that causes high levels of glycine accumulation in the body, including in the brain and spinal cord [1]. Proton magnetic resonance spectroscopy (MRS) can noninvasively detect glycine peaks in the brain; however, signal overlap of glycine and myo-inositol (mIns) often makes it difficult to separately quantify each metabolite. mIns has J-couplings among its own protons; therefore, the mIns and glycine signals should be separable using appropriate echo times (TEs) (Fig. 1). The aim of our study was to investigate time-course changes of brain glycine and mIns peaks using a MRS point-resolved spectroscopic localization sequence (PRESS) [2] with different TEs, and to determine the ability of the technique to quantify brain glycine in a NKH infant.Methods
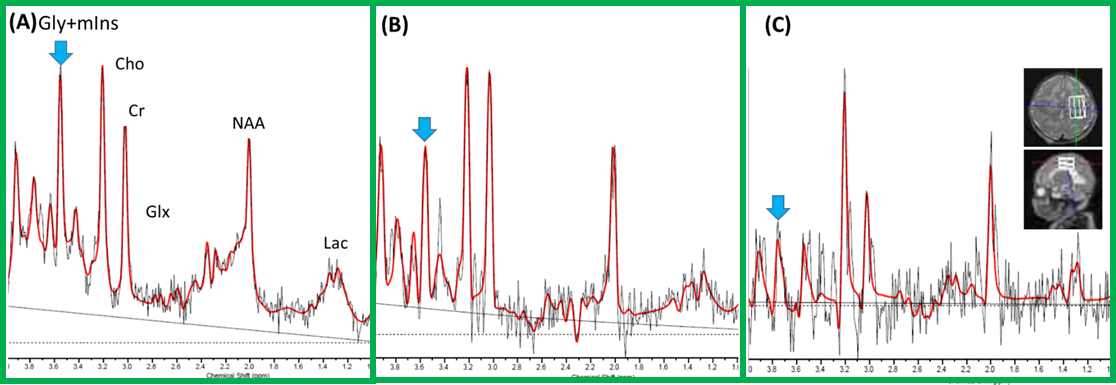
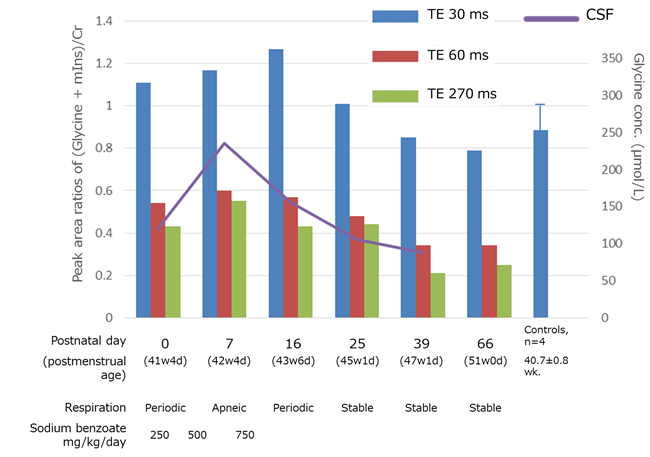
Serial single-voxel proton MRS was performed on an NKH infant at 0, 7, 16, 25, 39, and 66 days of age using a clinical 3 Tesla (T) MR system (Skyra, Siemens, Erlangen, Germany) with a 32-channel head coil (22 cmΦ). For MRS data acquisition, a PRESS sequence with TEs of 30, 60, and 270 ms, and a TR of 5000 ms was used. The volume of interest in the centrum semiovale was 2.3-3.9 mL (Fig. 2). Metabolite peaks were quantified using LCModel [3]. The peak areas between 3.50 - 3.60 ppm and 2.95 - 3.05 ppm were defined as glycine and mIns (Gly+mIns) peaks and creatine (Cr) peaks, respectively. The peak area ratios of (Gly+mIns)/Cr were then evaluated. Glycine concentrations in cerebral spinal fluid (CSF) were also measured. The clinical conditions were monitored over time. As controls, the peak area ratios of (Gly+mIns)/Cr with a TE of 30 ms were investigated in four healthy infants.Results
Eighteen MR spectra (6, TE 30 ms; 6, TE 60 ms; 6, TE 270 ms) of the centrum semiovale region were obtained from the NKH infant (Fig. 2). The signal-to-noise ratios of the spectra were 8 (6-10), 6.5 (6-8), and 4.5 (4-6) (median, range) for TEs 30, 60, and 270 ms, respectively. The time-course changes of the peak area ratios of (Gly+mIns)/Cr with TEs of 60 and 270 ms corresponded with CSF glycine levels and clinical condition at all time points. Higher values were observed on day 7, and values subsequently decreased (Fig. 3). However, the peak area ratio of (Gly+mIns)/Cr with a TE of 30 ms had a higher value on 16 day, despite improvement of the clinical condition and CSF glycine levels (Fig. 3). On 25 day, the clinical condition of the infant was improved with stable breathing, and the peak area ratio of (Gly+mIns)/Cr with a TE of 30 ms decreased to be similar to that of the controls (Fig. 3).Discussion
Our study shows that the time-course changes of the peak area ratios of (Gly+mIns)/Cr with TEs of 60 and 270 ms were relatively consistent with CSF glycine concentrations and the infant’s clinical condition. In simulated spectra with TEs of 60 and 270 ms, the peak range between 3.5 to 3.6 ppm was dominated by the glycine peak, whereas the spectrum with a TE of 30 ms had large signal overlap of the glycine and mIns peaks (Fig. 1). The slight difference in the time-course change of the peak area ratio of (Gly+mIns)/Cr with a TE of 30 ms from the CSF glycine concentrations and clinical condition might result from mIns concentration changes during the MR examination period. Compared with the TE 270 ms spectra, the TE 60 ms spectra had higher signal-to-noise ratio, and more glycine dominated peaks between 3.5 to 3.6 ppm. Therefore, the PRESS sequence TE of 60 ms is more appropriate for brain glycine evaluation.Conclusion
3T proton MRS using a PRESS sequence with TE of 60 ms or 270 ms enabled brain glycine levels to be evaluated over time in an infant with NKH.Acknowledgements
This research is partially supported by Japan Society for the Promotion of Science (JSPS) KAKENHI, Grant/Award Number: 15K09943 and 19K08213.References
1. Perlman, M.P. and J.J. Volpe, Amino Acids, in Volpe's neurology of the newborn, J.J. Volpe, et al., Editors. 2018, Elsevier. p. 763-792.
2. Bottomley, P.A., Spatial Localization in Nmr-Spectroscopy Invivo. Annals of the New York Academy of Sciences, 1987. 508: p. 333-348.
3. Provencher, S.W., Estimation of Metabolite Concentrations from Localized in-Vivo Proton Nmr-Spectra. Magnetic Resonance in Medicine, 1993;30:672-679.
4. Simpson, R., et al., Advanced processing and simulation of MRS data using the FID appliance (FID-A)-An open source, MATLAB-based toolkit. Magn Reson Med, 2017;77:23-33.
Figures