4672
Magnitude and timing of major white matter along-tract maturation with NODDI1Mark and Mary Stevens Neuroimaging and Informatics Institute, University of Southern California, Los Angeles, CA, United States, 2Mark and Mary Stevens Institute for Neuroimaging and Informatics, University of Southern California, Los Angeles, CA, United States
Synopsis
White matter maturation is a heterogeneous phenomenon that can be probed by biophysical models. The purpose of this study was to characterize the development of white matter tracts with NODDI from infancy through adolescence. To probe the regional nature of white matter development, we use an along-tract approach to enable more fine-grained analysis. White matter tracts showed exponential age-related changes in NDI with spatially distinct maturational patterns. Our along-tract analyses elucidate hemispheric asymmetries within tracts which may be reflective of their functional specialization. Together, these results help to disentangle the processes that define the trajectory of white matter maturation.
Introduction
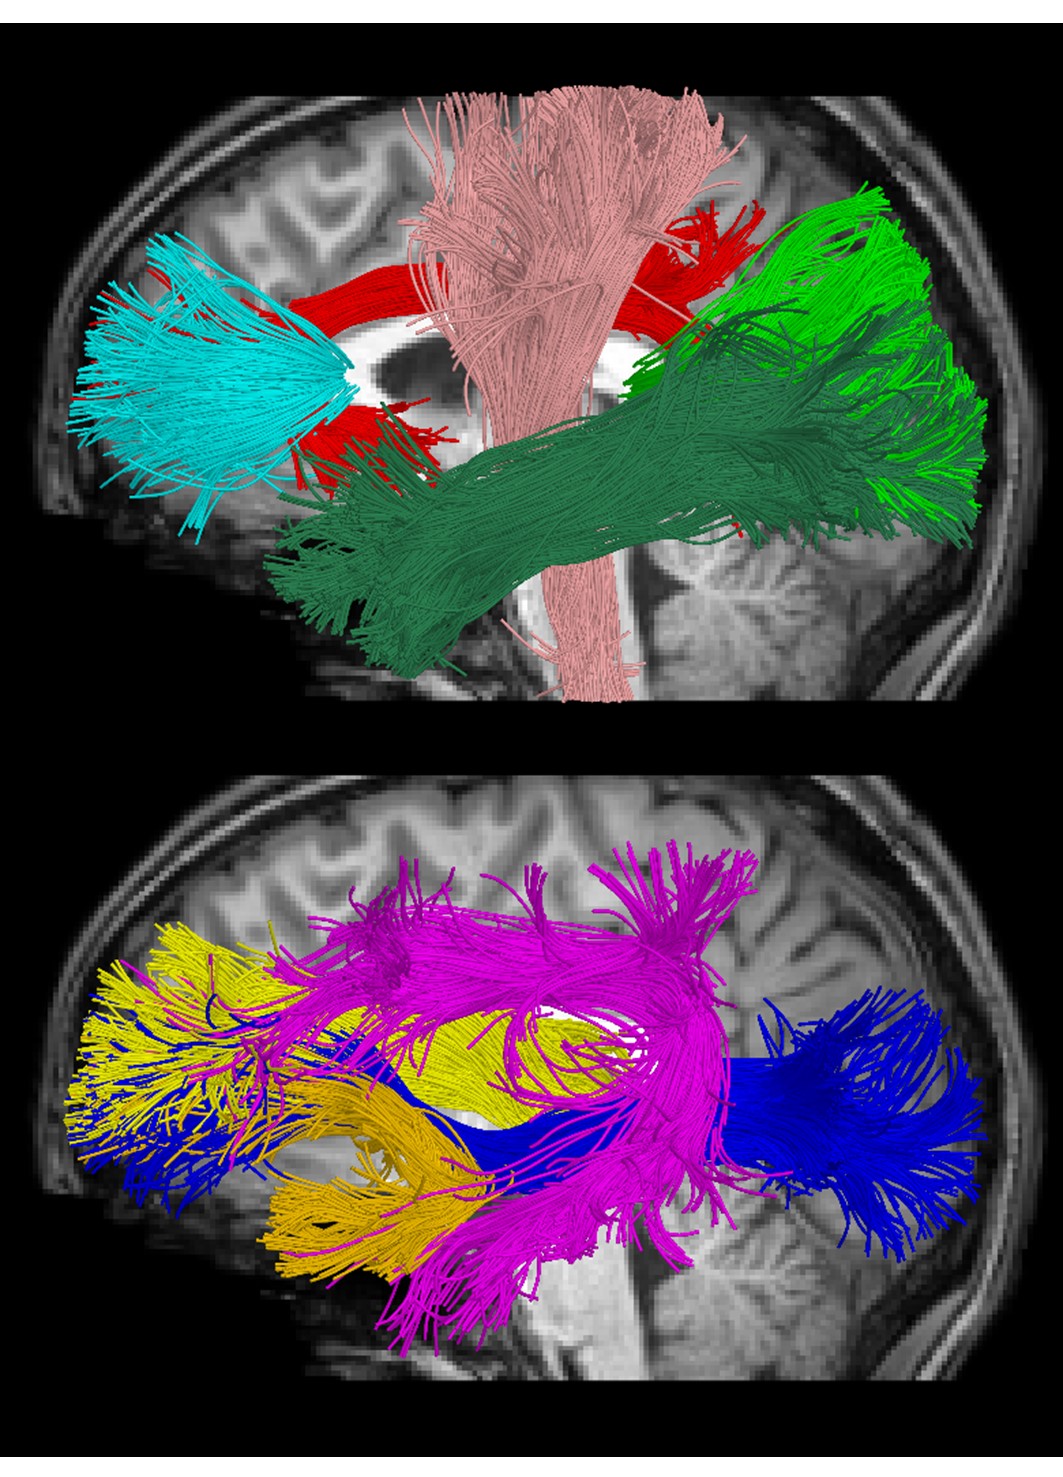
White matter maturation is a nonlinear and heterogeneous phenomenon characterized by axonal packing, increased axon caliber, and a prolonged period of myelination [1]. Neurite orientation dispersion and density imaging (NODDI) is a diffusion MRI approach that probes tissue compartments and provides biologically meaningful measures to quantify neurite density index (NDI) and orientation dispersion index (ODI) [2]. The purpose of this study was to characterize the magnitude and timing of major white matter tract maturation with NODDI from infancy through adolescence in a cross-sectional cohort of 105 subjects (0.1-18.8 years). To probe the regional nature of white matter development, we use an along-tract approach that partitions tracts to enable more fine-grained analysis.Methods
Cross-sectional neuroimaging data for 105 right-handed typically developing children (7.8±4.9 years, 56 female, 0.1-18.8 years) were obtained through the Cincinnati MR Imaging of NeuroDevelopment (C-MIND) data repository (http://research.cchmc.org/c-mind) at Cincinnati Children’s Hospital [3]. 2 dMRI scans (voxel size: 2 mm isotropic; acquisition matrix: 112x109; 61 gradient-encoding directions with 7 B0 images (averaged). Scan 1: b=1000 s/mm2; TR/TE=6614/81 ms. Scan 2: b=3000 s/mm2; TR/TE=8112/104 ms.) were acquired per subject. Due to differences in TR/TE, each scan was normalized by the b=0 volume of the other acquisition. Neurite density index (NDI) and orientation dispersion index (ODI) were calculated using the NODDI Matlab Toolbox [2]. An atlas-based streamline tractography approach was used to obtain fiber bundle models for 9 bilateral major white matter tracts (Figure 1) using the Quantitative Imaging Toolkit (QIT) [4]. To enable more fine-grained analysis of NODDI parameters within white matter tracts, we employed an along-tract technique based on [5]. This approach partitions each tract cross-sectionally into equidistant points by transforming a prototypical centroid curve into subject native space and then streamline vertices were reparameterized to best match the prototype to allow for correspondence across streamlines at various cross-sections. Then, the average scalar parameter was computed for each group of vertices that matched the vertices of the reference, and the resulting along-bundle parameter maps were retained for subsequent statistical analysis. At each point for each tract, a Brody growth curve with the formula:NDI = α - (α - β)e-k*age
was fit to relate tract parameters to age using nonlinear least squares regression where α is the asymptote, β is the y-intercept, and k is the growth rate. At each point, the age at 90% maturation was calculated. Bootstrap resampling was performed along each tract with 5000 iterations to obtain a confidence interval around the regional along-tract age estimates.
Results
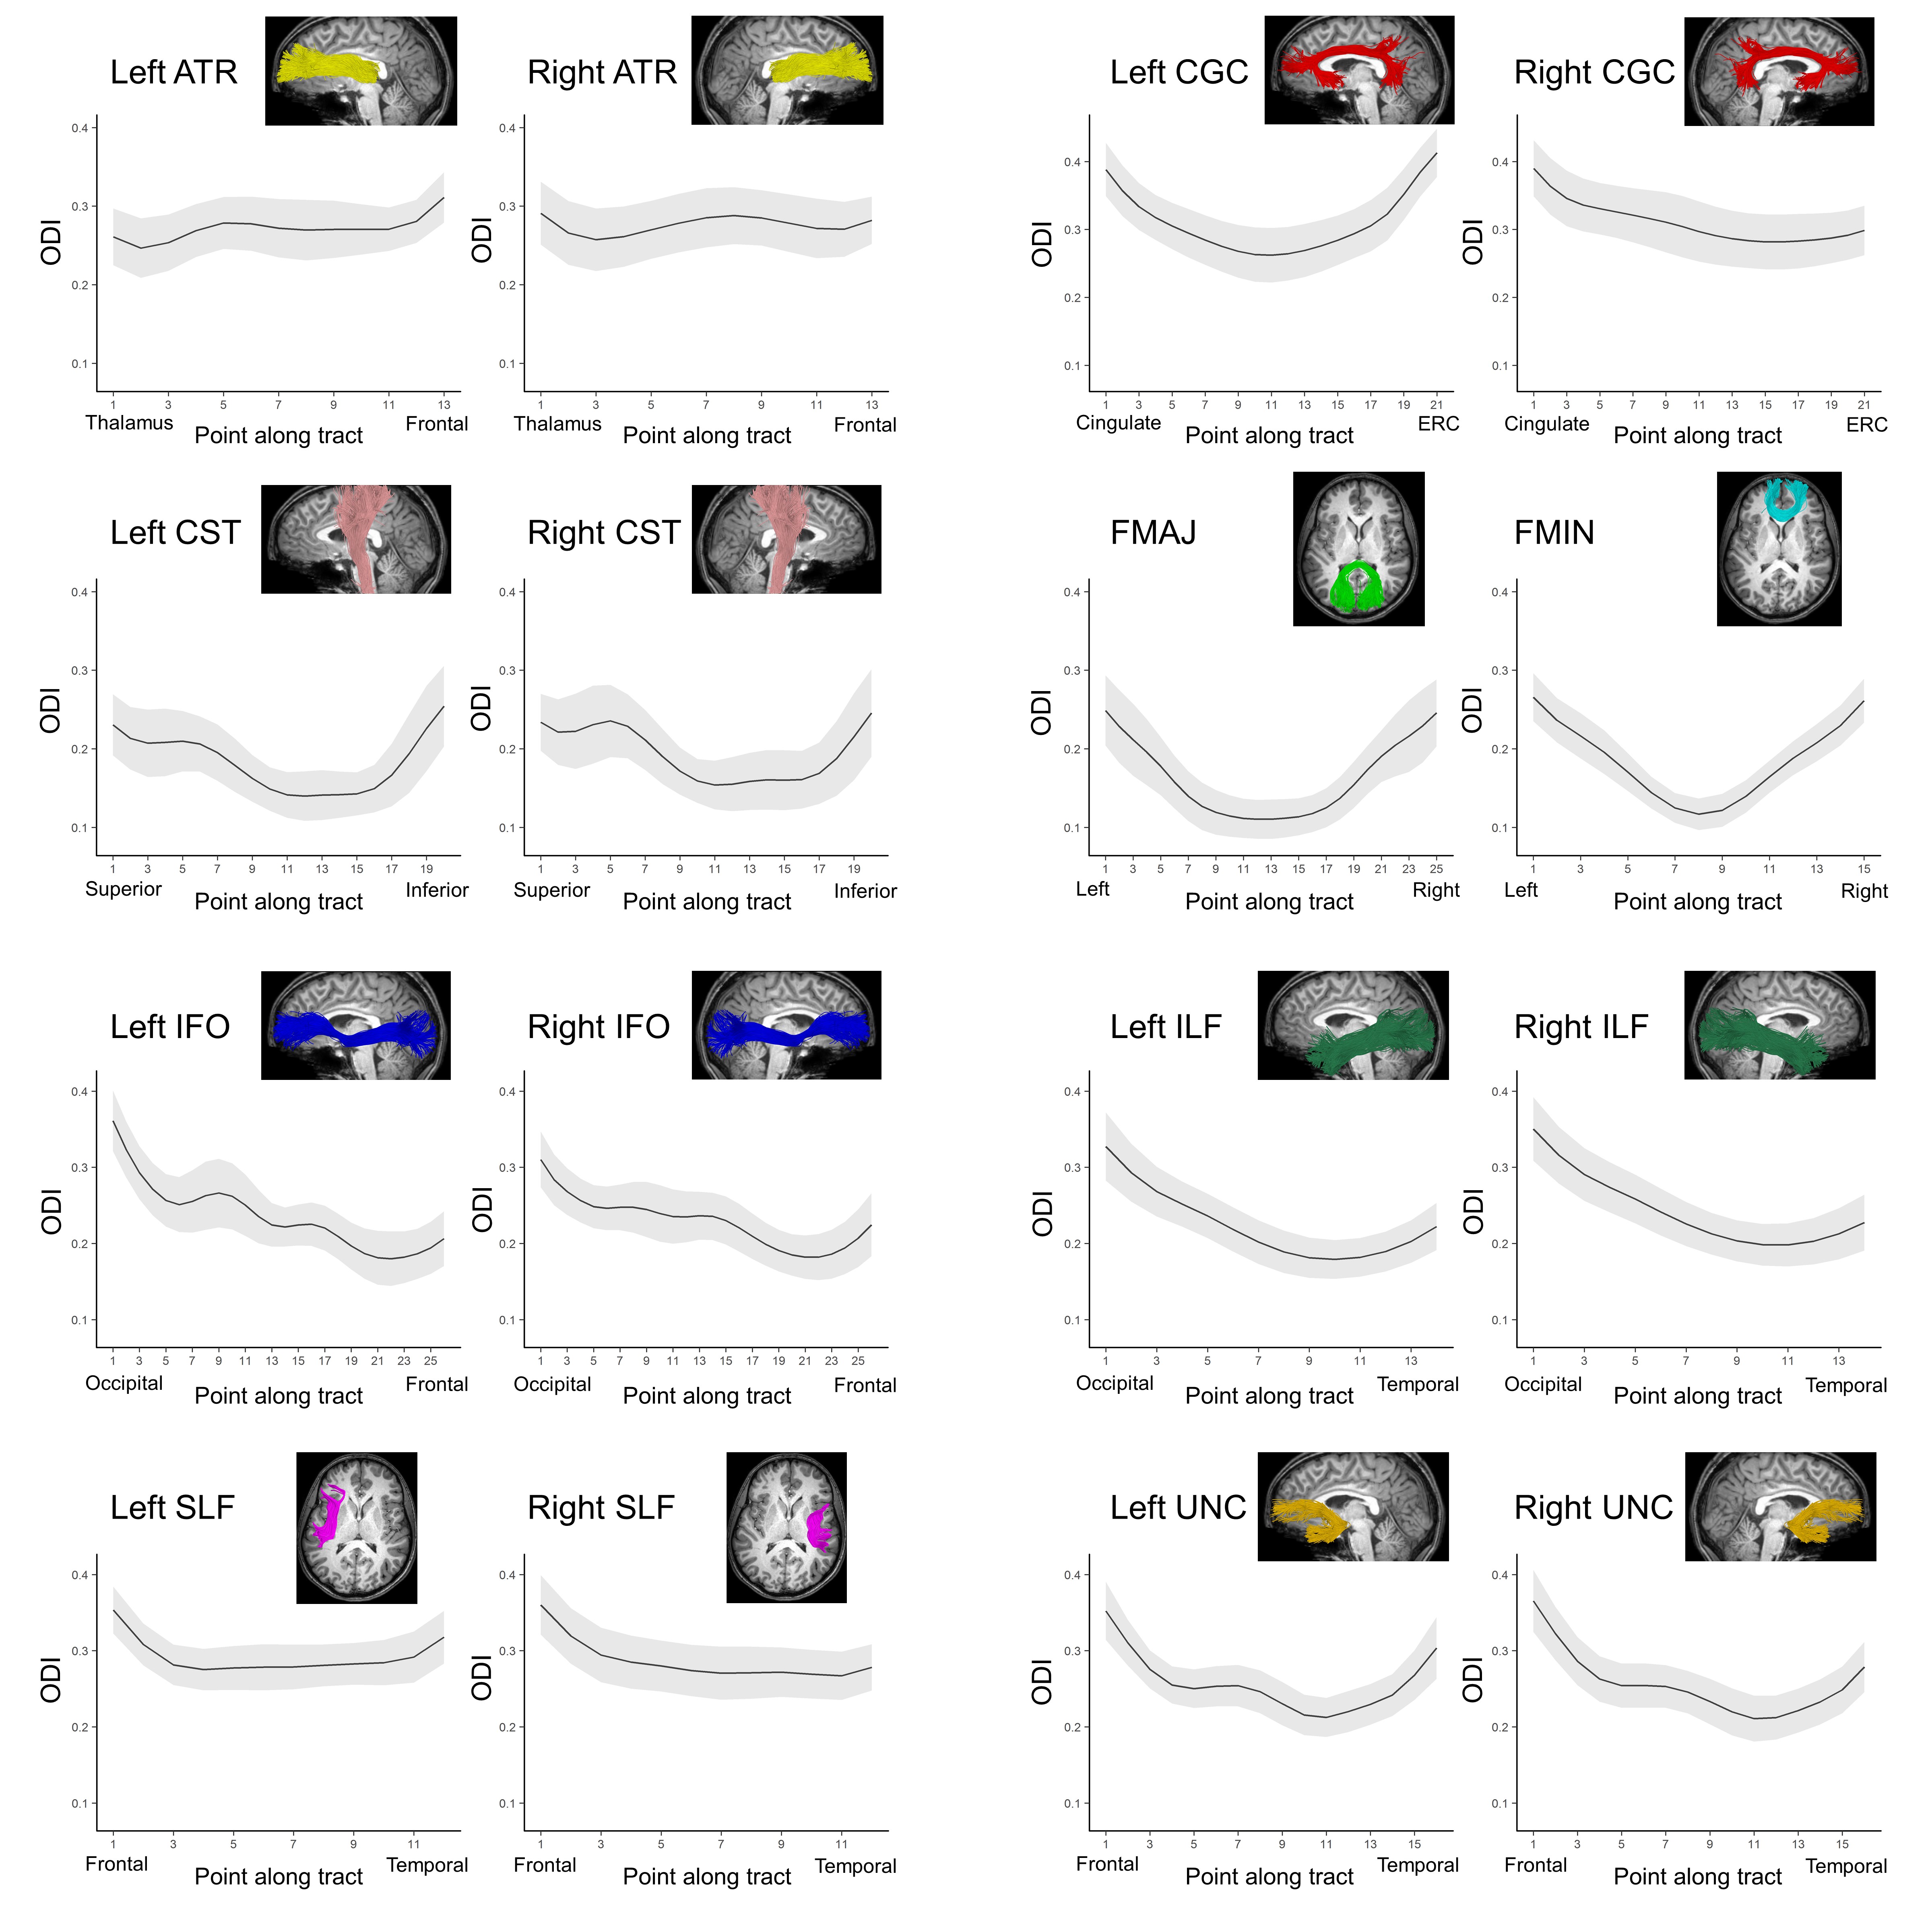
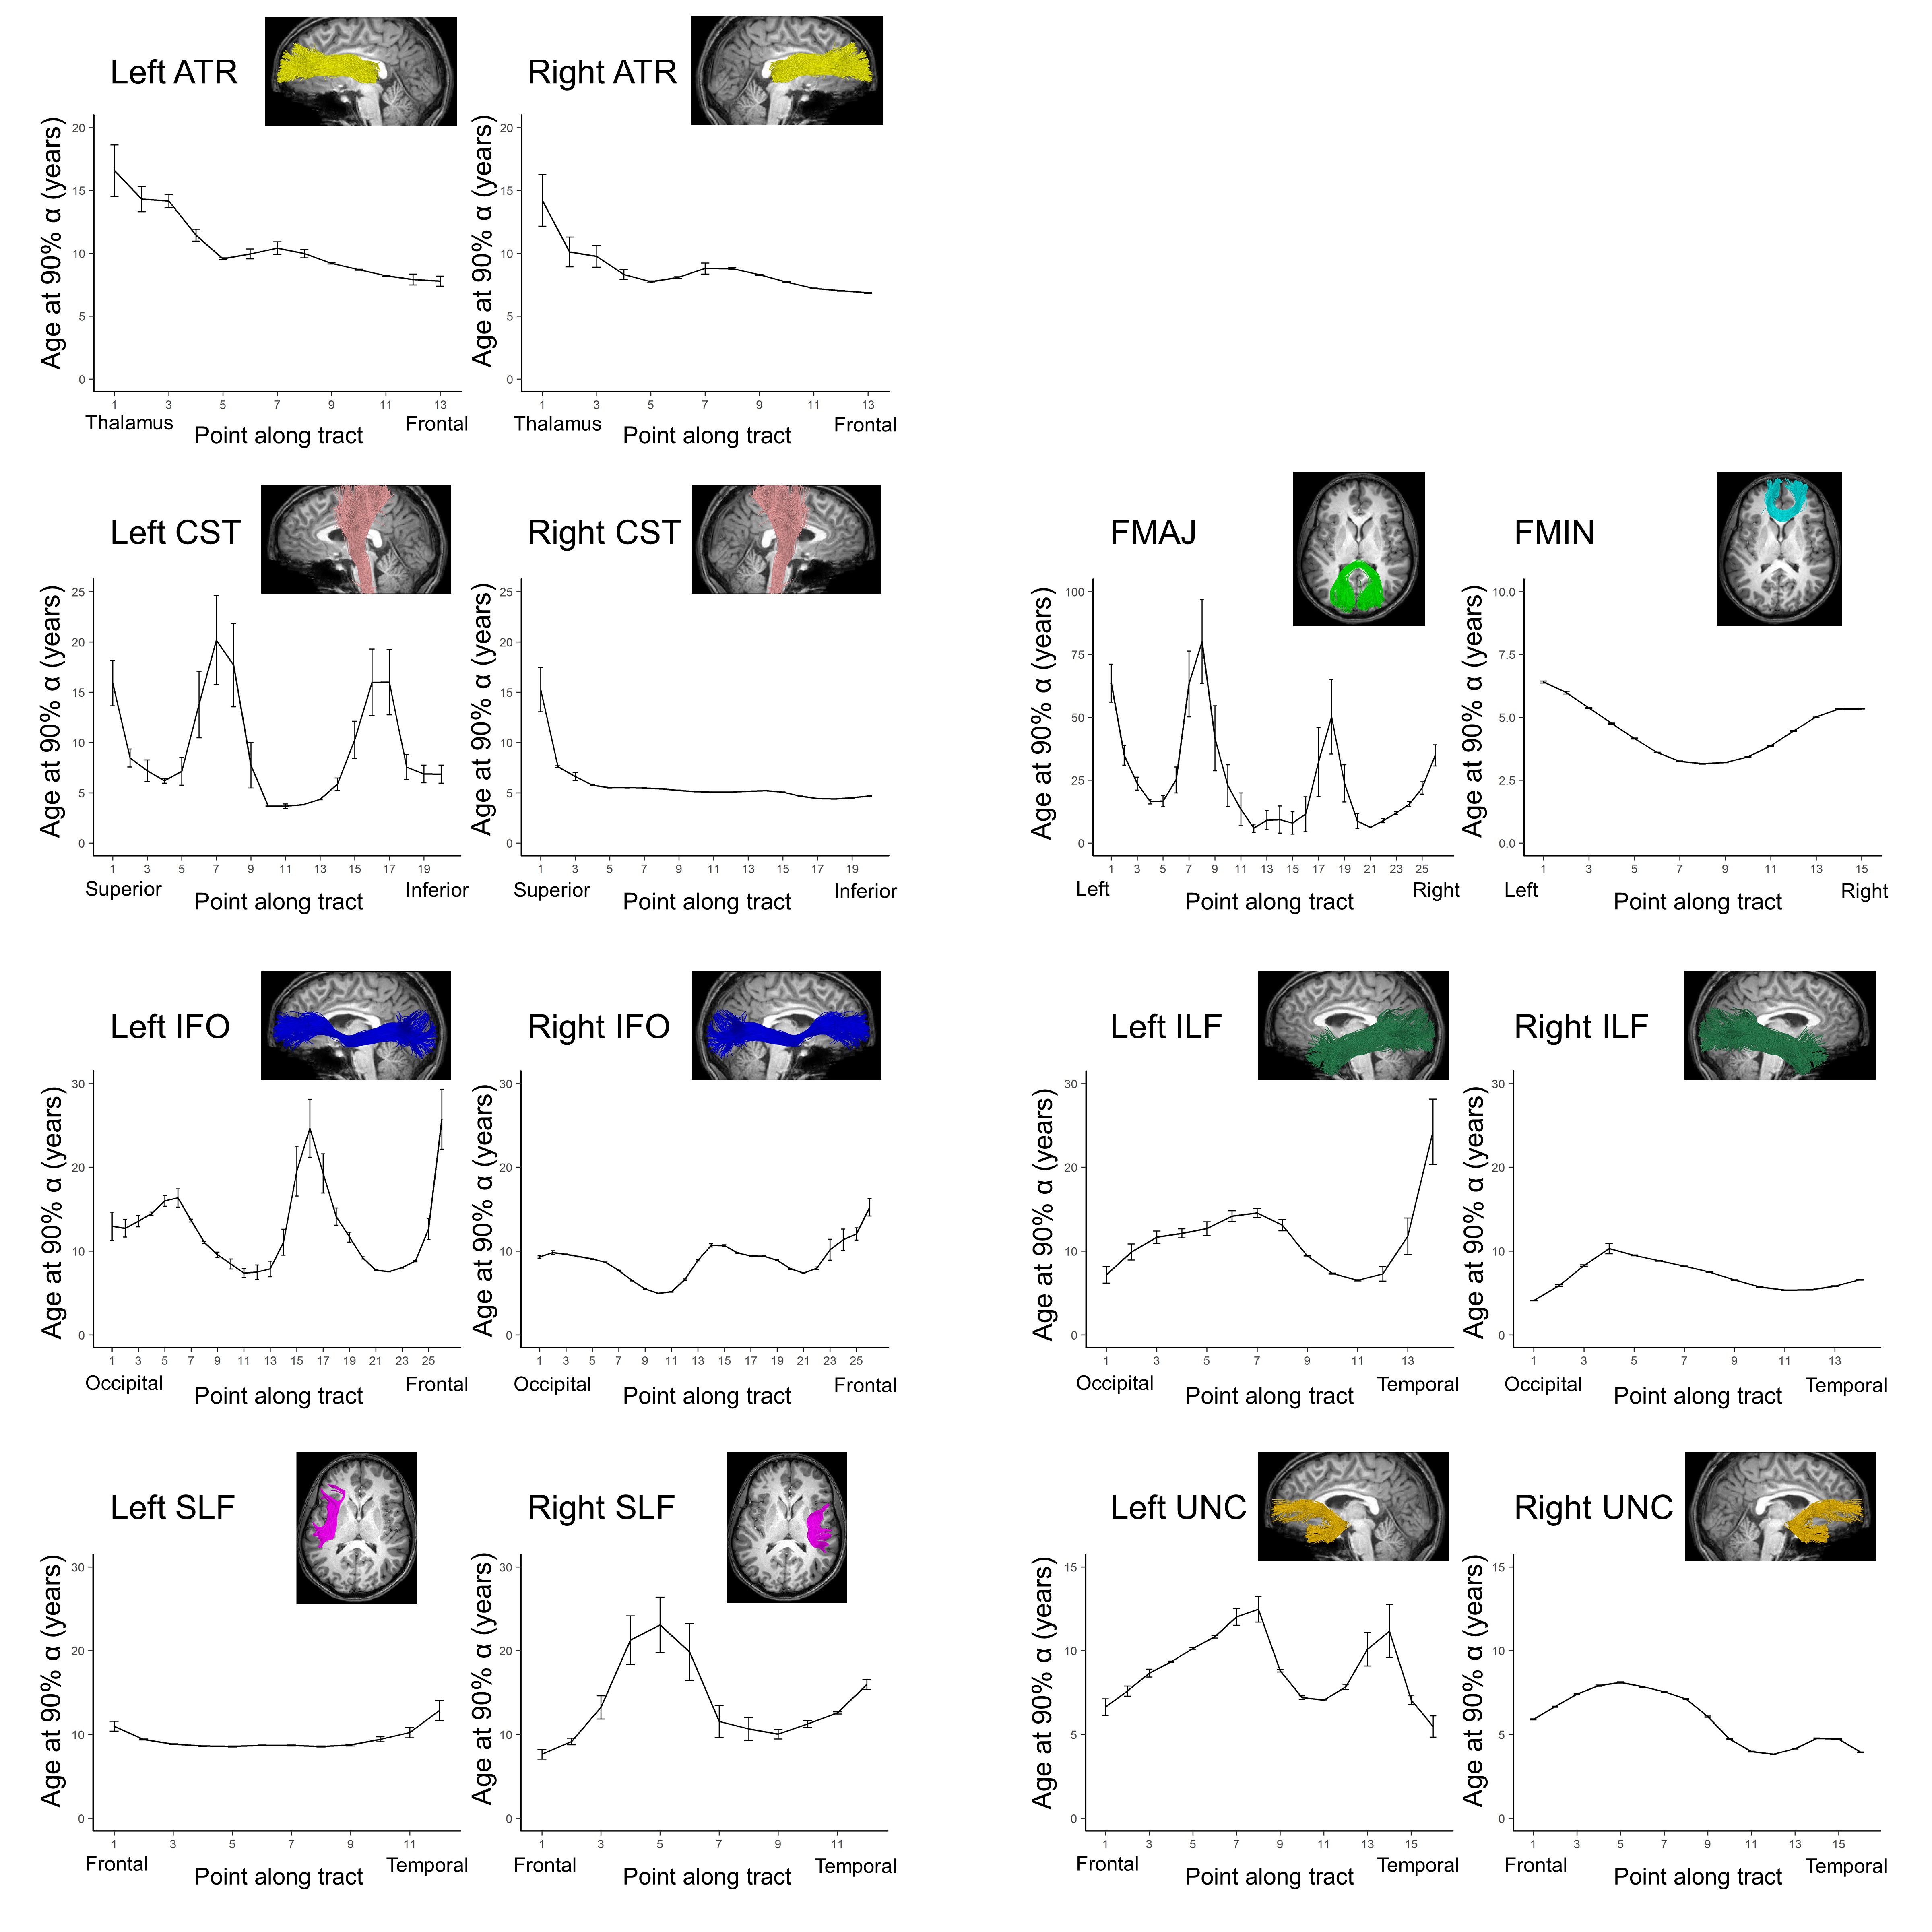
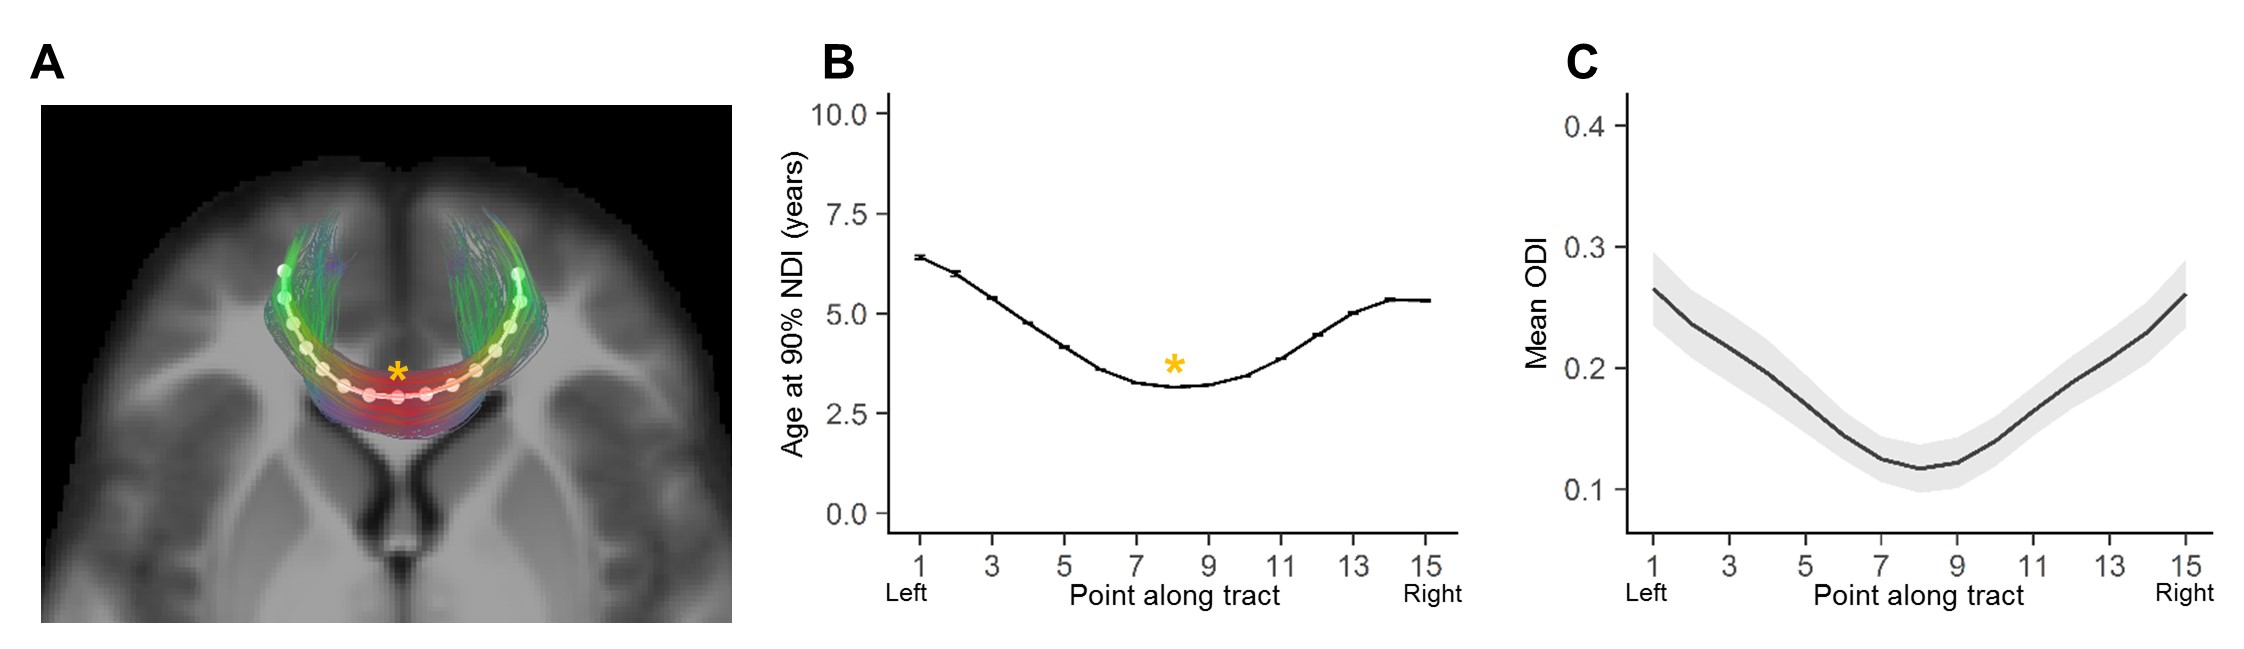
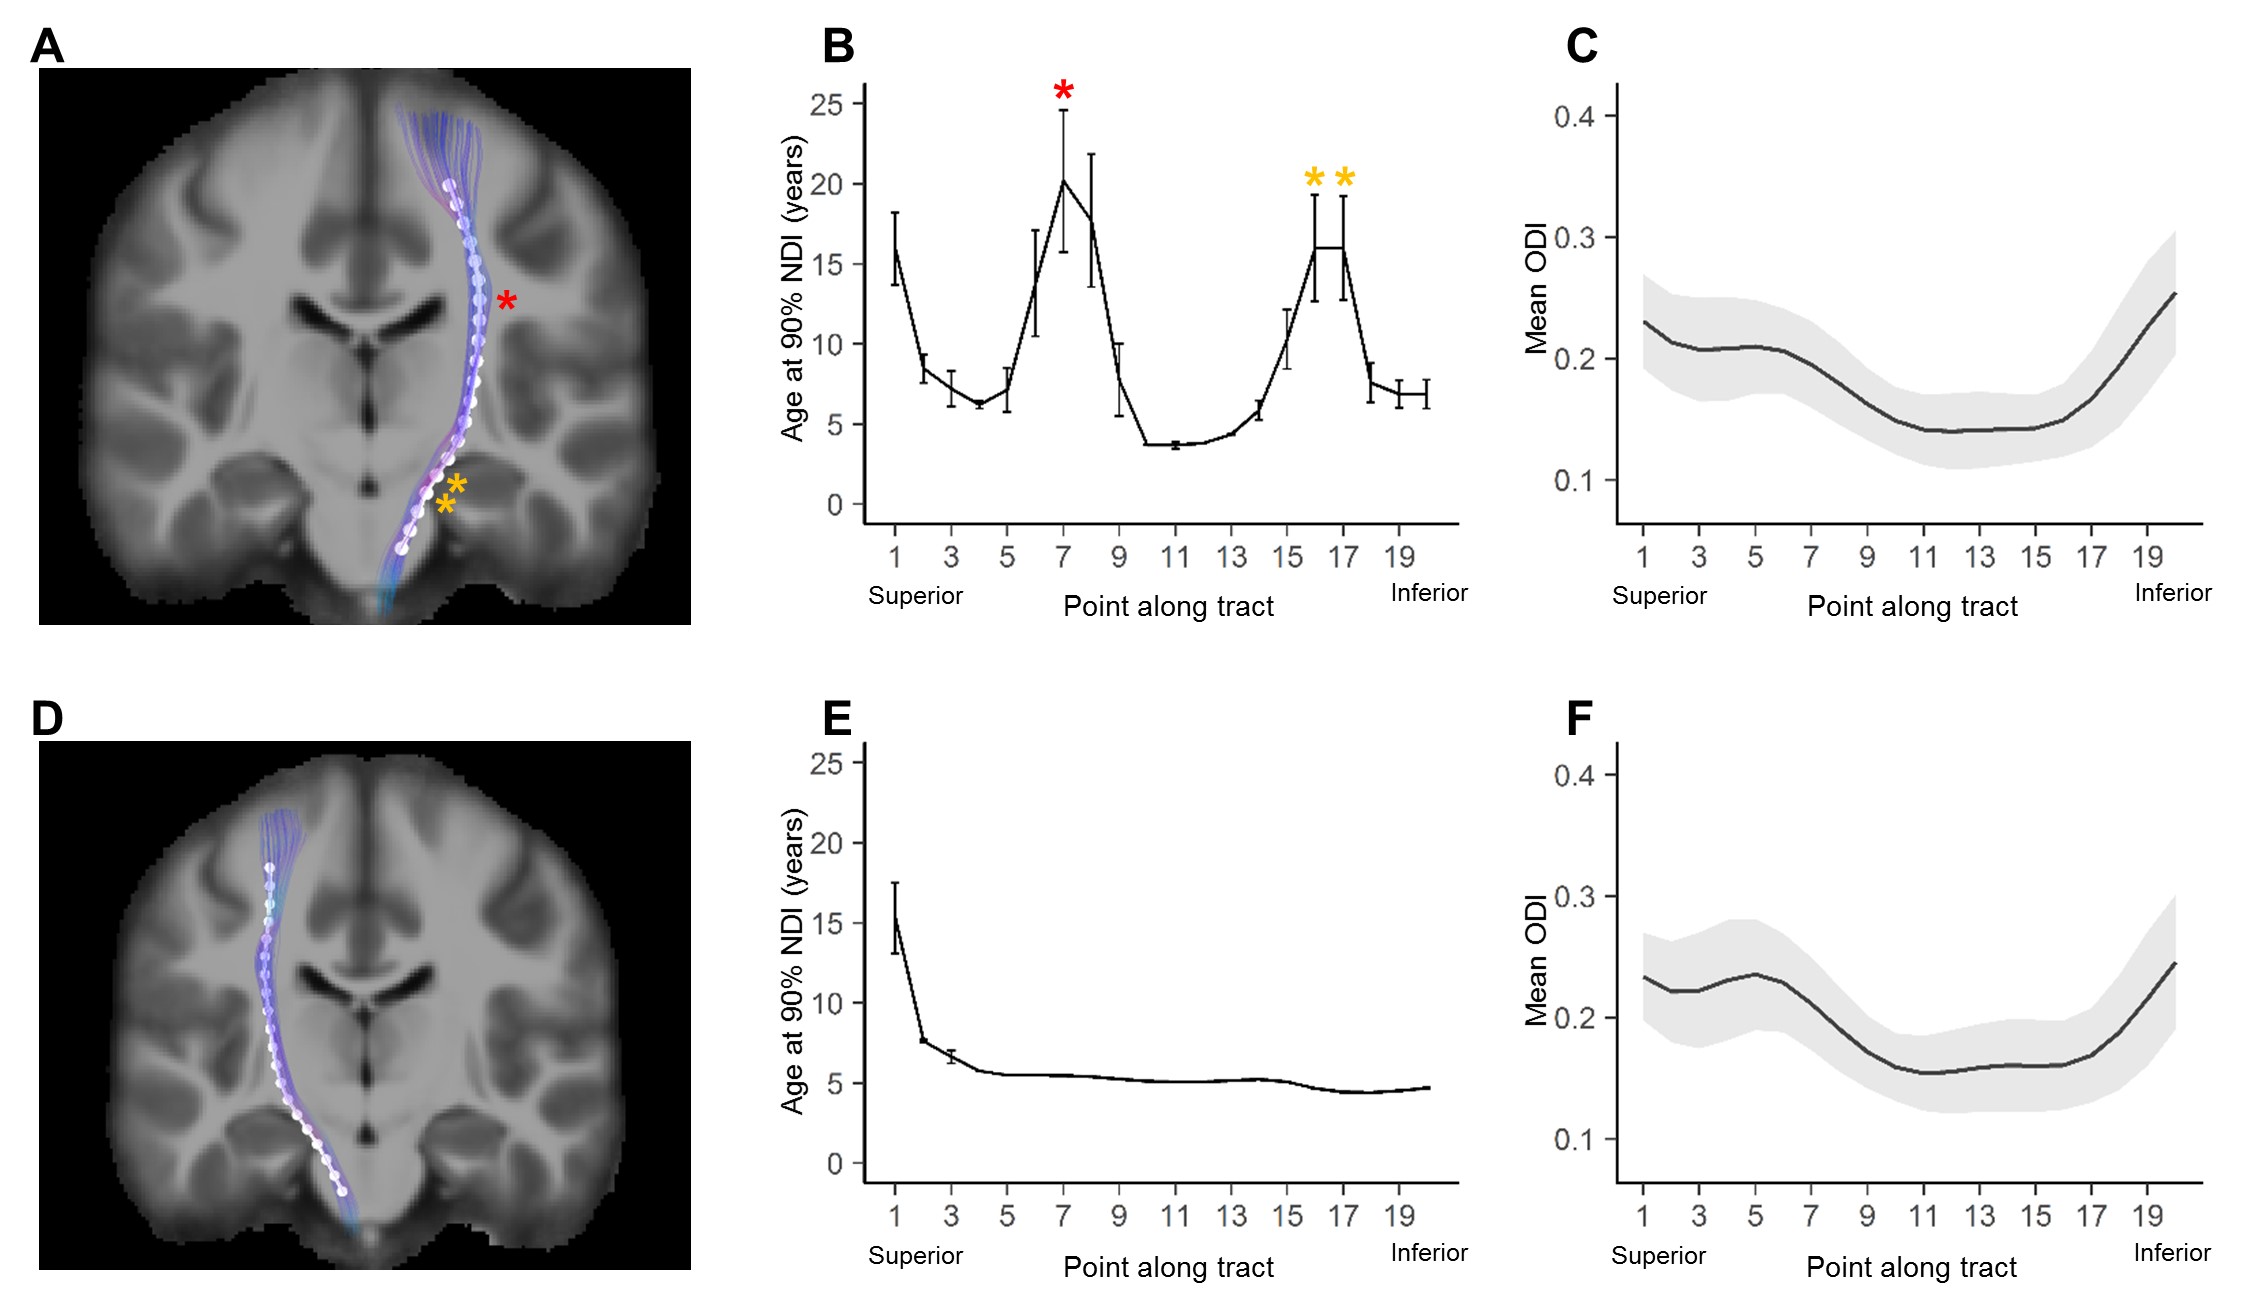
Average ODI varied along the lengths of the tract and tended to be higher in superficial tract segments compared to the core (Figure 2). However, regional ODI was not significantly associated with age and could not be described using a growth curve. Average NDI varied along the lengths of each tract and Brody growth models show the estimated age at terminal NDI varies along the length of each tract (Figure 3). Some tracts have similar patterns of development between the left and right hemispheres. For example, the developmental pattern of left hemisphere FMIN fibers mirrors that of the right FMIN – NDI develops latest in the cortical terminations to the frontal lobe, and gradually develops earlier as the fibers pass through the genu of the corpus callosum, bilaterally (Figure 4). Other tracts showed lateralized patterns of NDI development. For the left CST, two regions develop later and with more variability than the right, including the centrum semiovale and more inferiorally within the midbrain (Figure 5). The hemispheric asymmetries observed in these regions cannot be explained by ODI variability, since regional ODI is similar between the left and right hemispheres.Discussion
The present study used NODDI parameters sensitized to microstructural features to investigate the magnitude and timing of maturational changes in major white matter tracts from infancy through adolescence. White matter demonstrates nonlinear age-related increases in NDI with differing rates of change across tracts. Callosal fibers, such as the forceps minor and forceps major, develop earlier than association and fronto-temporal fibers. Additionally, ODI did not show significant associations with age, suggesting that white matter development over this time period is attributed to increases in neurite density, likely through increased axonal packing and myelination. Along-tract analyses of white matter maturation show the timing of NDI maturation varies along the length of individual tracts, with deep white matter developing earlier than superficial white matter. Furthermore, laterality was observed in the timing of NDI maturation in the CST, which may be attributed to the asymmetric functional specialization observed within the tract.Conclusion
In conclusion, this study shows white matter microstructural maturation as measured with NODDI is dynamic and heterogeneous. Along-tract analyses provide a framework to uncover spatial distributions of microstructural age effects within white matter tracts and our results show that maturation is not uniform across individual tracts. Overall, our results demonstrate the utility of NODDI models for characterizing the heterochronous developmental patterns of white matter microstructure. These results add to the growing body of research aiming to characterize how changes in brain structure contribute to complex cognitive function, as these efforts are necessary for ultimately understanding the origins of developmental disability.Acknowledgements
This work was supported by the Eunice Kennedy Shriver National Institute of Child Health and Human Development (R00HD065832), the National Institute of Biomedical Imaging and Bioengineering (P41EB015922 and U54EB020406), the National Institute of Neurological Disorders and Stroke (R21NS091586), and the National Institute of Mental Health (R01MH094343). This work was partially supported by a NARSAD Young Investigator Award. Data collection and sharing for this project was funded by The Cincinnati MR Imaging of Neurodevelopment study (C-MIND) (supported by the National Institute of Child Health and Human Development Grant HHSN275200900018C).References
[1] D. Rice and S. Barone, “Critical periods of vulnerability for the developing nervous system: Evidence from humans and animal models,” Environ. Health Perspect., vol. 108, no. SUPPL. 3, pp. 511–533, 2000.
[2] H. Zhang, T. Schneider, C. A. Wheeler-Kingshott, and D. C. Alexander, “NODDI: practical in vivo neurite orientation dispersion and density imaging of the human brain.,” Neuroimage, vol. 61, no. 4, pp. 1000–16, Jul. 2012.
[3] S. Holland et al., “The C-MIND project: normative MRI and behavioral data from children from birth to 18 years,” in Proceedings of the 21st Annumal Meeting of the Organization for Human Brain Mapping (OHBM), Honolulu, HA, 2015.
[4] R. P. Cabeen, D. H. Laidlaw, and A. W. Toga, “Quantitative imaging toolkit: Software for interactive 3D visualization, data exploration, and computational analysis of neuroimaging datasets,” 2018, p. Vol 2854.
[5] J. B. Colby, L. Soderberg, C. Lebel, I. D. Dinov, P. M. Thompson, and E. R. Sowell, “Along-tract statistics allow for enhanced tractography analysis,” Neuroimage, vol. 59, no. 4, pp. 3227–3242, 2012.
Figures