4664
Mahalanobis Distance Tractometry (MaD-Tract) for Multivariate Analyses1Medical Physics, University of Wisconsin - Madison, Madison, WI, United States, 2Pediatrics, University of Wisconsin - Madison, Madison, WI, United States
Synopsis
We present a multi-parameter tract profiling approach which allows for comparing diffusion imaging quantities between a single subject and a reference group along specific white matter path ways using the Mahalanobis distance (MaD). Implementation of MaD-Tract on a pediatric TBI-affected brain revealed several deviant tract segments in terms of elevated MaD values along multiple tracts compared to a group of healthy individuals.
Introduction
Tractometry allows for studying tissue microstructure along specific white-matter pathways. Recently, tractometry combined with principal component analysis1 was used for detecting group-wise differences along tract profiles of multiple microstrutural measures. However, some neurological conditions exhibit high spatial heterogeneity across subjects (e.g. traumatic brain injury (TBI), autism spectrum disorder (ASD), brain tumors) and are non-suitable for group-wise comparisons. Since the Mahalanobis distance is useful in identifying multi-dimensional data outliers, here we combine it with tractometry for comparing one subject to a reference group along multi-dimensional microstructure profiles of specific white matter bundles.The method, demonstrated using a TBI case, shows increased sensitivity in suggesting 'abnormal' tract segments compared to when only considering individual parameters.Method Description
Given bundle m and parameter θ, m is divided into t segments and θ is projected onto each segment resulting in a profile θ along m. For p parameters, p profiles of length t are generated. Consider matrix X of size nxp to represent a p-dimensional reference sample S of n healthy individuals. Tractometry of S yields t segments along m with an nxp matrix at each segment. Given subject i for comparison with tractometry along m, the Mahalanobis distance MaD between i and S is estimated at each segment asMaD(C,V) = ( (xi-C)T V-1 (xi-C) )1/2
C and V are respectively the mean vector and covariance matrix estimated from the nxp matrix of S, and xi is the 1xp parameter vector of i.
Implementation
Data: 25 severe TBI patient(ages:9-18) scans were collected across multiple centers/scanner using a standardized imaging protocol including diffusion weighted (b=1300s/mm2 along 64 directions, 8 volumes with b=0s/mm2, and 2.5mm isotropic resolution), and structural T1-and T2-weighted volumes. 35 typically-developing controls(ages:9-18) were scanned in the same scanner.Preprocessing: The data was corrected for artifacts due to:
- Gibbs ringing with MRTrix2,
- motion and eddy currents with FSL3, and
- susceptibility distortions using nonlinear warps with ANTs4 of the b=0 and mean of the diffusion weighted volumes to the T2 and T1 weighted images constrained along the phase encoding direction.
Diffusion Tensor (DT) Fitting: DTs were estimated using FSL's 'dtifit'6.
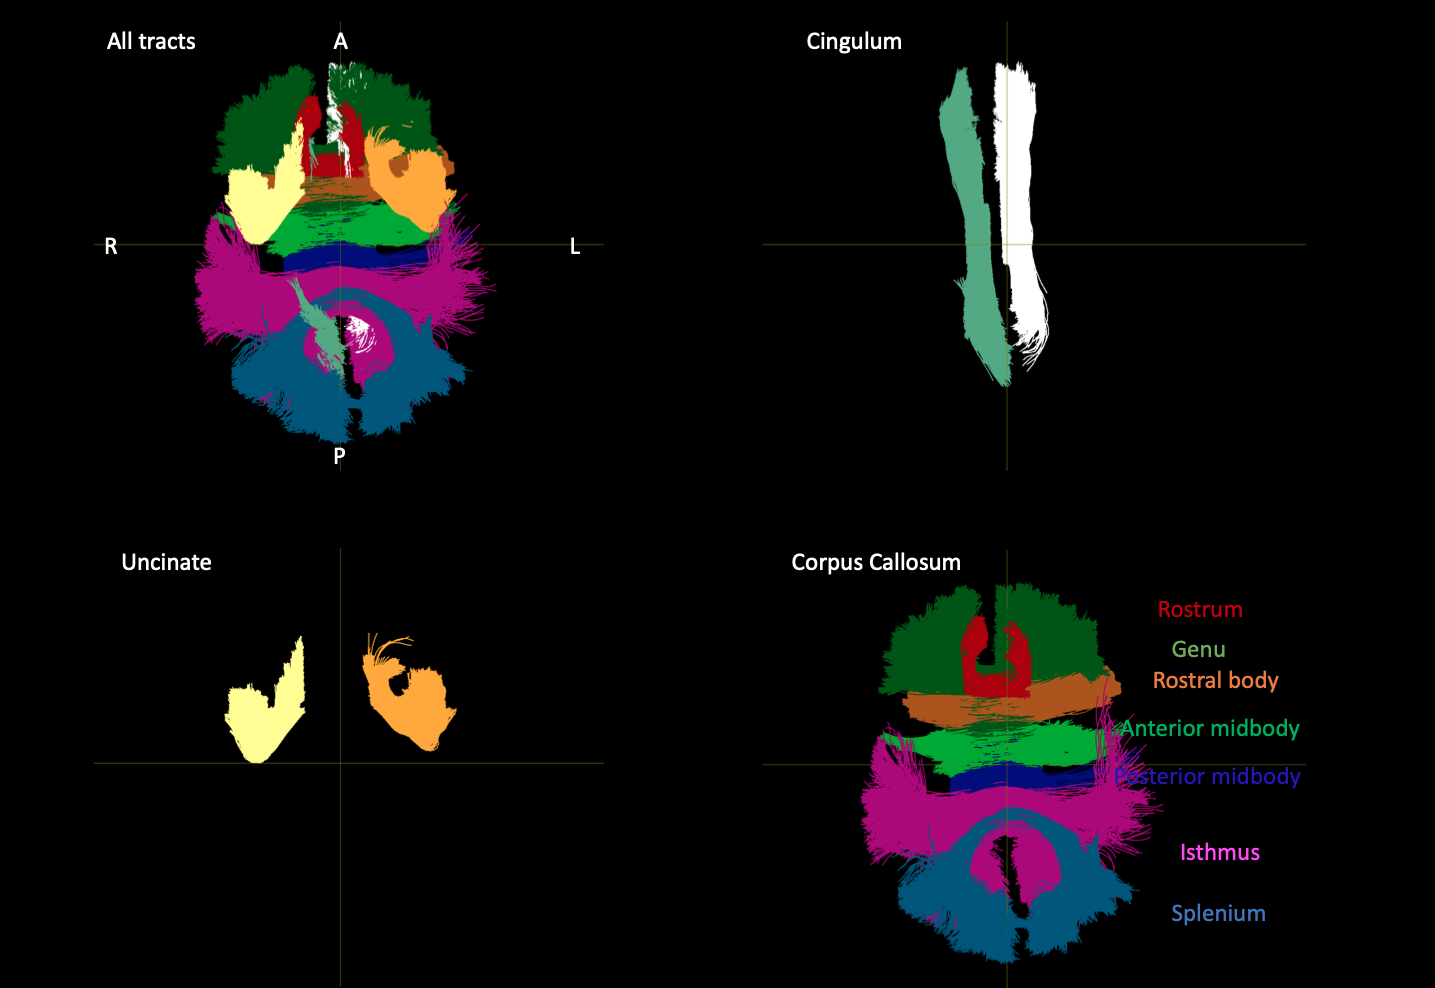
Tracking, Extraction, and Tractometry: FOD peaks were computed from the FODs using MRTrix's 'sh2peaks'. Tracking, bundle extraction, and tractometry were then performed using TracSeg7,8,9. This uses a previously trained deep learning model to extract 72 white matter bundles from the FOD peaks. For each bundle, probabilistic tracking was implemented with 5000 streamlines. For tractometry, the DT Eigen values, p=(L1, L2,L3), were profiled along 20 segments of each tract. These parameters were chosen because they are by definition the magnitudes of three orthogonal vectors, thus independent from one another. Before tractometry, the maps were masked with a white-matter mask. This mask was created by first thresholding FA at 0.2, then masking L2 using this initial mask. The masked L2 map was then thresholded at 0.0009mm2s-1 to further reduce CSF contaminated voxels near CSF regions. The resulting L2 was binarized and the mask was used to multiply the L1 and L3 maps.
MaD-Tract: MaD-Tract was done for the peri-callosal cingulum bundles, corpus callosum, and uncinate fasciculus bundles of one TBI subject. The data for this subject were collected in the same scanner as the reference sample, thus no data harmonization was required. These tracts were selected for evaluation as they are expected to be implicated in cognitive alterations following TBI. Additionally, MaD-Tract was performed for each subject in the reference sample in a leave-one-out fashion. Computations of mean, covariance, and MaD were done using Matlab.
Results
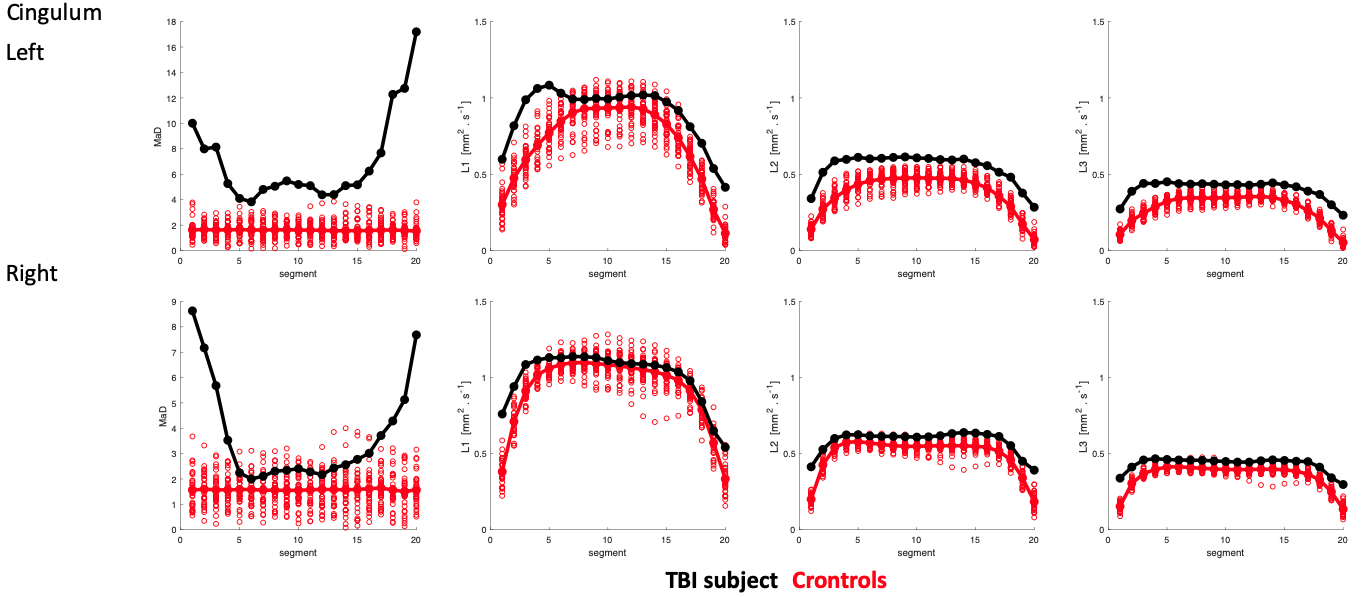
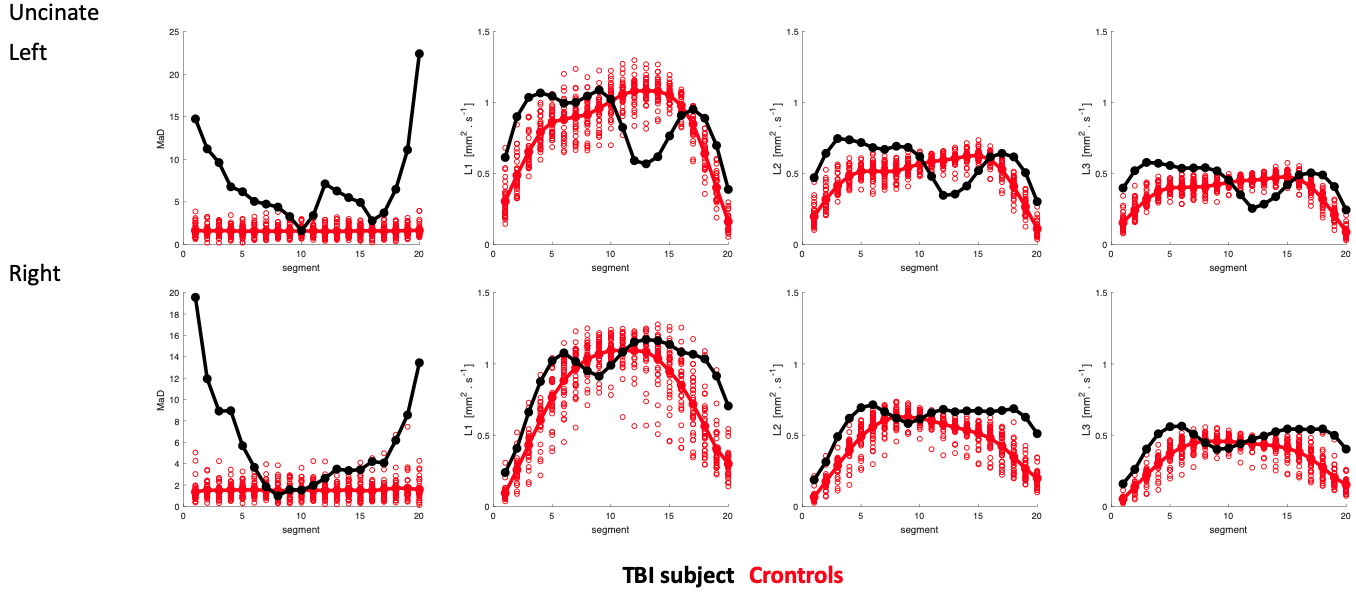
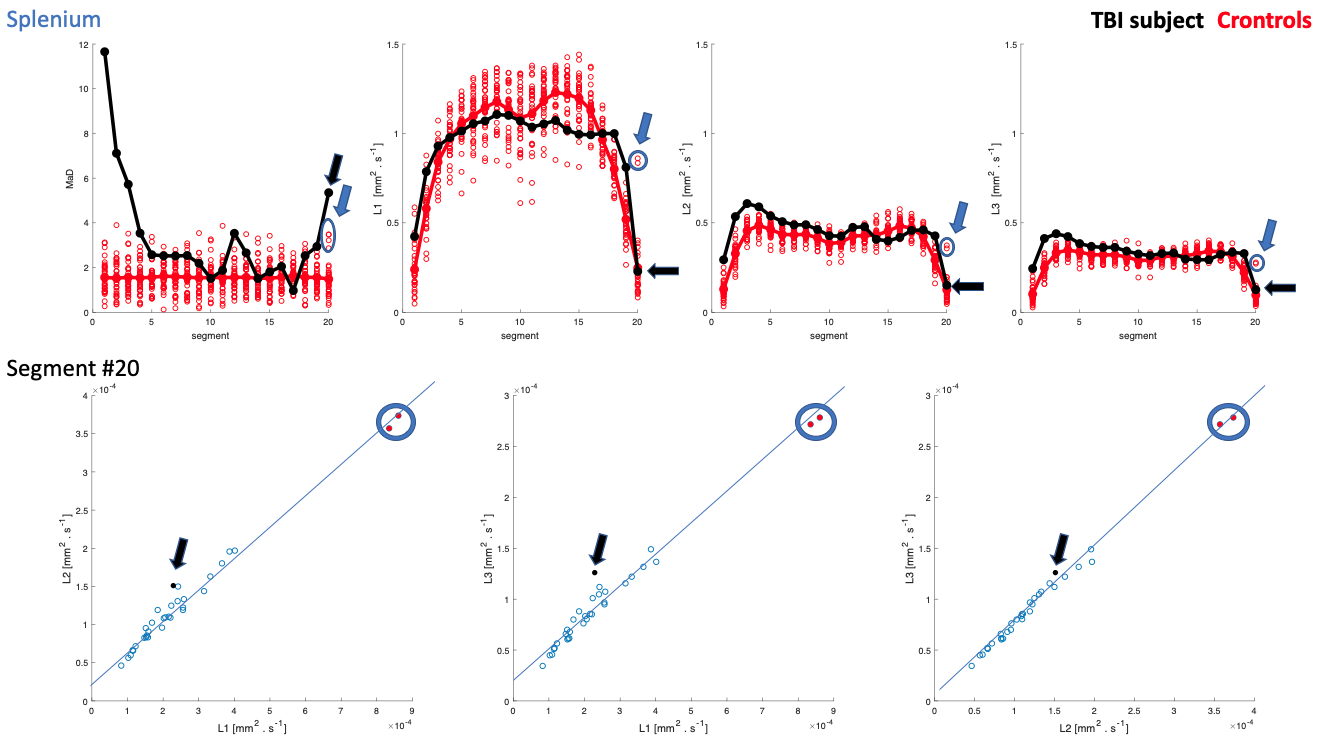
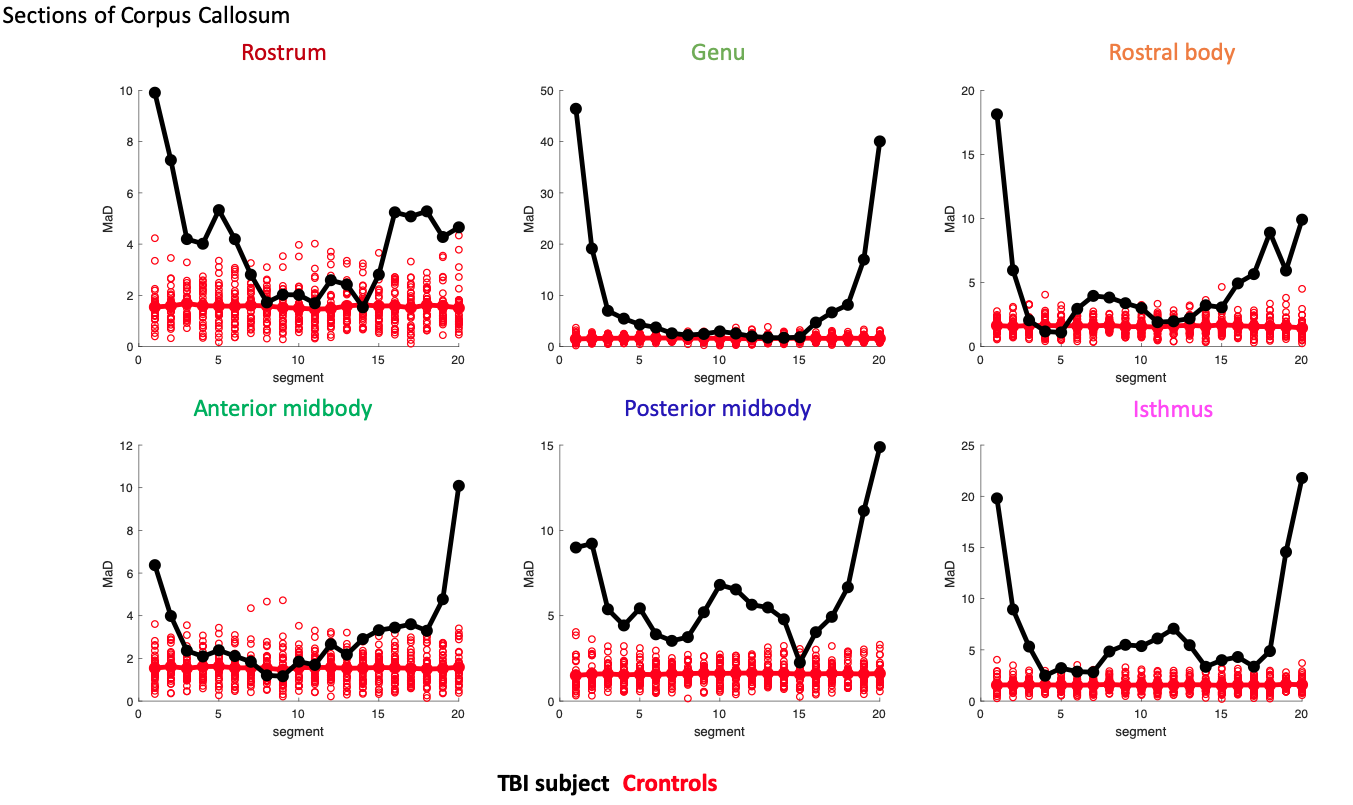
Extracted tracts on the TBI subject are shown in Fig-1. Cingulum and uncinate MaD and p=(L1,L2,L3) profiles for TBI and controls are shown in Figs-2:3. Compared to controls, elevated and normal MaD values appear at various segments along the TBI tracts with largest values generally occurring near end points.The TBI (L1,L2,L3) trajectories in comparison to controls in terms of distance from the mean generally differ from the MaD trajectories. Though distance from each parameter mean is considered in estimating MaD, large distance does not always translate to 'abnormal' MaD. See for example Fig-4 where a detailed analysis of one segment in the splenium depicts the role that covariance between parameter pairs plays in MaD.
Profiles of MaD for other corpus callosum sections are shown in Fig-5.
Conclusion
MaD-Tract is a multi-dimensional tractometry approach which allows for comparing one individual to a reference group along white-matter paths using the Mahalanobis distance without requiring image coregistration. Implementation on a TBI affected brain revealed various TBI tract segments with considerably larger MaD compared to controls.Future work will include correcting MaD estimates for sample-size-related biases and improving tract delineation strategies. Also, while some MaD TBI values are evidently deviant from the control sample, statistical thresholding strategies are under development.
Acknowledgements
Support for this work was provided by NIH grants NIH RO1 NS092870 and NIH U54 HD090256.
Support was also provided by the Science and Medicine Scholars Graduate Research Fellowship Program.
This material is also based upon work supported by the National Science Foundation Graduate Research Fellowship Program under Grant No.DGE- 1747503. Any opinions, findings, and conclusions or recommendations expressed in this material are those of the author(s) and do not necessarily reflect the views of the National Science Foundation.
References
1. Chamberland, Maxime, et al. "Dimensionality reduction of diffusion MRI measures for improved tractometry of the human brain." NeuroImage (2019).
2. Kellner, E; Dhital, B; Kiselev, V.G & Reisert, M. Gibbs-ringing artifact removal based on local subvoxel-shifts. Magnetic Resonance in Medicine, 2016, 76, 1574–1581.
3. Jesper L. R. Andersson and Stamatios N. Sotiropoulos. An integrated approach to correction for off-resonance effects and subject movement in diffusion MR imaging. NeuroImage, 125:1063-1078, 2016.
4. Avants, Brian B., Nick Tustison, and Gang Song. "Advanced normalization tools (ANTS)." Insight j 2 (2009): 1-35.
5. B. Jeurissen, J.-D. Tournier, T. Dhollander, A. Connelly, and J. Sijbers. Multi-tissue constrained spherical deconvolution for improved analysis of multi-shell diffusion MRI data. NeuroImage, 103 (2014), pp. 411–426.
6. M.W. Woolrich, S. Jbabdi, B. Patenaude, M. Chappell, S. Makni, T. Behrens, C. Beckmann, M. Jenkinson, S.M. Smith. Bayesian analysis of neuroimaging data in FSL. NeuroImage, 45:S173-86, 2009
7. Wasserthal, Jakob, Peter Neher, and Klaus H. Maier-Hein. "Tractseg-fast and accurate white matter tract segmentation." NeuroImage 183 (2018): 239-253.
8. Wasserthal, Jakob, Peter F. Neher, and Klaus H. Maier-Hein. "Tract orientation mapping for bundle-specific tractography." International Conference on Medical Image Computing and Computer-Assisted Intervention. Springer, Cham, 2018.
9. Wasserthal, Jakob, et al. "Combined tract segmentation and orientation mapping for bundle-specific tractography." arXiv preprint arXiv:1901.10271 (2019).
Figures