4663
Peak width of skeletonized water diffusion MRI in the neonatal brain1University of Edinburgh, Edinburgh, United Kingdom, 2Royal Hospital for Sick Children, Edinburgh, United Kingdom
Synopsis
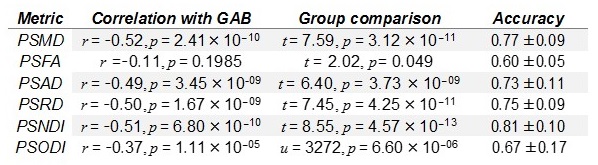
Preterm birth is closely associated with cognitive impairment and generalised dysconnectivity of developing white matter. Peak width of skeletonised DTI (MD, RD, AD, FA) and NODDI (NDI, ODI) metrics were used for characterising global connectivity during brain development. PSNDI was an excellent predictor for prematurity with an accuracy of 81 ± 10 %, followed by PSMD that achieved an accuracy of 77 ± 9 %. We conclude that the high accuracy in prediction and the ease of computation of these biomarkers make them useful new metrics of diffuse brain connectivity in neonatal populations.
Introduction
Preterm birth is closely associated with cognitive impairment and generalised dysconnectivity of developing white matter (WM) tracts inferred from DTI and NODDI metrics1,2. Peak width of skeletonized water mean diffusivity (PSMD), derived from a histogram analysis of mean diffusivity across the WM skeleton, is a useful biomarker of generalised dysconnectivity in neurodegenerative disease and is associated with information processing speed, a foundational property of cognition3, 4. We investigated the use of peak width skeletonised DTI (MD, RD, AD, FA) and NODDI (NDI, ODI) metrics for characterising generalised WM connectivity during brain development. We recruited 135 neonates to test the hypotheses that peak width skeletonised DTI and NODDI5 metrics: (1) differ between preterm infants and term controls; (2) correlate with gestational age at birth after adjustment for age at scan; and (3) can be used to classify neonatal data based on gestational age at birth.Methods
76 preterm and 59 term infants underwent MRI at term equivalent age at the Edinburgh Imaging Facility, Royal Infirmary of Edinburgh, University of Edinburgh, UK (Table 1). A Siemens MAGNETOM Prisma 3 T MRI clinical scanner (Siemens Healthcare Erlangen, Germany) with 16-channel phased-array paediatric head coil was used to acquire: 3D T2-weighted SPACE (T2w) (voxel size = 1mm isotropic) and axial dMRI data with volumes/b = 3/200, 6/500, 64/750 and 64/2500 s/mm2 and 16 non-weighted images (2mm isotropic).Processing: dMRI volumes were denoised6; eddy current, head movement and EPI geometric distortions were corrected7-9; and bias field inhomogeneity correction was applied10. A template was constructed using data from 50 term born infants using DTI-TK11, and all the subjects were aligned. The water diffusion tensor derived maps of each subject were calculated after registration and the NODDI metrics were propagated using the computed transformation. The main skeleton of the FA template was created by thresholding at 0.15, and individual FA maps were projected onto this skeleton. Using this projection, the remaining maps were also projected to the WM skeleton.
A custom mask was created by editing the skeleton mask to remove CSF and GM contaminated areas, and by removing tracts passing through the cerebellum, the brainstem and subcortical GM areas3. The resulting skeletonized maps were then multiplied by the custom mask. Peak width skeletonised MD, RD, AD, FA, NDI and ODI were calculated as the difference between the 95th and 5th percentiles3.
Statistical analysis: group comparisons were made using two-samples t-test for normally distributed variables and the Mann-Whitney U test for non normal variables. We then used PS DTI and NODDI metrics as predictors in a logistic regression model to discriminate between preterm and term born infants. We compared the performance of each metric individually and of three multivariate models including all the metrics, only DTI metrics and only NODDI metrics, respectively. Analyses were adjusted for age at scan. Prediction accuracy was measured using a 30-repeated 10-fold cross validation, meaning that in each of 30 repetitions data were randomly split in 10 folds of which one in turn was used as a test set to assess the generalization ability of the model trained on the remaining 9 folds. Accuracy was computed as the percentage of correctly classified subjects across folds and repetitions. Reported p-valued were FDR corrected for multiple comparisons.
Results
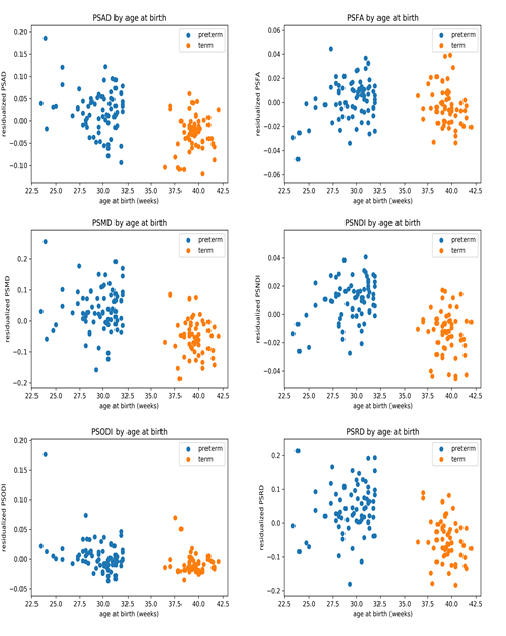
Figure 1 shows, the relationship between dMRI and NODDI metrics with GA at birth. A summary of Pearson’s correlations between each metric and GA and the results of group comparisons is shown in Table 2. Except for PSFA, all metrics have a significant correlation with GAB (p < 0.01) and group differences in the term vs. preterm comparison (p < 0.01, FDR corrected).Table 2 reports the cross-validation accuracy of each metric in the classification task (term vs. preterm). All metrics achieved at least 70% accuracy, with the exception of PSFA (60 ± 5%) and PSODI (67 ± 17%). PSMD and PSNDI obtained the best results among the DTI and NODDI metrics respectively. Combining the metrics in a multivariate model only slightly increased the prediction accuracy: all DTI metrics, 79 ± 9% accuracy; all NODDI metrics, 81 ± 6% accuracy; all metrics, 79 ± 6% accuracy.
Discussion
Peak width of skeletonized MD, RD, AD, NDI and ODI at term equivalent age correlated with GA at birth and differed between preterm infants and term controls. Because these dMRI metrics represent generalised measures of water content, myelination, and the complexity of dendrites and axons across the WM skeleton, they may be useful for investigating dysconnectivity associated with preterm birth.PSMD and PSNDI appear to be the most promising metrics for tasks that require age prediction due to their relative ease of computational processing compared with other age prediction methods, and their comparable accuracy12.
Acknowledgements
We are grateful to the families who consented to take part in the study. This work was supported by Theirworld (\url{www.theirworld.org}) and was undertaken in the MRC Centre for Reproductive Health, which is funded by MRC Centre Grant (MRC G1002033). MJT was supported by NHS Lothian Research and Development Office.
References
1 Pecheva, D., Kelly, C., Kimpton, J., Bonthrone, A., Batalle, D., Zhang, H., et al. (2018). Recent advances in diffusion neuroimaging: applications in the developing preterm brain [version 1; peer review: 2 approved]. F1000Research 7. doi:10.12688/f1000research.15073.1
2 Telford, E. J., Cox, S. R., Fletcher-Watson, S., Anblagan, D., Sparrow, S., Pataky, R., et al. (2017). A latent measure explains substantial variance in white matter microstructure across the newborn human brain. Brain Structure and Function 222, 4023–4033. doi:10.1007/s00429-017-1455-6
3 Baykara, E., Gesierich, B., Adam, R., Tuladhar, A. M., Biesbroek, J. M., Koek, H. L., et al. (2016). A novel imaging marker for small vessel disease based on skeletonization of white matter tracts and diffusion histograms. Annals of Neurology 80, 581–592. doi:10.1002/ana.24758
4 Deary, I. J., Ritchie, S. J., Munoz Maniega, S., Cox, S. R., Valdes Hernandez, M. C., Luciano, M., et al. (2019). Brain peak width of skeletonized mean diffusivity (psmd) and cognitive function in later life. Frontiers in Psychiatry 10, 524. doi:10.3389/fpsyt.2019.00524
5 Zhang, H., Schneider, T., Wheeler-Kingshott, C. A., and Alexander, D. C. (2012). NODDI: Practical in vivo neurite orientation dispersion and density imaging of the human brain. NeuroImage 61, 1000–1016. doi:10.1016/j.neuroimage.2012.03.072
6 J. Veraart, D. S. Novikov, D. Christiaens, B. Ades-aron, J. Sijbers, E. Fieremans, Denoising of diffusion MRI using random matrix theory, NeuroImage 142 (2016b) 394–406
7 J. L. Andersson, S. N. Sotiropoulos, An integrated approach to correction for off-resonance effects and subject movement in diffusion MR imaging, NeuroImage 125 (2016) 1063–107
8 J. L. Andersson, M. S. Graham, E. Zsoldos, S. N. Sotiropoulos, Incorporating outlier detection and replacement into a non-parametric framework for movement and distortion correction of diffusion MR images, NeuroImage 141 (2016) 556–572.
9 J. L. Andersson, M. S. Graham, I. Drobnjak, H. Zhang, N. Filippini, M. Bastiani, Towards a comprehensive framework for movement and distortion correction of diffusion MR images: Within volume movement, NeuroImage 152 (2017) 450–466.
10 N. J. Tustison, B. B. Avants, P. A. Cook, Y. Zheng, A. Egan, P. A. Yushkevich, J. C. Gee, N4ITK: Improved N3 bias correction, IEEE Transactions on Medical Imaging 29 (2010) 1310–1320.
11 Zhang, H., Yushkevich, P. A., Rueckert, D., and Gee, J. C. (2007). Unbiased white matter atlas construction using diffusion tensor images. In Medical Image Computing and Computer-Assisted Intervention– MICCAI 2007, eds. N. Ayache, S. Ourselin, and A. Maeder (Berlin, Heidelberg: Springer Berlin Heidelberg), 211–218
12 Ball, G., Aljabar, P., Arichi, T., Tusor, N., Cox, D., Merchant, N., et al. (2016). Machine-learning to characterise neonatal functional connectivity in the preterm brain. NeuroImage 124, 267–275. doi:10.1016/J.NEUROIMAGE.2015.08.055
Figures